
Activated Carbon Market Size and Forecast (2020 - 2033), Global and Regional Growth, Trend, Share and Industry Analysis Report Coverage; By Product Type (Powdered Activated Carbon, Granular Activated Carbon, Extruded/ Pelletized Activated Carbon, Impregnated Activated Carbon, Bead Activated Carbon); By Application (Water Treatment, Air Purification, Food & Beverage, Pharmaceuticals, Industrial Processing, Automotive, Others); and Geography
2025-08-12
Chemicals & Materials
Jaya Bundele (Research Analyst)
Description
Activated Carbon Market
Overview
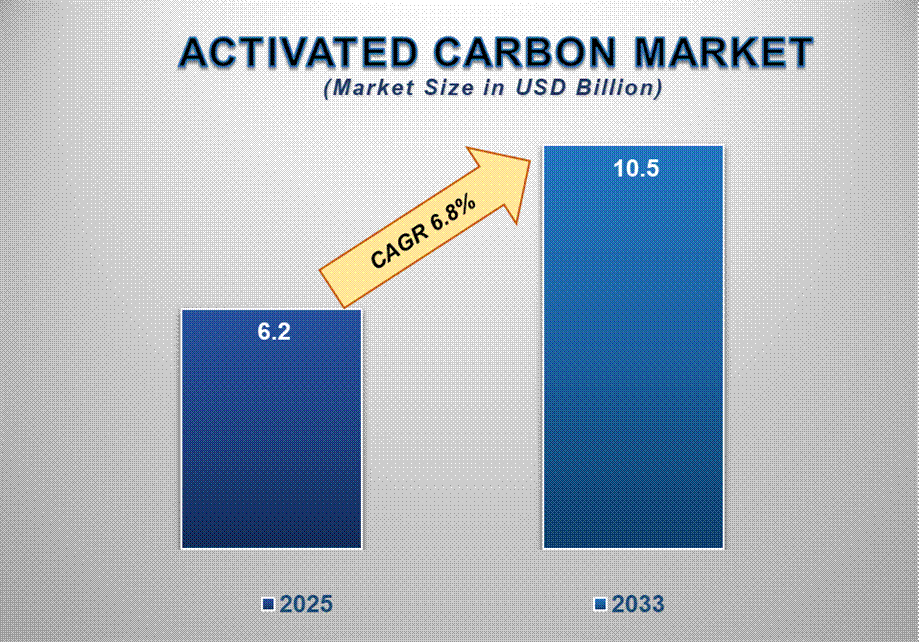
The global activated carbon market size is poised for steady growth from 2025 to 2033, driven by increasing demand for clean water, stringent environmental regulations, and expanding industrial activities. Valued at approximately USD 6.2 billion in 2025, the market is projected to reach USD 10.5 billion by 2033, growing at a CAGR of 6.8% during the forecast period.
Activated carbon, known for its
superior adsorption properties, is widely used in purification, filtration, and
separation processes. Its ability to trap organic compounds, chemicals, and
contaminants makes it indispensable in sectors such as water treatment, air
purification, and pharmaceuticals. The growing emphasis on sustainable
industrial operations, along with regulatory mandates for emissions control, is
accelerating market penetration across developed and emerging economies.
Additionally, the use of activated carbon in electric vehicle batteries and
energy storage systems is opening new frontiers. Asia-Pacific leads the market
due to rapid industrialization, urban water stress, and rising pollution
levels.
Activated Carbon Market
Drivers and Opportunities
Rising Demand for Water Purification and Wastewater Treatment
The global water crisis and the
increasing need for clean, safe drinking water are major catalysts for the
growth of the activated carbon market. Activated carbon is widely used in both
municipal and industrial water treatment plants to remove organic compounds,
heavy metals, chlorine, and other contaminants. Governments and private
entities across regions such as Asia-Pacific, Africa, and Latin America are
investing heavily in wastewater treatment infrastructure to address
urbanization and pollution issues. Moreover, stricter environmental
regulations, like the U.S. EPA’s Safe Drinking Water Act and the EU’s Water
Framework Directive, are mandating the use of advanced purification
technologies. Activated carbon’s effectiveness in removing PFAS (per- and polyfluoroalkyl
substances), pharmaceuticals, and microplastics further increases its utility.
The growing emphasis on circular water use, decentralized water systems, and
industrial water reuse is expected to fuel continued demand for
high-performance activated carbon products, especially powdered and granular
forms.
Tightening Air Quality Regulations and Industrial Emission
Control
With growing public health
awareness and climate change concerns, governments around the world are
enacting stricter regulations on air quality and industrial emissions.
Activated carbon is a critical material used to control harmful air pollutants
such as mercury, VOCs (volatile organic compounds), SOx, NOx, and dioxins in
power generation, cement, chemical, and metal processing industries. Countries
like China, India, the U.S., and members of the EU are enforcing compliance
with national and international emission standards, driving demand for air
purification solutions embedded with activated carbon filters. Additionally,
indoor air quality concerns in commercial buildings and healthcare facilities
are boosting demand for HVAC filtration systems. Activated carbon’s role in
capturing odors and toxins in confined environments like airplanes and vehicles
is also expanding. These regulatory drivers, coupled with growing investments
in sustainable industry operations, are propelling the adoption of activated carbon
technologies in emission abatement.
Opportunity: Expansion into Energy Storage and EV Battery
Applications
The transition to green energy
and the rise of electric vehicles (EVs) are creating new and lucrative
opportunities for activated carbon. In lithium-ion and supercapacitor
batteries, activated carbon is increasingly being used due to its high surface
area, conductivity, and charge-storage properties. Supercapacitors, which use
activated carbon in electrodes, are essential for energy storage systems
requiring rapid charge-discharge cycles. This is gaining traction in EVs,
renewable energy storage, and backup power applications. The market for
high-purity, tailor-engineered activated carbon for energy systems is
expanding, especially in regions such as North America, Europe, and China.
Moreover, research into bio-based carbon materials and carbon aerogels is
opening avenues for high-performance, lightweight, and sustainable energy
storage solutions. As the global demand for clean energy technologies
accelerates, activated carbon is expected to emerge as a critical material in
the energy transition era.
Activated Carbon Market Scope
|
Report Attributes |
Description |
|
Market Size in 2025 |
USD 6.2 Billion |
|
Market Forecast in 2033 |
USD 10.5 Billion |
|
CAGR % 2025-2033 |
6.8% |
|
Base Year |
2024 |
|
Historic Data |
2020-2024 |
|
Forecast Period |
2025-2033 |
|
Report USP |
Production, Consumption, company share, company heatmap, company
production, growth factors and more |
|
Segments Covered |
●
By Product Type ●
By Application |
|
Regional Scope |
●
North America ●
Europe ●
APAC ●
Latin America ●
Middle East and Africa |
|
Country Scope |
1)
U.S. 2)
Canada 3)
U.K. 4)
Germany 5)
France 6)
Italy 7)
Spain 8)
Netherland 9)
China 10)
India 11)
Japan 12)
South Korea 13)
Australia 14)
Mexico 15)
Brazil 16)
Argentina 17)
Saudi Arabia 18)
UAE 19)
Egypt 20) South Africa |
Activated Carbon Market Report Segmentation Analysis
The global Activated Carbon
Market industry analysis is segmented by product type, by application, and by
region.
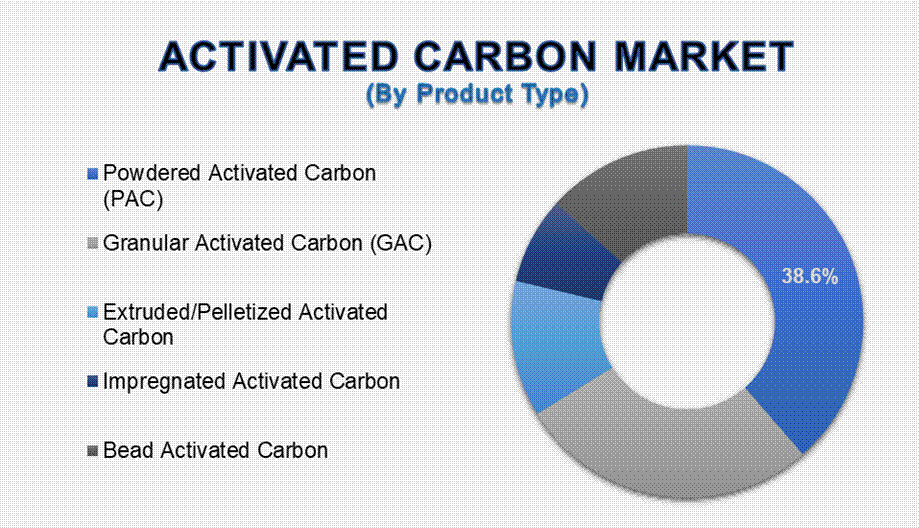
Powdered Activated Carbon (PAC) Segment to Dominate the
Market
Powdered activated carbon holds the largest share in the product type segment due to its widespread use in water treatment and food processing. PAC’s fine particle size and large surface area allow for quick adsorption of contaminants, making it ideal for emergency water treatment and seasonal taste and odor control. Its cost-effectiveness and versatility also contribute to high adoption in municipal and industrial applications. PAC is used on a per-dosage basis, offering flexibility for varying treatment needs. As urban populations rise and water quality challenges persist, the demand for PAC, especially in Asia-Pacific and African nations, is projected to grow steadily.
Water Treatment is the Leading Application Segment
The water treatment segment
dominates activated carbon applications, accounting for the highest market
share in 2025. Activated carbon is essential in removing organic pollutants,
pesticides, chlorine, and taste/odor-causing compounds from drinking water. Its
use is also critical in industrial wastewater treatment, where it helps meet
discharge regulations. With increasing concerns around water scarcity and
contamination, municipalities are upgrading infrastructure with granular and
powdered carbon filters. Innovations like reactivated carbon, which offer
environmental and economic benefits, are also supporting segment growth.
Government mandates to limit PFAS and pharmaceutical residues are boosting
demand further.
The following segments are part of an in-depth analysis of the global
Activated Carbon Market:
|
Market Segments |
|
|
By Product Type |
●
Powdered Activated
Carbon (PAC) ●
Granular Activated
Carbon (GAC) ●
Extruded/Pelletized
Activated Carbon ●
Impregnated
Activated Carbon ●
Bead Activated
Carbon |
|
By Application |
●
Water Treatment ●
Air Purification ●
Food & Beverage ●
Pharmaceuticals ●
Industrial
Processing ●
Automotive ●
Others |
Activated Carbon Market
Share Analysis by Region
Asia-Pacific Leads the Global Activated Carbon Market
Research
Asia-Pacific is expected to lead
the global activated carbon market price during the forecast period, driven by
growing water treatment needs, rising industrialization, and air pollution
control mandates. China, India, and Southeast Asian nations are experiencing
rapid urbanization, leading to increased demand for potable water and emissions
regulation. Additionally, the presence of numerous activated carbon
manufacturers and a large base of raw materials like coconut shell and wood in
the region supports supply chain efficiency. Ongoing investments in industrial
wastewater treatment, coal-fired power plant emissions control, and food &
beverage processing also contribute to market dominance. Moreover, the Asia-Pacific
region is emerging as a hub for energy storage innovation, further boosting
demand for high-performance activated carbon.
Global Activated Carbon
Market Recent Developments News:
- In May 2025, Cabot Corporation introduced a new
series of high-purity activated carbon products specifically engineered
for use in lithium-ion battery applications. These advanced materials are
designed to enhance energy storage efficiency, improve conductivity, and
extend battery life cycles. With the surging adoption of electric vehicles
and grid-scale battery storage systems, the demand for superior carbon
materials is rising. This product launch positions Cabot to cater to a
fast-growing segment of the energy storage market, aligning with global
electrification and sustainability goals.
- March 2025 – Kuraray Co., Ltd. announced the
expansion of its activated carbon production facility in Vietnam, aiming
to boost capacity and improve supply chain responsiveness across Southeast
Asia. This expansion is in response to growing regional demand for water
and air purification solutions in industrial and municipal sectors. The
company emphasized that the investment would enhance its competitiveness
in emerging markets while supporting environmental sustainability
initiatives and regulatory compliance across the region.
- December 2024 – Jacobi Carbons AB unveiled a new
product line of specialized activated carbon designed for the removal of
PFAS (per- and polyfluoroalkyl substances) in municipal water treatment
systems. This innovation responds to increasing public concern and
regulatory action surrounding PFAS contamination in drinking water. The
new products offer high adsorption efficiency and longer service life,
supporting municipalities in meeting strict environmental standards.
Jacobi’s focus on advanced purification technologies further reinforces
its position as a leader in sustainable water treatment solutions.
The Global Activated
Carbon Market is dominated by a few large companies, such as
●
Cabot Corporation
●
Calgon Carbon
Corporation (Kuraray Co., Ltd.)
●
Jacobi Carbons AB
●
Haycarb PLC
●
Donau Carbon GmbH
●
Osaka Gas Chemicals
Co., Ltd.
●
Carbotech AC GmbH
●
Carbon Activated
Corporation
●
Boyce Carbon
●
DESOTEC Activated
Carbon
●
Veolia Water
Technologies
●
Silcarbon Aktivkohle
GmbH
●
Evoqua Water
Technologies LLC
●
ADA Carbon Solutions
LLC
● CECA (Arkema Group) Other Prominent Players
Frequently Asked Questions
Jaya Bundele (Research Analyst)
Jaya Bundele is a skilled Research Analyst with 4+ years of experience in market intelligence, consumer insights, competitive analysis, and industry forecasting across the consumer goods, agriculture, and food & beverage sectors. She specializes in market sizing, trend analysis, growth opportunity mapping, and strategic secondary research for global and regional markets.
Her expertise lies in transforming complex industry data into actionable business strategies that help organizations identify emerging trends, understand customer behavior, and gain a competitive edge. With a strong focus on data-driven insights, business intelligence, and future market trends, Jaya delivers high-quality research solutions aligned with evolving industry demands and market dynamics.
- Global Activated Carbon Market Introduction and Market Overview
- Objectives of the Study
- Global Activated Carbon Market Scope and Market Estimation
- Global Activated Carbon Market Overall Market Size (US$ Bn), Market CAGR (%), Market forecast (2025 - 2033)
- Global Activated Carbon Market Revenue Share (%) and Growth Rate (Y-o-Y) from 2021 - 2033
- Market Segmentation
- Product Type of Global Activated Carbon Market
- Application of Global Activated Carbon Market
- Region of Global Activated Carbon Market
- Executive Summary
- Demand Side Trends
- Key Market Trends
- Market Demand (US$ Bn) Analysis 2021 – 2024 and Forecast, 2025 – 2033
- Demand and Opportunity Assessment
- Demand Supply Scenario
- Market Dynamics
- Drivers
- Limitations
- Opportunities
- Impact Analysis of Drivers and Restraints
- Emerging Trends for Activated Carbon Market
- Key Products/Brand Analysis
- Pricing Analysis
- Porter’s Five Forces Analysis
- PEST Analysis
- Key Regulation
- Global Activated Carbon Market Estimates & Historical Trend Analysis (2021 - 2024)
- Global Activated Carbon Market Estimates & Forecast Trend Analysis, by Product Type
- Global Activated Carbon Market Revenue (US$ Bn) Estimates and Forecasts, by Product Type, 2021 - 2033
- Powdered Activated Carbon (PAC)
- Granular Activated Carbon (GAC)
- Extruded/Pelletized Activated Carbon
- Impregnated Activated Carbon
- Bead Activated Carbon
- Global Activated Carbon Market Revenue (US$ Bn) Estimates and Forecasts, by Product Type, 2021 - 2033
- Global Activated Carbon Market Estimates & Forecast Trend Analysis, by Application
- Global Activated Carbon Market Revenue (US$ Bn) Estimates and Forecasts, by Application, 2021 - 2033
- Water Treatment
- Air Purification
- Food & Beverage
- Pharmaceuticals
- Industrial Processing
- Automotive
- Others
- Global Activated Carbon Market Revenue (US$ Bn) Estimates and Forecasts, by Application, 2021 - 2033
- Global Activated Carbon Market Estimates & Forecast Trend Analysis, by region
- Global Activated Carbon Market Revenue (US$ Bn) Estimates and Forecasts, by region, 2021 - 2033
- North America
- Europe
- Asia Pacific
- Middle East & Africa
- Latin America
- Global Activated Carbon Market Revenue (US$ Bn) Estimates and Forecasts, by region, 2021 - 2033
- North America Activated Carbon Market: Estimates & Forecast Trend Analysis
- North America Activated Carbon Market Assessments & Key Findings
- North America Activated Carbon Market Introduction
- North America Activated Carbon Market Size Estimates and Forecast (US$ Billion) (2021 - 2033)
- By Product Type
- By Application
- By Country
- The U.S.
- Canada
- North America Activated Carbon Market Assessments & Key Findings
- Europe Activated Carbon Market: Estimates & Forecast Trend Analysis
- Europe Activated Carbon Market Assessments & Key Findings
- Europe Activated Carbon Market Introduction
- Europe Activated Carbon Market Size Estimates and Forecast (US$ Billion) (2021 - 2033)
- By Product Type
- By Application
- By Country
- Germany
- Italy
- K.
- France
- Spain
- Netherland
- Rest of Europe
- Europe Activated Carbon Market Assessments & Key Findings
- Asia Pacific Activated Carbon Market: Estimates & Forecast Trend Analysis
- Asia Pacific Market Assessments & Key Findings
- Asia Pacific Activated Carbon Market Introduction
- Asia Pacific Activated Carbon Market Size Estimates and Forecast (US$ Billion) (2021 - 2033)
- By Product Type
- By Application
- By Country
- China
- Japan
- India
- Australia
- South Korea
- Rest of Asia Pacific
- Asia Pacific Market Assessments & Key Findings
- Middle East & Africa Activated Carbon Market: Estimates & Forecast Trend Analysis
- Middle East & Africa Market Assessments & Key Findings
- Middle East & Africa Activated Carbon Market Introduction
- Middle East & Africa Activated Carbon Market Size Estimates and Forecast (US$ Billion) (2021 - 2033)
- By Product Type
- By Application
- By Country
- UAE
- Saudi Arabia
- South Africa
- Rest of MEA
- Middle East & Africa Market Assessments & Key Findings
- Latin America Activated Carbon Market: Estimates & Forecast Trend Analysis
- Latin America Market Assessments & Key Findings
- Latin America Activated Carbon Market Introduction
- Latin America Activated Carbon Market Size Estimates and Forecast (US$ Billion) (2021 - 2033)
- By Product Type
- By Application
- By Country
- Brazil
- Mexico
- Argentina
- Rest of LATAM
- Latin America Market Assessments & Key Findings
- Country Wise Market: Introduction
- Competition Landscape
- Global Activated Carbon Market Product Mapping
- Global Activated Carbon Market Concentration Analysis, by Leading Players / Innovators / Emerging Players / New Entrants
- Global Activated Carbon Market Tier Structure Analysis
- Global Activated Carbon Market Concentration & Company Market Shares (%) Analysis, 2024
- Company Profiles
- Deere & Company
- Company Overview & Key Stats
- Financial Performance & KPIs
- Product Portfolio
- SWOT Analysis
- Business Strategy & Recent Developments
- Deere & Company
* Similar details would be provided for all the players mentioned below
- Trimble Inc.
- AGCO Corporation
- Topcon Positioning Systems
- Raven Industries
- Climate LLC (Bayer)
- CNH Industrial
- Hexagon Agriculture
- Ag Leader Technology
- Taranis
- Arable Labs
- Kubota Corporation
- CropX Technologies
- Farmers Edge
- Granular Inc.
- Other Prominent Players
- Research Methodology
- External Databases
- Internal Proprietary Database
- Primary Research
- Secondary Research
- Assumptions
- Limitations
- Report FAQs
- Research Findings & Conclusion
Our Research Methodology
"Insight without rigor is just noise."
We follow a comprehensive, multi-phase research framework designed to deliver accurate, strategic, and decision-ready intelligence. Our process integrates primary and secondary research , both quantitative and qualitative , along with dual modeling techniques ( top-down and bottom-up) and a final layer of validation through our proprietary in-house repository.
PRIMARY RESEARCH
Primary research captures real-time, firsthand insights from the market to understand behaviors, motivations, and emerging trends.
1. Quantitative Primary Research
Objective: Generate statistically significant data directly from market participants.
Approaches:- Structured surveys with customers, distributors, and field agents
- Mobile-based data collection for point-of-sale audits and usage behavior
- Phone-based interviews (CATI) for market sizing and product feedback
- Online polling around industry events and digital campaigns
- Purchase frequency by customer type
- Channel performance across geographies
- Feature demand by application or demographic
2. Qualitative Primary Research
Objective: Explore decision-making drivers, pain points, and market readiness.
Approaches:- In-depth interviews (IDIs) with executives, product managers, and key decision-makers
- Focus groups among end users and early adopters
- Site visits and observational research for consumer products
- Informal field-level discussions for regional and cultural nuances
SECONDARY RESEARCH
This phase helps establish a macro-to-micro understanding of market trends, size, regulation, and competitive dynamics, sourced from credible and public domain information.
1. Quantitative Secondary Research
Objective: Model market value and segment-level forecasts based on published data.
Sources include:- Financial reports and investor summaries
- Government trade data, customs records, and regulatory statistics
- Industry association publications and economic databases
- Channel performance and pricing data from marketplace listings
- Revenue splits, pricing trends, and CAGR estimates
- Supply-side capacity and volume tracking
- Investment analysis and funding benchmarks
2. Qualitative Secondary Research
Objective: Capture strategic direction, innovation signals, and behavioral trends.
Sources include:- Company announcements, roadmaps, and product pipelines
- Publicly available whitepapers, conference abstracts, and academic research
- Regulatory body publications and policy briefs
- Social and media sentiment scanning for early-stage shifts
- Strategic shifts in market positioning
- Unmet needs and white spaces
- Regulatory triggers and compliance impact

DUAL MODELING: TOP-DOWN + BOTTOM-UP
To ensure robust market estimation, we apply two complementary sizing approaches:
Top-Down Modeling:- Start with broader industry value (e.g., global or regional TAM)
- Apply filters by segment, geography, end-user, or use case
- Adjust with primary insights and validation benchmarks
- Ideal for investor-grade market scans and opportunity mapping
- Aggregate from the ground up using sales volumes, pricing, and unit economics
- Use internal modeling templates aligned with stakeholder data
- Incorporate distributor-level or region-specific inputs
- Most accurate for emerging segments and granular sub-markets
DATA VALIDATION: IN-HOUSE REPOSITORY
We close the loop with proprietary data intelligence built from ongoing projects, industry monitoring, and historical benchmarking. This repository includes:
- Multi-sector market and pricing models
- Key trendlines from past interviews and forecasts
- Benchmarked adoption rates, churn patterns, and ROI indicators
- Industry-specific deviation flags and cross-check logic
- Catches inconsistencies early
- Aligns projections across studies
- Enables consistent, high-trust deliverables