
Activated Charcoal Market Size and Forecast (2026–2034), Global and Regional Growth, Trend, Share and Industry Analysis Report Coverage; By Type (Powdered Activated Carbon, Granular Activated Carbon, Extruded Activated Carbon); By Source (Coal-based, Coconut Shell-based, Wood-based, Others); By Application (Water Treatment, Air Purification, Food & Beverage Processing, Pharmaceuticals, Others); By End User (Municipal Sector, Industrial Sector, Healthcare Sector, Others), and Geography
2026-04-14
Chemicals & Materials
Jaya Bundele (Research Analyst)
Description
Activated
Charcoal Market Overview
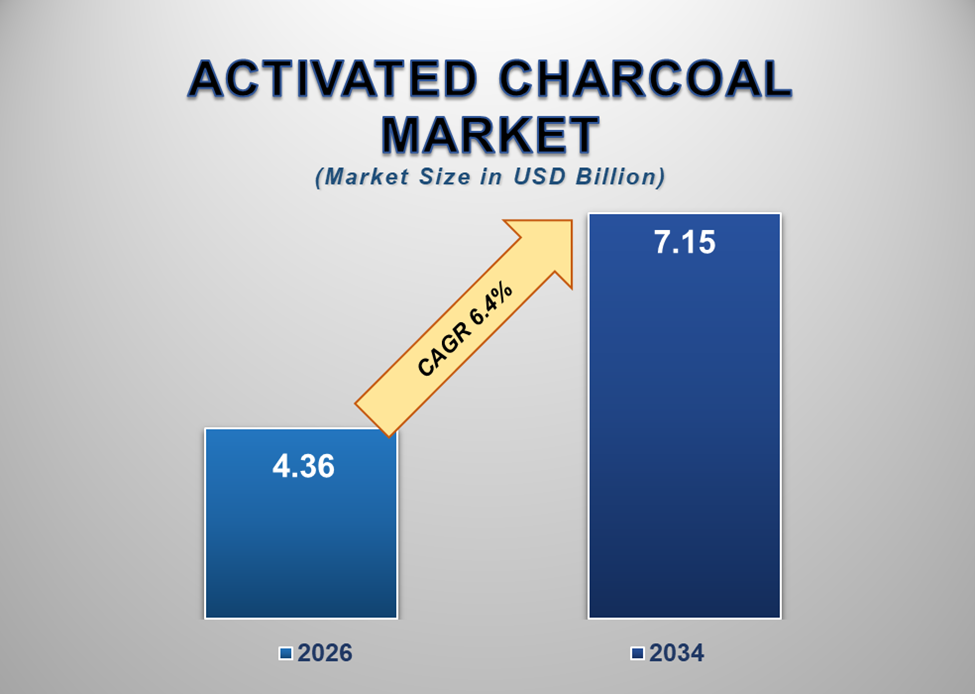
The global Activated Charcoal market
was valued at USD 4.36 billion in 2026 and is projected to reach USD
7.15 billion by 2034, expanding at a CAGR of 6.4% during the
forecast period. The market growth is primarily driven by increasing demand for
water purification solutions, rising environmental regulations, and growing use
of activated charcoal in industrial and healthcare applications. Activated
charcoal is widely recognized for its strong adsorption properties, making it
an essential material in filtration and purification processes.
Activated charcoal, also known as activated
carbon, is a highly porous form of carbon processed to have a large surface
area that allows it to adsorb impurities effectively. It is widely used in
applications such as water treatment, air purification, industrial filtration,
and medical detoxification. The material’s ability to remove contaminants,
toxins, and odors makes it highly valuable across various industries.
The increasing global focus on
environmental sustainability and pollution control is significantly
contributing to the growth of the activated charcoal market. Governments and
regulatory authorities are implementing strict standards for water and air quality,
encouraging industries to adopt efficient filtration technologies. Activated
charcoal is extensively used in municipal water treatment systems to remove
harmful chemicals and improve water quality.
Additionally, the growing industrial sector
is driving demand for activated charcoal in processes such as gas purification,
solvent recovery, and chemical processing. The expansion of industries such as
pharmaceuticals, food processing, and manufacturing is further supporting
market growth. The activated charcoal market is expected to grow steadily
through 2034, driven by rising environmental concerns and expanding industrial
activities.
Activated Charcoal Market Drivers and
Opportunities
Increasing Demand for Water Treatment
Solutions Is Driving Market Growth
The rising demand for clean and safe
drinking water is one of the primary drivers of the activated charcoal market.
Water contamination caused by industrial waste, agricultural chemicals, and
urban pollution has become a major global concern. Activated charcoal plays a
critical role in water purification by effectively removing impurities such as
chlorine, volatile organic compounds (VOCs), and heavy metals.
Municipal water treatment facilities rely
heavily on activated carbon to ensure compliance with water quality standards.
The increasing population and rapid urbanization are placing additional
pressure on water resources, further increasing the need for efficient
purification technologies.
In addition, industries such as food and beverage processing require high-quality water for production processes. Activated charcoal is widely used to purify water used in these industries, ensuring product safety and quality. As demand for clean water continues to rise globally, the adoption of activated charcoal in water treatment applications is expected to increase significantly.
Rising Environmental Regulations and Air
Pollution Control Measures Are Fueling Market Expansion
Growing environmental concerns and stricter
regulations regarding air quality are significantly contributing to the
expansion of the activated charcoal market. Industrial emissions, vehicle
exhaust, and chemical pollutants have led to increasing air pollution levels
worldwide. Activated charcoal is widely used in air purification systems to
capture harmful gases and pollutants.
Industries such as power generation,
chemical manufacturing, and waste management are required to implement emission
control systems to comply with environmental regulations. Activated carbon
filters are used to remove toxic gases such as sulfur dioxide, nitrogen oxides,
and mercury from industrial emissions.
Additionally, activated charcoal is increasingly used in indoor air purification systems, particularly in commercial buildings and residential spaces. The growing awareness of air quality and its impact on health is encouraging consumers to adopt air purification technologies. The demand for activated charcoal is expected to grow as environmental regulations become more stringent.
Expanding Applications in Healthcare and
Industrial Processes Present Significant Opportunities
The increasing use of activated charcoal in
healthcare and industrial applications is creating new opportunities for market
growth. In the healthcare sector, activated charcoal is widely used for medical
detoxification and treatment of poisoning and drug overdose cases. Its ability
to adsorb toxins makes it an effective treatment option in emergency medical
situations.
In addition, activated charcoal is used in
pharmaceutical manufacturing processes for purification and decolorization of
compounds. The expansion of the pharmaceutical industry is therefore
contributing to increased demand for activated carbon.
Industrial applications such as gold
recovery, solvent purification, and gas separation are also driving market
growth. Activated charcoal is used in these processes to improve efficiency and
reduce environmental impact. The market is expected to benefit from significant
growth opportunities as industries continue to explore new applications for
activated carbon.
Activated Charcoal Market Scope
|
Report Attributes |
Description |
|
Market Size
in 2026 |
USD 4.36 Billion |
|
Market
Forecast in 2034 |
USD 7.15 Billion |
|
CAGR %
2026-2034 |
6.4% |
|
Base Year |
2025 |
|
Historic
Data |
2021-2025 |
|
Forecast
Period |
2026-2034 |
|
Report USP |
Production, Consumption,
Company Share, Company Heatmap, Company Production, Service Type, Growth
Factors and more |
|
Segments
Covered |
∙ By Type |
|
Regional
Scope |
● North America |
|
Country
Scope |
U.S. |
Activated Charcoal Market Report
Segmentation Analysis
The global activated charcoal market
industry analysis is segmented by type, by source, by application, by end user,
and by region.
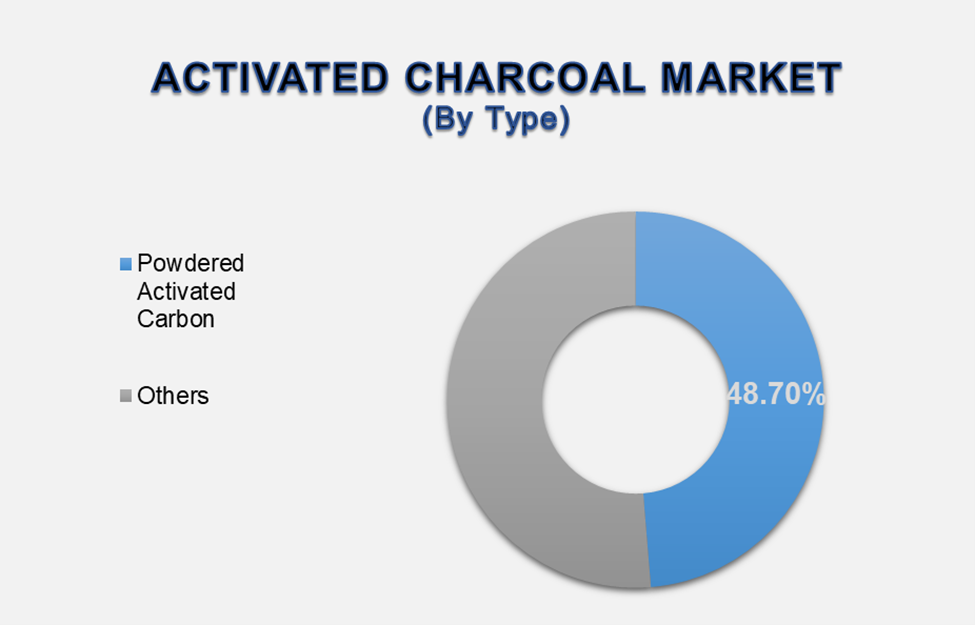
Powdered Activated Carbon Segment Is
Expected to Dominate the Market During the Forecast Period
The powdered activated carbon segment
accounted for approximately 48.7% of the global market, making it the
dominant category. This segment is widely used in water treatment and
industrial applications due to its high adsorption capacity and rapid action.
Powdered activated carbon is particularly effective in removing contaminants from water and is commonly used in municipal water treatment facilities. Its fine particle size allows for greater surface area, enhancing adsorption efficiency. Additionally, it is widely used in industrial processes where quick and effective purification is required.
Coconut Shell-Based Segment Is Expected to
Lead the Market by Source
Coconut shell-based activated charcoal is gaining prominence due to its high purity, sustainability, and superior adsorption properties. It is widely used in water purification and air filtration applications.
Water Treatment Segment Is Expected to
Dominate the Application Market
Water treatment represents the largest application segment due to the widespread use of activated charcoal in removing impurities and ensuring safe drinking water. Increasing demand for clean water is driving the growth of this segment.
Municipal Sector Segment Is Expected to
Dominate the End-User Market
The municipal sector holds the largest
share due to extensive use of activated charcoal in public water treatment
systems and environmental management initiatives.
The following segments are part of an
in-depth analysis of the global Activated Charcoal market:
|
Market Segments |
|
|
By
Source |
∙
Coal-based |
|
By Type |
∙
Powdered Activated Carbon |
|
By Application |
∙
Water Treatment |
|
By
End User |
∙
Municipal Sector |
Activated Charcoal Market Share Analysis
By Region
Asia Pacific is projected to hold the
largest share of the global activated charcoal market over the forecast period.
Asia Pacific accounted for approximately 46.8%
of the global market in 2026, driven by rapid industrialization, increasing
demand for water purification, and strong manufacturing activity in countries
such as China and India.
North America and Europe also represent significant markets due to strict environmental regulations and high adoption of filtration technologies.
Activated Charcoal Market Competition
Landscape Analysis
The activated charcoal market is highly competitive, with companies focusing on expanding production capacity, improving product quality, and developing sustainable solutions.
Global Activated Charcoal Market Recent
Developments News:
∙ In March 2026 – New sustainable activated
carbon products were introduced using renewable raw materials.
∙ In October 2025 – Investments in water treatment technologies increased
globally.
∙ In July 2025 – Industrial applications of activated charcoal expanded in
emerging markets.
The Global Activated Charcoal Market is
dominated by a few large companies, such as
∙ Calgon Carbon Corporation
∙ Cabot Corporation
∙ Kuraray Co., Ltd.
∙ Osaka Gas Chemicals
∙ Haycarb PLC
∙ Jacobi Carbons Group
∙ Donau Carbon GmbH
∙ Ingevity Corporation
∙ Evoqua Water Technologies
∙ Silcarbon Aktivkohle GmbH
∙ Others
Frequently Asked Questions
Jaya Bundele (Research Analyst)
Jaya Bundele is a skilled Research Analyst with 4+ years of experience in market intelligence, consumer insights, competitive analysis, and industry forecasting across the consumer goods, agriculture, and food & beverage sectors. She specializes in market sizing, trend analysis, growth opportunity mapping, and strategic secondary research for global and regional markets.
Her expertise lies in transforming complex industry data into actionable business strategies that help organizations identify emerging trends, understand customer behavior, and gain a competitive edge. With a strong focus on data-driven insights, business intelligence, and future market trends, Jaya delivers high-quality research solutions aligned with evolving industry demands and market dynamics.
1.
Global Activated
Charcoal Market Introduction and Market Overview
1.1. Objectives of the Study
1.2. Global Activated Charcoal Market Scope and Market Estimation
1.2.1.
Global Activated Charcoal
Overall Market Size (US$ Million), Market CAGR (%), Market Forecast (2026 - 2034)
1.2.2.
Global Activated Charcoal
Market Revenue Share (%) and Growth Rate (Y-o-Y) from 2021 - 2034
1.3. Market Segmentation
1.3.1.
Type of Global Activated
Charcoal Market
1.3.2.
Source of Global Activated
Charcoal Market
1.3.3.
Application of the Global
Activated Charcoal Market
1.3.4.
End User of Global Activated
Charcoal Market
1.3.5.
Region of Global Activated
Charcoal Market
2.
Executive Summary
2.1. Demand Side Trends
2.2. Key Market Trends
2.3. Market Demand (US$ Million) Analysis 2021 – 2025 and Forecast, 2026
– 2034
2.4. Demand and Opportunity Assessment
2.5. Key Developments
2.6. Overview of Tariff, Regulatory Landscape and Standards
2.7. Market Entry Strategies
2.8. Market Dynamics
2.8.1.
Drivers
2.8.2.
Limitations
2.8.3.
Opportunities
2.8.4.
Impact Analysis of Drivers and
Restraints
2.9. Porter’s Five Forces Analysis
2.10.
PEST Analysis
3.
Global Activated Charcoal
Market Estimates & Historical Trend Analysis (2021 - 2025)
4.
Global Activated
Charcoal Market Estimates & Forecast Trend Analysis, by Type
4.1. Global Activated Charcoal Market Revenue (US$ Million) Estimates and
Forecasts, by Type, 2021 - 2034
4.1.1.
Powdered Activated Carbon
4.1.2.
Granular Activated Carbon
4.1.3.
Extruded Activated Carbon
5.
Global Activated
Charcoal Market Estimates & Forecast Trend Analysis, by Source
5.1. Global Activated Charcoal Market Revenue (US$ Million) Estimates and
Forecasts, by Source, 2021 - 2034
5.1.1.
Coal-based
5.1.2.
Coconut Shell-based
5.1.3.
Wood-based
5.1.4.
Others
6.
Global Activated
Charcoal Market Estimates & Forecast Trend Analysis, by Application
6.1. Global Activated Charcoal Market Revenue (US$ Million) Estimates and
Forecasts, by Application, 2021 - 2034
6.1.1.
Water Treatment
6.1.2.
Air Purification
6.1.3.
Food & Beverage Processing
6.1.4.
Pharmaceuticals
6.1.5.
Others
7.
Global Activated
Charcoal Market Estimates & Forecast Trend Analysis, by End User
7.1. Global Activated Charcoal Market Revenue (US$ Million) Estimates and
Forecasts, by End User, 2021 - 2034
7.1.1.
Municipal Sector
7.1.2.
Industrial Sector
7.1.3.
Healthcare Sector
7.1.4.
Others
8.
Global Activated
Charcoal Market Estimates & Forecast Trend Analysis, by Region
8.1. Global Activated Charcoal Market Revenue (US$ Million) Estimates and
Forecasts, by Region, 2021 - 2034
8.1.1.
North America
8.1.2.
Europe
8.1.3.
Asia Pacific
8.1.4.
Middle East & Africa
8.1.5.
Latin America
9.
North America Activated
Charcoal Market: Estimates & Forecast Trend Analysis
9.1. North America Activated Charcoal Market Assessments & Key
Findings
9.1.1.
North America Activated
Charcoal Market Introduction
9.1.2.
North America Activated
Charcoal Market Size Estimates and Forecast (US$ Million) (2021 - 2034)
9.1.2.1.
By Type
9.1.2.2.
By Source
9.1.2.3.
By Application
9.1.2.4.
By End User
9.1.2.5.
By Country
9.1.2.5.1.
The U.S.
9.1.2.5.2.
Canada
10. Europe Activated Charcoal Market: Estimates & Forecast Trend
Analysis
10.1.
Europe Activated Charcoal
Market Assessments & Key Findings
10.1.1.
Europe Activated Charcoal
Market Introduction
10.1.2.
Europe Activated Charcoal
Market Size Estimates and Forecast (US$ Million) (2021 - 2034)
10.1.2.1.
By Type
10.1.2.2.
By Source
10.1.2.3.
By Application
10.1.2.4.
By End User
10.1.2.5.
By Country
10.1.2.5.1.
Germany
10.1.2.5.2.
Italy
10.1.2.5.3.
U.K.
10.1.2.5.4.
France
10.1.2.5.5.
Spain
10.1.2.5.6.
Switzerland
10.1.2.5.7.
Rest of Europe
11. Asia Pacific Activated Charcoal Market: Estimates & Forecast
Trend Analysis
11.1.
Asia Pacific Market Assessments
& Key Findings
11.1.1.
Asia Pacific Activated Charcoal
Market Introduction
11.1.2.
Asia Pacific Activated Charcoal
Market Size Estimates and Forecast (US$ Million) (2021 - 2034)
11.1.2.1.
By Type
11.1.2.2.
By Source
11.1.2.3.
By Application
11.1.2.4.
By End User
11.1.2.5.
By Country
11.1.2.5.1.
China
11.1.2.5.2.
Japan
11.1.2.5.3.
India
11.1.2.5.4.
Australia
11.1.2.5.5.
South Korea
11.1.2.5.6.
Rest of Asia Pacific
12. Middle East & Africa Activated Charcoal Market: Estimates &
Forecast Trend Analysis
12.1.
Middle East & Africa Market
Assessments & Key Findings
12.1.1.
Middle East & Africa
Activated Charcoal Market Introduction
12.1.2.
Middle East & Africa
Activated Charcoal Market Size Estimates and Forecast (US$ Million) (2021 -
2034)
12.1.2.1.
By Type
12.1.2.2.
By Source
12.1.2.3.
By Application
12.1.2.4.
By End User
12.1.2.5.
By Country
12.1.2.5.1.
UAE
12.1.2.5.2.
Saudi Arabia
12.1.2.5.3.
South Africa
12.1.2.5.4.
Rest of MEA
13. Latin America Activated Charcoal Market: Estimates & Forecast
Trend Analysis
13.1.
Latin America Market
Assessments & Key Findings
13.1.1.
Latin America Activated
Charcoal Market Introduction
13.1.2.
Latin America Activated
Charcoal Market Size Estimates and Forecast (US$ Million) (2021 - 2034)
13.1.2.1.
By Type
13.1.2.2.
By Source
13.1.2.3.
By Application
13.1.2.4.
By End User
13.1.2.5.
By Country
13.1.2.5.1.
Brazil
13.1.2.5.2.
Mexico
13.1.2.5.3.
Argentina
13.1.2.5.4.
Rest of LATAM
14. Competition Landscape
14.1.
Global Activated Charcoal
Market Product Mapping
14.2.
Global Activated Charcoal
Market Concentration Analysis, by Leading Players / Innovators / Emerging
Players / New Entrants
14.3.
Global Activated Charcoal
Market Tier Structure Analysis
14.4.
Global Activated Charcoal
Market Concentration & Company Market Shares (%) Analysis, 2025
15. Company Profiles
15.1.
Calgon Carbon Corporation
15.1.1.
Company Overview & Key
Stats
15.1.2.
Financial Performance &
KPIs
15.1.3.
Product Portfolio
15.1.4.
SWOT Analysis
15.1.5.
Business Strategy & Recent
Developments
*Similar details would be provided for all
the players mentioned below
15.2.
Cabot Corporation
15.3.
Kuraray Co., Ltd.
15.4.
Osaka Gas Chemicals
15.5.
Haycarb PLC
15.6.
Jacobi Carbons Group
15.7.
Donau Carbon GmbH
15.8.
Ingevity Corporation
15.9.
Evoqua Water Technologies
15.10.
Silcarbon Aktivkohle GmbH
15.11.
Others
16. Research Findings & Conclusion
17. Assumption & Acronyms Used
18. Research Methodology
18.1.
External Transportations /
Databases
18.2.
Internal Proprietary Database
18.3.
Primary Research
18.4.
Secondary Research
18.5.
Assumptions
18.6.
Limitations
18.7.
Report FAQs
Our Research Methodology
"Insight without rigor is just noise."
We follow a comprehensive, multi-phase research framework designed to deliver accurate, strategic, and decision-ready intelligence. Our process integrates primary and secondary research , both quantitative and qualitative , along with dual modeling techniques ( top-down and bottom-up) and a final layer of validation through our proprietary in-house repository.
PRIMARY RESEARCH
Primary research captures real-time, firsthand insights from the market to understand behaviors, motivations, and emerging trends.
1. Quantitative Primary Research
Objective: Generate statistically significant data directly from market participants.
Approaches:- Structured surveys with customers, distributors, and field agents
- Mobile-based data collection for point-of-sale audits and usage behavior
- Phone-based interviews (CATI) for market sizing and product feedback
- Online polling around industry events and digital campaigns
- Purchase frequency by customer type
- Channel performance across geographies
- Feature demand by application or demographic
2. Qualitative Primary Research
Objective: Explore decision-making drivers, pain points, and market readiness.
Approaches:- In-depth interviews (IDIs) with executives, product managers, and key decision-makers
- Focus groups among end users and early adopters
- Site visits and observational research for consumer products
- Informal field-level discussions for regional and cultural nuances
SECONDARY RESEARCH
This phase helps establish a macro-to-micro understanding of market trends, size, regulation, and competitive dynamics, sourced from credible and public domain information.
1. Quantitative Secondary Research
Objective: Model market value and segment-level forecasts based on published data.
Sources include:- Financial reports and investor summaries
- Government trade data, customs records, and regulatory statistics
- Industry association publications and economic databases
- Channel performance and pricing data from marketplace listings
- Revenue splits, pricing trends, and CAGR estimates
- Supply-side capacity and volume tracking
- Investment analysis and funding benchmarks
2. Qualitative Secondary Research
Objective: Capture strategic direction, innovation signals, and behavioral trends.
Sources include:- Company announcements, roadmaps, and product pipelines
- Publicly available whitepapers, conference abstracts, and academic research
- Regulatory body publications and policy briefs
- Social and media sentiment scanning for early-stage shifts
- Strategic shifts in market positioning
- Unmet needs and white spaces
- Regulatory triggers and compliance impact

DUAL MODELING: TOP-DOWN + BOTTOM-UP
To ensure robust market estimation, we apply two complementary sizing approaches:
Top-Down Modeling:- Start with broader industry value (e.g., global or regional TAM)
- Apply filters by segment, geography, end-user, or use case
- Adjust with primary insights and validation benchmarks
- Ideal for investor-grade market scans and opportunity mapping
- Aggregate from the ground up using sales volumes, pricing, and unit economics
- Use internal modeling templates aligned with stakeholder data
- Incorporate distributor-level or region-specific inputs
- Most accurate for emerging segments and granular sub-markets
DATA VALIDATION: IN-HOUSE REPOSITORY
We close the loop with proprietary data intelligence built from ongoing projects, industry monitoring, and historical benchmarking. This repository includes:
- Multi-sector market and pricing models
- Key trendlines from past interviews and forecasts
- Benchmarked adoption rates, churn patterns, and ROI indicators
- Industry-specific deviation flags and cross-check logic
- Catches inconsistencies early
- Aligns projections across studies
- Enables consistent, high-trust deliverables