
Artificial Jewelry Market Size and Forecast (2020 - 2033), Global and Regional Growth, Trend, Share, and Industry Analysis Report Coverage: By Product Type (Necklaces, Earrings, Rings, Bracelets & Bangles, Others), By Material (Gold-Plated, Silver-Plated, Brass, Stainless Steel, Beaded, Others), By Distribution Channel (Offline [Hypermarkets/Supermarkets, Specialty Stores, Branded Outlets], Online) And Geography
2025-12-05
Consumer Products
Jaya Bundele (Research Analyst)
Description
Artificial Jewelry Market Overview
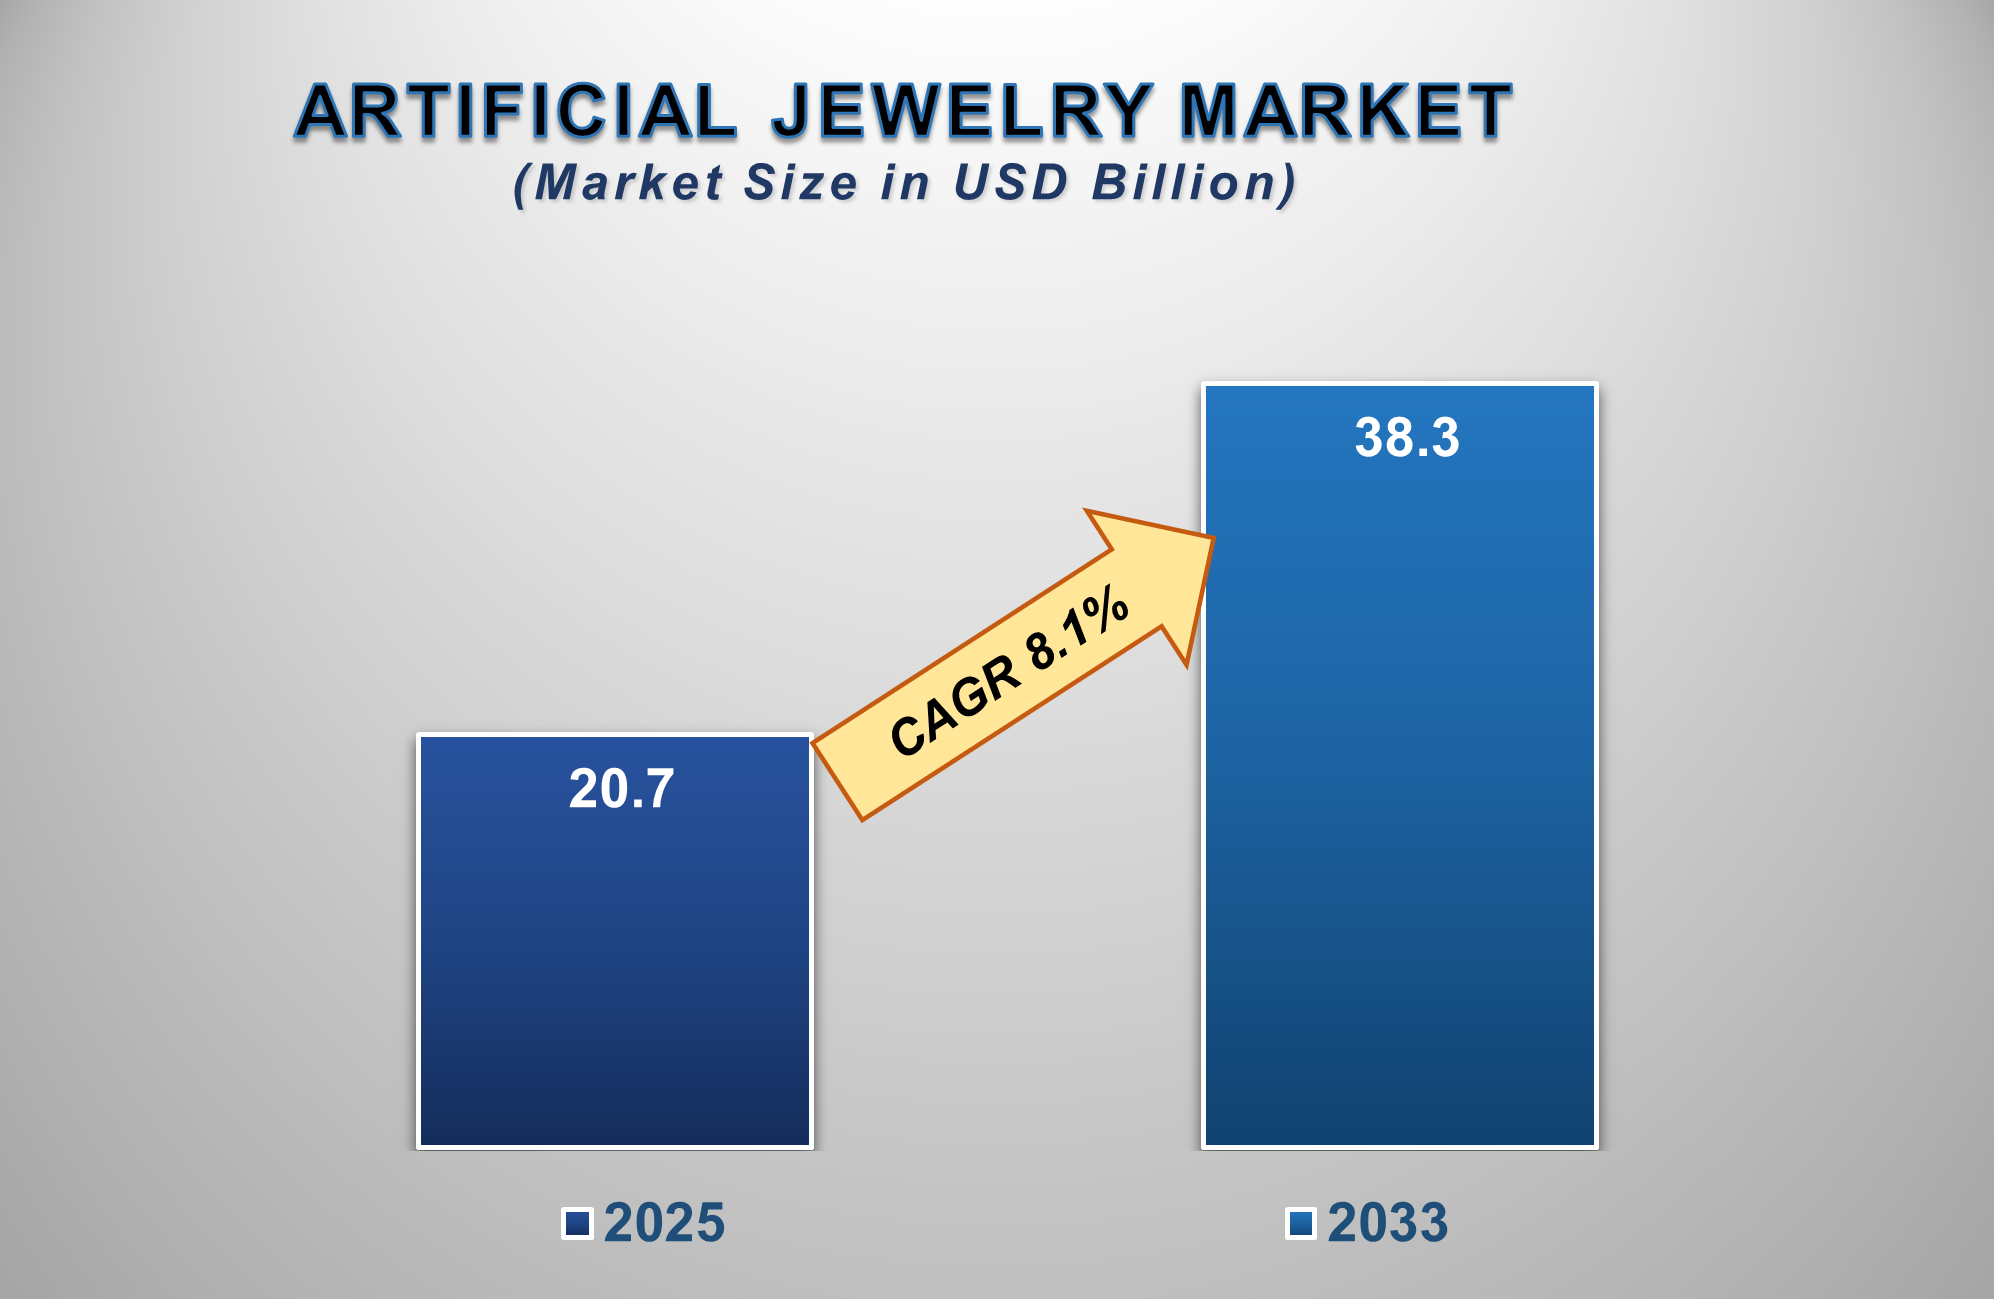
The Artificial Jewelry Market is poised for a period of robust and dynamic growth from 2025 to 2033, driven by rapidly changing fashion trends, rising disposable incomes in emerging economies, and the growing acceptance of fashion jewelry as a daily wear accessory. The market is projected to be valued at approximately USD 20.7 billion in 2025 and is forecasted to reach nearly USD 38.3 billion by 2033, exhibiting a compound annual growth rate (CAGR) of 8.1% during this period.
Artificial jewelry, also known as fashion or
imitation jewelry, encompasses a wide range of non-precious accessory items designed for aesthetic appeal and affordability. The
market's expansion is underpinned by the influence of social media and fashion
influencers, which accelerates the adoption of new styles and encourages
frequent purchases. Furthermore, the increasing working-women population,
coupled with their desire for accessorizing different outfits for various
occasions, is a significant growth factor. Technological advancements in
manufacturing, such as electroplating and the use of high-quality alloys and
synthetic stones that closely mimic real jewelry, are also enhancing product
appeal and durability. North America and Europe currently hold significant
market shares due to high fashion consciousness, while the Asia-Pacific region
is anticipated to be the fastest-growing market, fueled by its large youth population, urbanization, and growing
middle class.
Artificial Jewelry Market Drivers and Opportunities
Rapid Fashion,
Cyclability, and Affordability are the Primary
Market Drivers
The fast-paced nature of the fashion industry is
the most significant driver of the artificial jewelry market. Unlike fine
jewelry, which is often considered a long-term investment, artificial jewelry
is purchased to complement transient fashion trends. The low cost per piece
allows consumers to experiment with styles, build extensive collections, and
frequently update their accessories without a significant financial burden. The
rise of "fast fashion" retailers, who quickly replicate runway trends
at affordable prices, creates a direct and continuous demand for complementary
fashion jewelry. This cyclical nature of fashion, combined with the economic
accessibility of these products, ensures a consistent and high-volume demand,
driving market growth.
Rising Disposable Income and Growing
Working-Women Population are Driving Widespread Adoption
The increasing disposable income, particularly
in developing nations across Asia-Pacific and Latin America, is a major
catalyst for market expansion. As consumers have more spending power, a larger
portion is allocated to non-essential and lifestyle products, including fashion
accessories. Concurrently, the global rise in the number of working women has
created a substantial consumer base that seeks stylish, professional, and
versatile jewelry for daily wear and corporate settings. These demographic groups'
view of artificial
jewelry is not just as an adornment but as an
integral component of their personal and professional identity, fueling repeated purchases and driving the market's growth
trajectory.
Product Innovation and the E-commerce Boom
Present Significant Opportunities
The development of innovative designs and the
explosive growth of online retail are creating significant growth frontiers for
the artificial jewelry market. Key opportunities lie in the use of new
materials like titanium plating, tungsten carbide, and high-quality resin,
which offer superior scratch resistance and longevity. The trend towards
personalized and customized jewelry, enabled by advanced manufacturing
techniques like 3D printing, represents a major opportunity. Furthermore, the
dominance of e-commerce platforms is revolutionizing the market. Online
channels offer a vast selection, competitive pricing, and the convenience of
home shopping, which is particularly appealing to the younger demographic. For
manufacturers, investing in an omnichannel presence, leveraging social media
marketing, and creating engaging online content are key strategies to capture
this rapidly expanding digital segment.
Artificial Jewelry Market
Scope
|
Report Attributes |
Description |
|
Market Size in 2025 |
USD 20.7 Billion |
|
Market Forecast in 2033 |
USD 38.3 Billion |
|
CAGR % 2025-2033 |
8.1% |
|
Base Year |
2024 |
|
Historic Data |
2020-2024 |
|
Forecast Period |
2025-2033 |
|
Report USP |
Product Portfolio,
Technological Analysis, Company Market Share, Company Heatmap, Pricing
Analysis, Growth Factors and more |
|
Segments Covered |
●
By Product Type ●
By Material ●
By Distribution
Channel |
|
Regional Scope |
●
North America, ●
Europe, ●
APAC, ●
Latin America ●
Middle East and
Africa |
|
Country Scope |
1)
U.S. 2)
Canada 3)
Germany 4)
UK 5)
France 6)
Spain 7)
Italy 8)
Switzerland 9)
China 10)
Japan 11)
India 12)
Australia 13)
South Korea 14)
Brazil 15)
Mexico 16)
Argentina 17)
South Africa 18)
Saudi Arabia 19)
UAE |
Artificial Jewelry Market
Report Segmentation Analysis
The global Artificial Jewelry
Market industry analysis is segmented by Product Type, by Material, by
Distribution Channel, and by Region.
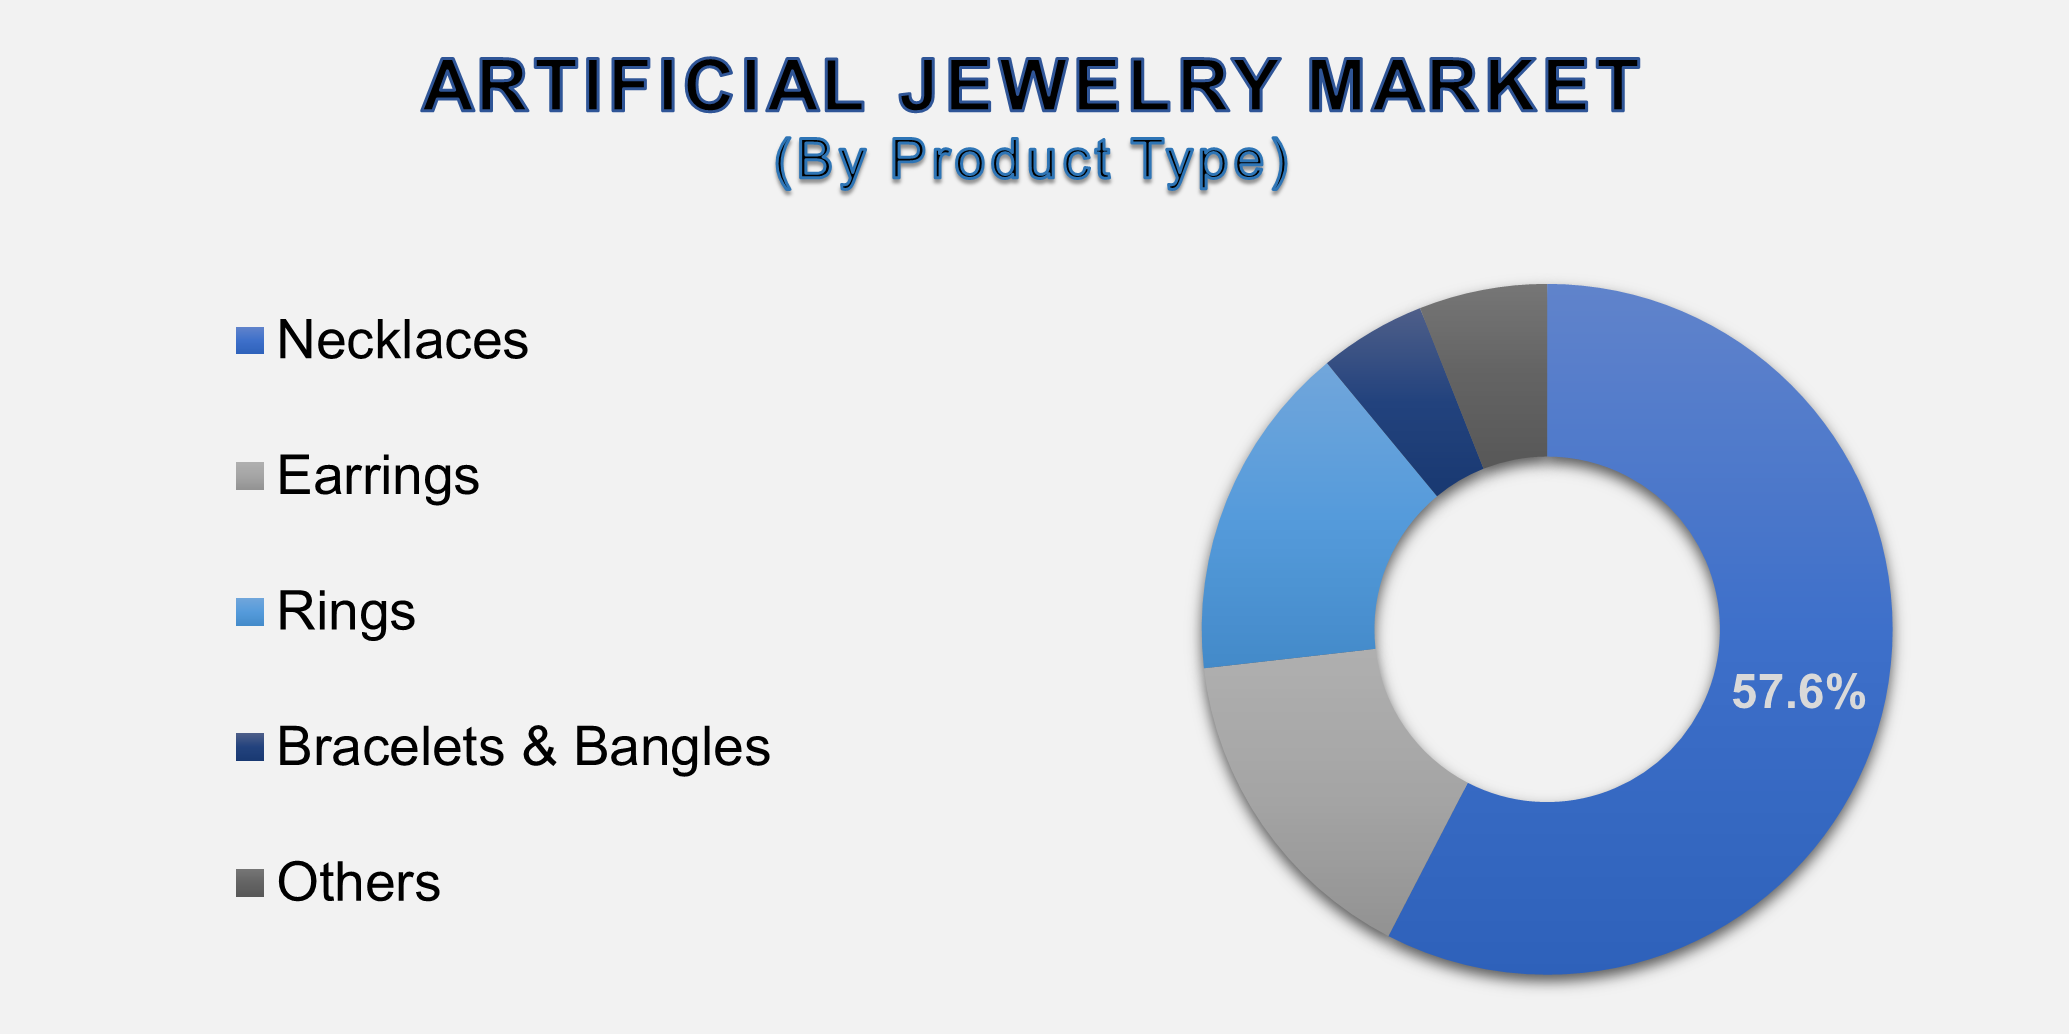
The Necklaces segment is
anticipated to command a significant market share in 2025.
The Product Type segment is categorized into
Necklaces, Earrings, Rings, Bracelets & Bangles, and Others. Necklaces
often serve as a statement piece in an ensemble, making them a highly
sought-after category. The versatility of necklaces, ranging from delicate
chains to bold, chunky designs, allows them to cater to a wide array of fashion
sensibilities and occasions. The constant innovation in pendants, chains, and
materials keeps this segment fresh and appealing. Its prominence on the upper
body, making it a focal point of any outfit, ensures that the necklace
segment captures a substantial portion of consumer spending and holds a leading
position in the market.
The Gold-Plated material segment is projected to
hold the largest market share.
The Material segment is divided into Gold-Plated,
Silver-Plated, Brass, Stainless Steel, Beaded, and Others. The dominance of
gold-plated jewelry is driven by its perennial appeal and its ability to offer
the luxurious look of real gold at a fraction of the cost. Gold is a timeless
metal associated with prestige and elegance across numerous cultures. Modern
electroplating techniques have improved the durability and tarnish resistance of gold-plated items, enhancing their value proposition.
As consumers seek affordable luxury and versatile pieces that can be worn daily
or on special occasions, gold-plated jewelry remains the most popular and
dominant material choice globally.
The Offline distribution channel segment is
projected to maintain its dominance, though Online is growing rapidly.
The Distribution Channel is split into Offline
(Hypermarkets/Supermarkets, Specialty Stores, Branded Outlets) and Online. The
Offline segment's leading position is attributed to the tactile nature of the
jewelry shopping experience. Consumers often prefer to see, touch, and try on
jewelry to assess its quality, finish, and how it looks on them before
purchasing. Specialty stores and branded outlets offer a curated experience,
expert advice, and immediate gratification. While the online
channel is experiencing explosive growth, the established network of physical
retail stores, malls, and kiosks continues to be the primary point of sale,
leveraging the sensory and instant aspects of the purchase decision.
The following segments are part of an in-depth analysis of
the global Artificial Jewelry Market:
|
Market
Segments |
|
|
By Product
Type |
●
Necklaces ●
Earrings ●
Rings ●
Bracelets &
Bangles ●
Others |
|
By Material |
●
Gold-Plated ●
Silver-Plated ●
Brass ●
Stainless Steel ●
Beaded ●
Others |
|
By Distribution Channel |
●
Offline Channel ●
Online Channel |
Artificial Jewelry Market
Share Analysis by Region
The Asia Pacific region is anticipated to hold
the largest portion of the Artificial Jewelry Market globally
throughout the forecast period.
Asia-Pacific's dominance is fuelled by its
massive population, deep-rooted cultural affinity for jewelry, and rapidly
growing economies. Countries like India and China have a long tradition of
adornment, and with rising disposable incomes, consumers are increasingly
purchasing jewelry for fashion rather than just for investment. The region is
also a global manufacturing hub, ensuring a steady and cost-effective supply.
The burgeoning e-commerce sector, combined with a young, fashion-conscious
demographic, makes Asia-Pacific the epicenter of current and future growth for
the artificial jewelry market.
The region benefits from a strong presence of
local artisans as well as large-scale manufacturers, creating a diverse product
range that caters to both traditional and contemporary tastes. Festivals,
weddings, and other cultural celebrations drive significant seasonal demand
spikes. Furthermore, the penetration of smartphones and internet connectivity
is bringing a vast rural consumer base into the market through online channels,
further accelerating regional market dominance.
Artificial Jewelry Market
Competition Landscape Analysis
The global artificial jewelry
market is highly fragmented and competitive, featuring a mix of international
brands, regional players, and numerous local artisans. Competition is intense
and based on design innovation, price, brand image, and distribution network
reach. Key strategies include frequent new collection launches to align with
fashion trends, celebrity endorsements and collaborations, investment in
marketing through social media influencers, and expansion of retail presence
both online and offline. The ability to quickly replicate high-end designer
trends at mass-market prices is a critical success factor in this dynamic
market.
Global Artificial Jewelry
Market Recent Developments News:
- In January
2025, Pandora announced a new collection of lab-created gemstone
fashion jewelry, aiming to capture the market for affordable, sustainable,
and sparkly accessories.
- In November 2024, a
major fast-fashion retailer, H&M, launched a collaboration with a
celebrity stylist for a limited-edition artificial jewelry line, which
sold out online within hours.
- In September
2024, Mia by Tanishq, a brand from the Tata Group, expanded its
retail footprint in India, focusing on trendy and affordable artificial
jewelry for young women.
- In July 2024, Amazon
India reported a significant surge in sales of artificial jewelry during
its Prime Day sale, highlighting the growing dominance of the online
channel in key markets.
The Global Artificial
Jewelry Market Is Dominated by a Few Large Companies, such as
●
Pandora A/S
●
Swarovski AG
●
H&M Group (Hennes & Mauritz AB)
●
Zara (Inditex)
●
Accessorize (Monsoon
Accessorize Ltd.)
●
Mia by Tanishq (Titan
Company Limited)
●
Stylophile
●
BaubleBar Inc.
●
Lovisa Holdings Ltd.
●
The Colibri Company
● Other Prominent Players
Frequently Asked Questions
Jaya Bundele (Research Analyst)
Jaya Bundele is a skilled Research Analyst with 4+ years of experience in market intelligence, consumer insights, competitive analysis, and industry forecasting across the consumer goods, agriculture, and food & beverage sectors. She specializes in market sizing, trend analysis, growth opportunity mapping, and strategic secondary research for global and regional markets.
Her expertise lies in transforming complex industry data into actionable business strategies that help organizations identify emerging trends, understand customer behavior, and gain a competitive edge. With a strong focus on data-driven insights, business intelligence, and future market trends, Jaya delivers high-quality research solutions aligned with evolving industry demands and market dynamics.
1. Global Artificial Jewelry
Market Introduction and Market Overview
1.1.
Objectives
of the Study
1.2.
Global
Artificial Jewelry Market Scope and Market Estimation
1.2.1.Global Electronic Toll
Collection Overall Market Size (US$ Bn), Market CAGR (%), Market forecast (2025
- 2033)
1.2.2.Global Artificial Jewelry
Market Revenue Share (%) and Growth Rate (Y-o-Y) from 2020 - 2033
1.3.
Market
Segmentation
1.3.1.Product Type of Global Artificial
Jewelry Market
1.3.2.Material Type of Global Artificial
Jewelry Market
1.3.3.Distribution Channel of Global
Artificial Jewelry Market
1.3.4.Region of Global Artificial
Jewelry Market
2.
Executive Summary
2.1.
Demand
Side Trends
2.2.
Key
Market Trends
2.3.
Market
Demand (US$ Bn) Analysis 2020 – 2024 and forecast, 2025 – 2033
2.4.
Demand
and Opportunity Assessment
2.5.
Technological
Advancements
2.6.
Key
Developments
2.7.
Market
Entry Strategies
2.8.
Market
Dynamics
2.8.1.Drivers
2.8.2.Limitations
2.8.3.Opportunities
2.8.4.Impact Analysis of Drivers
and Restraints
2.9.
Porter’s
Five Forces Analysis
2.10.
PEST
Analysis
3. Global
Artificial Jewelry Market Estimates
& Historical Trend Analysis (2020 - 2024)
4. Global
Artificial Jewelry Market Estimates
& Forecast Trend Analysis, by Product Type
4.1.
Global
Artificial Jewelry Market Revenue (US$ Bn) Estimates and Forecasts, by Product
Type, 2020 - 2033
4.1.1.Necklaces
4.1.2.Earrings
4.1.3.Rings
4.1.4.Bracelets & Bangles
4.1.5.Others
5. Global
Artificial Jewelry Market Estimates
& Forecast Trend Analysis, by Material Type
5.1.
Global
Artificial Jewelry Market Revenue (US$ Bn) Estimates and Forecasts, by Material
Type, 2020 - 2033
5.1.1.Gold-Plated
5.1.2.Silver-Plated
5.1.3.Brass
5.1.4.Stainless Steel
5.1.5.Beaded
5.1.6.Others
6. Global
Artificial Jewelry Market Estimates
& Forecast Trend Analysis, by Distribution Channel
6.1.
Global
Artificial Jewelry Market Revenue (US$ Bn) Estimates and Forecasts, by Distribution
Channel 2020 - 2033
6.1.1.Offline Channel
6.1.2.Online Channel
7. Global
Artificial Jewelry Market Estimates
& Forecast Trend Analysis, by region
7.1.
Global
Artificial Jewelry Market Revenue (US$ Bn) Estimates and Forecasts, by region, 2020
- 2033
7.1.1.North America
7.1.2.Europe
7.1.3.Asia Pacific
7.1.4.Middle East & Africa
7.1.5.Latin America
8. North America Artificial
Jewelry Market: Estimates &
Forecast Trend Analysis
8.1. North America Artificial Jewelry
Market Assessments & Key Findings
8.1.1.North America Artificial Jewelry
Market Introduction
8.1.2.North America Artificial Jewelry
Market Size Estimates and Forecast (US$ Billion) (2020 - 2033)
8.1.2.1.
By Product Type
8.1.2.2.
By Material Type
8.1.2.3.
By Distribution Channel
8.1.2.4. By Country
8.1.2.4.1. The U.S.
8.1.2.4.2. Canada
9. Europe Artificial
Jewelry Market: Estimates &
Forecast Trend Analysis
9.1. Europe Artificial Jewelry
Market Assessments & Key Findings
9.1.1.Europe Artificial Jewelry
Market Introduction
9.1.2.Europe Artificial Jewelry
Market Size Estimates and Forecast (US$ Billion) (2020 - 2033)
9.1.2.1.
By Product Type
9.1.2.2.
By Material Type
9.1.2.3.
By Distribution Channel
9.1.2.4. By Country
9.1.2.4.1.
Germany
9.1.2.4.2.
Italy
9.1.2.4.3.
U.K.
9.1.2.4.4.
France
9.1.2.4.5.
Spain
9.1.2.4.6.
Switzerland
9.1.2.4.7. Rest
of Europe
10. Asia Pacific Artificial
Jewelry Market: Estimates &
Forecast Trend Analysis
10.1. Asia Pacific Market
Assessments & Key Findings
10.1.1.
Asia
Pacific Artificial Jewelry Market Introduction
10.1.2.
Asia
Pacific Artificial Jewelry Market Size Estimates and Forecast (US$ Billion) (2020
- 2033)
10.1.2.1.
By Product Type
10.1.2.2.
By Material Type
10.1.2.3.
By Distribution Channel
10.1.2.4. By Country
10.1.2.4.1. China
10.1.2.4.2. Japan
10.1.2.4.3. India
10.1.2.4.4. Australia
10.1.2.4.5. South Korea
10.1.2.4.6. Rest of Asia Pacific
11. Middle East & Africa Artificial
Jewelry Market: Estimates &
Forecast Trend Analysis
11.1. Middle East & Africa
Market Assessments & Key Findings
11.1.1. Middle
East & Africa
Artificial Jewelry Market Introduction
11.1.2. Middle
East & Africa
Artificial Jewelry Market Size Estimates and Forecast (US$ Billion) (2020 - 2033)
11.1.2.1.
By Product Type
11.1.2.2.
By Material Type
11.1.2.3.
By Distribution Channel
11.1.2.4. By Country
11.1.2.4.1. UAE
11.1.2.4.2. Saudi
Arabia
11.1.2.4.3. South
Africa
11.1.2.4.4. Rest
of MEA
12. Latin America
Artificial Jewelry Market: Estimates
& Forecast Trend Analysis
12.1. Latin America Market
Assessments & Key Findings
12.1.1. Latin America Artificial Jewelry
Market Introduction
12.1.2. Latin America Artificial Jewelry
Market Size Estimates and Forecast (US$ Billion) (2020 - 2033)
12.1.2.1.
By Product Type
12.1.2.2.
By Material Type
12.1.2.3.
By Distribution Channel
12.1.2.4. By Country
12.1.2.4.1. Brazil
12.1.2.4.2. Argentina
12.1.2.4.3. Mexico
12.1.2.4.4. Rest
of LATAM
13.
Country
Wise Market: Introduction
14.
Competition
Landscape
14.1. Global Artificial Jewelry
Market Product Mapping
14.2. Global Artificial Jewelry
Market Concentration Analysis, by Leading Players / Innovators / Emerging
Players / New Entrants
14.3. Global Artificial Jewelry
Market Tier Structure Analysis
14.4. Global Artificial Jewelry
Market Concentration & Company Market Shares (%) Analysis, 2024
15.
Company
Profiles
15.1.
Pandora A/S
15.1.1.
Company
Overview & Key Stats
15.1.2.
Financial
Performance & KPIs
15.1.3.
Product
Portfolio
15.1.4.
SWOT
Analysis
15.1.5.
Business
Strategy & Recent Developments
* Similar details would be provided for all the players
mentioned below
15.2.
Swarovski AG
15.3.
H&M Group (Hennes & Mauritz AB)
15.4.
Zara (Inditex)
15.5.
Accessorize (Monsoon Accessorize Ltd.)
15.6.
Mia by Tanishq (Titan Company Limited)
15.7.
Stylophile
15.8.
BaubleBar Inc.
15.9.
Lovisa Holdings Ltd.
15.10.
The Colibri Company
15.11.
Other Prominent Players
16. Research
Methodology
16.1. External Transportations /
Databases
16.2. Internal Proprietary
Database
16.3. Primary Research
16.4. Secondary Research
16.5. Assumptions
16.6. Limitations
16.7. Report FAQs
17. Research
Findings & Conclusion
Our Research Methodology
"Insight without rigor is just noise."
We follow a comprehensive, multi-phase research framework designed to deliver accurate, strategic, and decision-ready intelligence. Our process integrates primary and secondary research , both quantitative and qualitative , along with dual modeling techniques ( top-down and bottom-up) and a final layer of validation through our proprietary in-house repository.
PRIMARY RESEARCH
Primary research captures real-time, firsthand insights from the market to understand behaviors, motivations, and emerging trends.
1. Quantitative Primary Research
Objective: Generate statistically significant data directly from market participants.
Approaches:- Structured surveys with customers, distributors, and field agents
- Mobile-based data collection for point-of-sale audits and usage behavior
- Phone-based interviews (CATI) for market sizing and product feedback
- Online polling around industry events and digital campaigns
- Purchase frequency by customer type
- Channel performance across geographies
- Feature demand by application or demographic
2. Qualitative Primary Research
Objective: Explore decision-making drivers, pain points, and market readiness.
Approaches:- In-depth interviews (IDIs) with executives, product managers, and key decision-makers
- Focus groups among end users and early adopters
- Site visits and observational research for consumer products
- Informal field-level discussions for regional and cultural nuances
SECONDARY RESEARCH
This phase helps establish a macro-to-micro understanding of market trends, size, regulation, and competitive dynamics, sourced from credible and public domain information.
1. Quantitative Secondary Research
Objective: Model market value and segment-level forecasts based on published data.
Sources include:- Financial reports and investor summaries
- Government trade data, customs records, and regulatory statistics
- Industry association publications and economic databases
- Channel performance and pricing data from marketplace listings
- Revenue splits, pricing trends, and CAGR estimates
- Supply-side capacity and volume tracking
- Investment analysis and funding benchmarks
2. Qualitative Secondary Research
Objective: Capture strategic direction, innovation signals, and behavioral trends.
Sources include:- Company announcements, roadmaps, and product pipelines
- Publicly available whitepapers, conference abstracts, and academic research
- Regulatory body publications and policy briefs
- Social and media sentiment scanning for early-stage shifts
- Strategic shifts in market positioning
- Unmet needs and white spaces
- Regulatory triggers and compliance impact

DUAL MODELING: TOP-DOWN + BOTTOM-UP
To ensure robust market estimation, we apply two complementary sizing approaches:
Top-Down Modeling:- Start with broader industry value (e.g., global or regional TAM)
- Apply filters by segment, geography, end-user, or use case
- Adjust with primary insights and validation benchmarks
- Ideal for investor-grade market scans and opportunity mapping
- Aggregate from the ground up using sales volumes, pricing, and unit economics
- Use internal modeling templates aligned with stakeholder data
- Incorporate distributor-level or region-specific inputs
- Most accurate for emerging segments and granular sub-markets
DATA VALIDATION: IN-HOUSE REPOSITORY
We close the loop with proprietary data intelligence built from ongoing projects, industry monitoring, and historical benchmarking. This repository includes:
- Multi-sector market and pricing models
- Key trendlines from past interviews and forecasts
- Benchmarked adoption rates, churn patterns, and ROI indicators
- Industry-specific deviation flags and cross-check logic
- Catches inconsistencies early
- Aligns projections across studies
- Enables consistent, high-trust deliverables