
Automated Visual Field Analyzer Market Size and Forecast (2026–2034), Global and Regional Growth, Trend, Share and Industry Analysis Report Coverage; By Product Type (Static Perimeters, Kinetic Perimeters); By Application (Glaucoma Detection, Neurological Assessment, Retinal Disorders); By End User (Hospitals, Ophthalmology Clinics, Diagnostic Centers), and Geography
2026-05-22
Healthcare
Swetal (Research Analyst)
Description
Automated
Visual Field Analyzer Market Overview
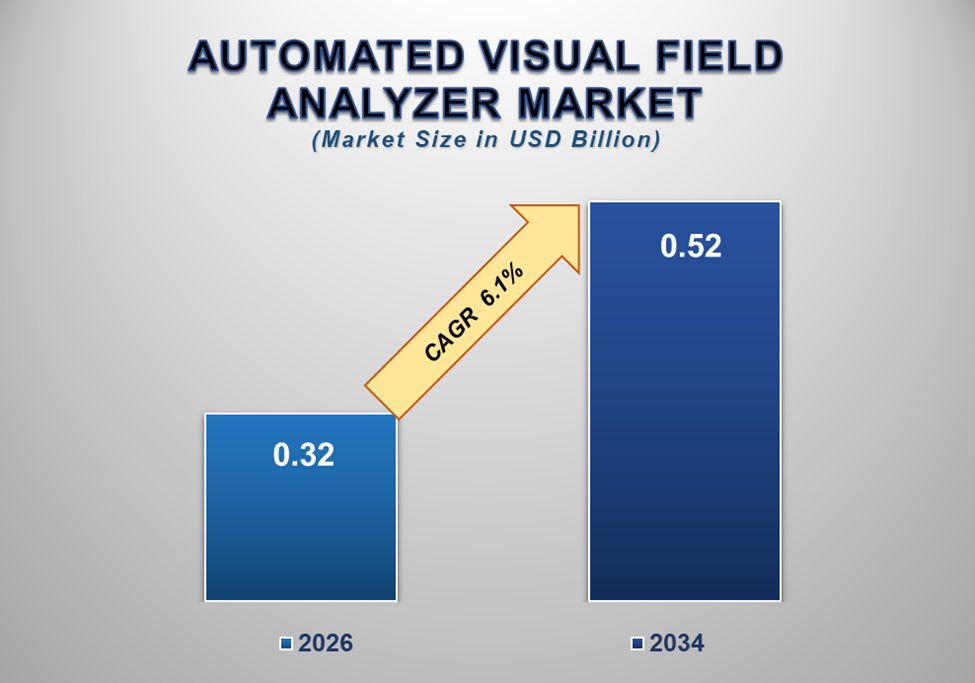
The global Automated Visual Field
Analyzer market was valued at USD 0.32 billion in 2026 and is
projected to reach USD 0.52 billion by 2034, expanding at a CAGR of 6.1%
during the forecast period. The market is experiencing steady growth driven
by the increasing prevalence of eye disorders, rising demand for early
diagnostic solutions, and advancements in ophthalmic diagnostic technologies.
Automated visual field analyzers, also
known as automated perimeters, are diagnostic devices used to assess a
patient’s visual field. These devices help detect blind spots and evaluate
peripheral vision, which is critical for diagnosing and monitoring various eye
and neurological conditions.
One of the primary applications of these
devices is in the detection and management of Glaucoma, a progressive
eye disease that can lead to irreversible vision loss if not diagnosed early.
Visual field testing plays a crucial role in identifying functional vision loss
associated with glaucoma and other conditions.
The increasing global burden of vision
impairment, driven by aging populations and lifestyle factors, is significantly
contributing to the demand for advanced diagnostic tools. Additionally, the
growing emphasis on preventive healthcare and early diagnosis is encouraging
the adoption of automated visual field analyzers.
Technological advancements, including improved software algorithms, enhanced patient interfaces, and integration with digital healthcare systems, are further supporting market growth. As healthcare systems continue to prioritize accurate and efficient diagnostic solutions, the automated visual field analyzer market is expected to expand steadily through 2034.
Automated Visual Field Analyzer Market
Drivers and Opportunities
Rising Prevalence of Eye Disorders and
Need for Early Diagnosis Is Driving Market Growth
The increasing prevalence of eye conditions
such as Glaucoma, retinal disorders, and neurological vision impairments
is a major driver of the automated visual field analyzer market.
Glaucoma is often asymptomatic in its early
stages, making regular visual field testing essential for early detection and
effective management. Delayed diagnosis can lead to permanent vision loss,
increasing the importance of advanced diagnostic tools.
Additionally, aging populations are more susceptible to vision-related conditions, further driving the demand for visual field analyzers. The growing awareness about eye health and the importance of routine eye examinations is also contributing to market growth.
Increasing Adoption of Advanced Diagnostic
Technologies Is Fueling Market Expansion
Healthcare providers are increasingly
adopting advanced diagnostic technologies to improve accuracy and efficiency in
patient care. Automated visual field analyzers offer several advantages over
traditional methods, including higher precision, reproducibility, and ease of
use.
Modern devices are equipped with advanced
software that enables detailed analysis and reporting, helping clinicians make
informed decisions. Integration with electronic health records (EHRs) and
telemedicine platforms is further enhancing their utility.
The shift toward digital healthcare and automation is driving the adoption of these devices in hospitals, clinics, and diagnostic centers.
Technological Advancements and Expansion
of Eye Care Services Present Significant Opportunities
Continuous advancements in ophthalmic
diagnostic technologies are creating new opportunities in the automated visual
field analyzer market. Innovations such as portable devices, faster testing
protocols, and improved patient comfort are enhancing the usability of these
systems.
The development of compact and
cost-effective devices is making visual field testing more accessible,
particularly in emerging markets and remote areas. Additionally, the
integration of artificial intelligence and data analytics is improving
diagnostic accuracy and enabling early detection of diseases.
The expansion of eye care services, along with government initiatives to promote vision health, is further supporting market growth. As technology continues to evolve and accessibility improves, the market is expected to witness significant expansion.
Automated Visual Field Analyzer Market
Scope
|
Report Attributes |
Description |
|
Market Size
in 2026 |
USD 0.32 Billion |
|
Market
Forecast in 2034 |
USD 0.52 Billion |
|
CAGR %
2026-2034 |
6.1% |
|
Base Year |
2025 |
|
Historic
Data |
2021-2025 |
|
Forecast
Period |
2026-2034 |
|
Report USP |
Production, Consumption,
Company Share, Company Heatmap, Company Production, Service Type, Growth
Factors and more |
|
Segments
Covered |
∙ By Product Type |
|
Regional
Scope |
● North America |
|
Country
Scope |
U.S. |
Automated Visual Field Analyzer Market
Report Segmentation Analysis
The global automated visual field analyzer market industry analysis is segmented by product type, by application, by end user, and by region.
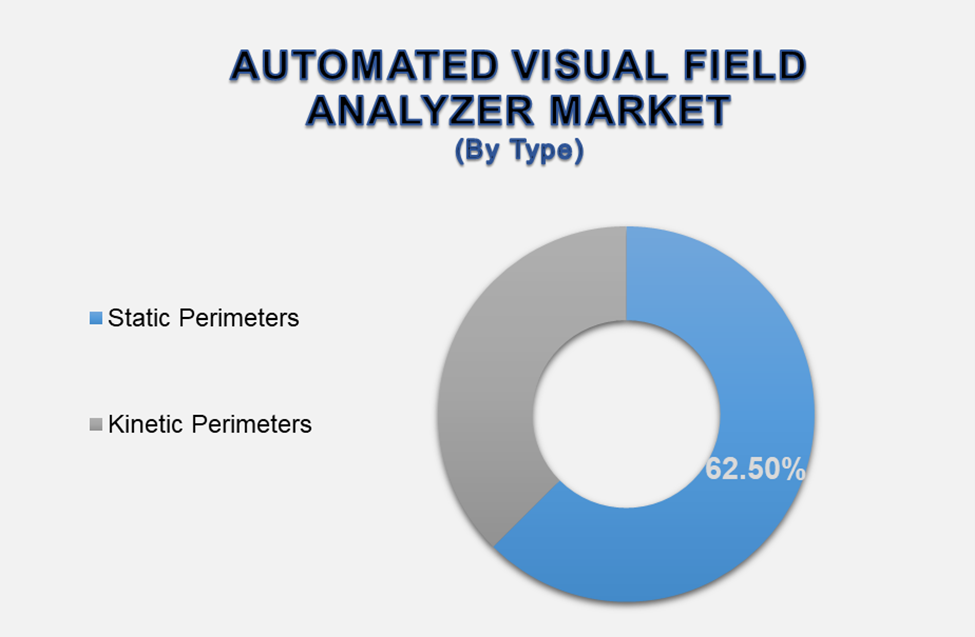
Static Perimeters Segment Is Expected to
Dominate the Market During the Forecast Period
The static perimeters segment accounted for approximately 62.5% of the global market, making it the dominant category.
Static perimeters are widely used due to
their high accuracy and ability to detect subtle visual field defects, making
them essential for glaucoma diagnosis and monitoring.
The Glaucoma Detection Segment Is Expected
to Lead the Market by Application
The Glaucoma detection segment dominates the market, as visual field analysis is a critical component in diagnosing and managing the disease.
Ophthalmology Clinics Segment Is Expected
to Dominate the End-User Market
Ophthalmology clinics hold the largest share due to the high volume of eye examinations and specialized diagnostic procedures performed in these settings.
The following segments are part of an in-depth analysis of the global Automated Visual Field Analyzer market:
|
Market
Segments |
|
|
By
Product Type |
∙
Static Perimeters |
|
By
Application |
∙
Glaucoma Detection |
|
By
End User |
∙
Hospitals |
Automated Visual Field Analyzer Market
Share Analysis By Region
North America is projected to hold the
largest share of the global automated visual field analyzer market over the
forecast period.
North America accounted for approximately 39.2%
of the global market in 2026, driven by advanced healthcare infrastructure,
high awareness of eye health, and early adoption of diagnostic technologies.
Asia Pacific is expected to register the
highest CAGR during the forecast period due to the increasing prevalence of
vision disorders, expanding healthcare facilities, and growing awareness about
eye care.
Automated Visual Field Analyzer Market
Competition Landscape Analysis
The market is moderately competitive, with companies focusing on product innovation, technological advancements, and strategic collaborations to strengthen their market position.
Global Automated Visual Field Analyzer
Market Recent Developments News:
∙ In March 2026 – New portable visual field
analyzers were introduced to improve accessibility.
∙ In November 2025 – Integration of AI-based diagnostic tools enhanced accuracy
in visual field testing.
∙ In August 2025 – Expansion of eye care programs increased adoption of
diagnostic devices.
The Global Automated Visual Field Analyzer
Market is dominated by a few large companies, such as
∙ Carl Zeiss Meditec AG
∙ Topcon Corporation
∙ Haag-Streit Group
∙ Heidelberg Engineering GmbH
∙ Konan Medical USA Inc.
∙ NIDEK Co., Ltd.
∙ Optopol Technology Sp. z o.o.
∙ Kowa Company, Ltd.
∙ Metrovision
∙ Medmont International Pty Ltd
∙ Others
Frequently Asked Questions
Swetal (Research Analyst)
She contributes to advanced market research reports by analyzing regulatory frameworks, emerging healthcare technologies, competitive landscapes, and innovation trends shaping the medical industry. With a strong focus on accurate market intelligence, strategic insights, and healthcare industry trends, Swetal supports businesses in making informed, data-backed decisions in a rapidly transforming healthcare environment.
1.
Global Automated Visual
Field Analyzer Market Introduction and Market Overview
1.1. Objectives of the Study
1.2. Global Automated Visual Field Analyzer Market Scope and Market
Estimation
1.2.1.
Global Automated Visual Field
Analyzer Overall Market Size (US$ Million), Market CAGR (%), Market Forecast
(2026 - 2034)
1.2.2.
Global Automated Visual Field
Analyzer Market Revenue Share (%) and Growth Rate (Y-o-Y) from 2021 - 2034
1.3. Market Segmentation
1.3.1.
Product Type of Global
Automated Visual Field Analyzer Market
1.3.2.
Application of Global Automated
Visual Field Analyzer Market
1.3.3.
End User of Global Automated
Visual Field Analyzer Market
1.3.4.
Region of Global Automated
Visual Field Analyzer Market
2.
Executive Summary
2.1. Demand Side Trends
2.2. Key Market Trends
2.3. Market Demand (US$ Million) Analysis 2021 – 2025 and Forecast, 2026
– 2034
2.4. Demand and Opportunity Assessment
2.5. Key Developments
2.6. Overview of Tariff, Regulatory Landscape and Standards
2.7. Market Entry Strategies
2.8. Market Dynamics
2.8.1.
Drivers
2.8.1.1.
Rising Prevalence of Eye
Disorders and Vision Impairment
2.8.1.2.
Increasing Demand for Early
Diagnosis of Glaucoma
2.8.1.3.
Growing Awareness About
Preventive Eye Care
2.8.2.
Limitations
2.8.2.1.
High Cost of Advanced
Diagnostic Equipment
2.8.2.2.
Limited Accessibility in
Developing Regions
2.8.3.
Opportunities
2.8.3.1.
Integration of AI-Based
Diagnostic Technologies
2.8.3.2.
Expansion of Eye Care Services
in Emerging Markets
2.8.3.3.
Development of Portable and
Cost-Effective Devices
2.8.4.
Impact Analysis of Drivers and
Restraints
2.9. Porter’s Five Forces Analysis
2.10.
PEST Analysis
3.
Global Automated Visual
Field Analyzer Market Estimates & Historical Trend Analysis (2021 - 2025)
4.
Global Automated Visual
Field Analyzer Market Estimates & Forecast Trend Analysis, by Product Type
4.1. Global Automated Visual Field Analyzer Market Revenue (US$ Million)
Estimates and Forecasts, by Product Type, 2021 - 2034
4.1.1.
Static Perimeters
4.1.2.
Kinetic Perimeters
5.
Global Automated Visual
Field Analyzer Market Estimates & Forecast Trend Analysis, by Application
5.1. Global Automated Visual Field Analyzer Market Revenue (US$ Million)
Estimates and Forecasts, by Application, 2021 - 2034
5.1.1.
Glaucoma Detection
5.1.2.
Neurological Assessment
5.1.3.
Retinal Disorders
6.
Global Automated Visual
Field Analyzer Market Estimates & Forecast Trend Analysis, by End User
6.1. Global Automated Visual Field Analyzer Market Revenue (US$ Million)
Estimates and Forecasts, by End User, 2021 - 2034
6.1.1.
Hospitals
6.1.2.
Ophthalmology Clinics
6.1.3.
Diagnostic Centers
7.
Global Automated Visual
Field Analyzer Market Estimates & Forecast Trend Analysis, by Region
7.1. Global Automated Visual Field Analyzer Market Revenue (US$ Million)
Estimates and Forecasts, by Region, 2021 - 2034
7.1.1.
North America
7.1.2.
Europe
7.1.3.
Asia Pacific
7.1.4.
Middle East & Africa
7.1.5.
Latin America
8.
North America Automated
Visual Field Analyzer Market: Estimates & Forecast Trend Analysis
8.1. North America Automated Visual Field Analyzer Market Assessments
& Key Findings
8.1.1.
North America Automated Visual
Field Analyzer Market Introduction
8.1.2.
North America Automated Visual
Field Analyzer Market Size Estimates and Forecast (US$ Million) (2021 - 2034)
8.1.2.1.
By Product Type
8.1.2.2.
By Application
8.1.2.3.
By End User
8.1.2.4.
By Country
8.1.2.4.1.
The U.S.
8.1.2.4.2.
Canada
9.
Europe Automated Visual
Field Analyzer Market: Estimates & Forecast Trend Analysis
9.1. Europe Automated Visual Field Analyzer Market Assessments & Key
Findings
9.1.1.
Europe Automated Visual Field
Analyzer Market Introduction
9.1.2.
Europe Automated Visual Field
Analyzer Market Size Estimates and Forecast (US$ Million) (2021 - 2034)
9.1.2.1.
By Product Type
9.1.2.2.
By Application
9.1.2.3.
By End User
9.1.2.4.
By Country
9.1.2.4.1.
Germany
9.1.2.4.2.
Italy
9.1.2.4.3.
U.K.
9.1.2.4.4.
France
9.1.2.4.5.
Spain
9.1.2.4.6.
Switzerland
9.1.2.4.7.
Rest of Europe
10. Asia Pacific Automated Visual Field Analyzer Market: Estimates &
Forecast Trend Analysis
10.1.
Asia Pacific Market Assessments
& Key Findings
10.1.1.
Asia Pacific Automated Visual
Field Analyzer Market Introduction
10.1.2.
Asia Pacific Automated Visual
Field Analyzer Market Size Estimates and Forecast (US$ Million) (2021 - 2034)
10.1.2.1.
By Product Type
10.1.2.2.
By Application
10.1.2.3.
By End User
10.1.2.4.
By Country
10.1.2.4.1.
China
10.1.2.4.2.
Japan
10.1.2.4.3.
India
10.1.2.4.4.
Australia
10.1.2.4.5.
South Korea
10.1.2.4.6.
Rest of Asia Pacific
11. Middle East & Africa Automated Visual Field Analyzer Market:
Estimates & Forecast Trend Analysis
11.1.
Middle East & Africa Market
Assessments & Key Findings
11.1.1.
Middle East & Africa
Automated Visual Field Analyzer Market Introduction
11.1.2.
Middle East & Africa
Automated Visual Field Analyzer Market Size Estimates and Forecast (US$
Million) (2021 - 2034)
11.1.2.1.
By Product Type
11.1.2.2.
By Application
11.1.2.3.
By End User
11.1.2.4.
By Country
11.1.2.4.1.
UAE
11.1.2.4.2.
Saudi Arabia
11.1.2.4.3.
South Africa
11.1.2.4.4.
Rest of MEA
12. Latin America Automated Visual Field Analyzer Market: Estimates
& Forecast Trend Analysis
12.1.
Latin America Market
Assessments & Key Findings
12.1.1.
Latin America Automated Visual
Field Analyzer Market Introduction
12.1.2.
Latin America Automated Visual
Field Analyzer Market Size Estimates and Forecast (US$ Million) (2021 - 2034)
12.1.2.1.
By Product Type
12.1.2.2.
By Application
12.1.2.3.
By End User
12.1.2.4.
By Country
12.1.2.4.1.
Brazil
12.1.2.4.2.
Mexico
12.1.2.4.3.
Argentina
12.1.2.4.4.
Rest of LATAM
13. Competition Landscape
13.1.
Global Automated Visual Field
Analyzer Market Product Mapping
13.2.
Global Automated Visual Field
Analyzer Market Concentration Analysis, by Leading Players / Innovators /
Emerging Players / New Entrants
13.3.
Global Automated Visual Field
Analyzer Market Tier Structure Analysis
13.4.
Global Automated Visual Field
Analyzer Market Concentration & Company Market Shares (%) Analysis, 2025
14. Company Profiles
14.1.
Carl Zeiss Meditec AG
14.1.1.
Company Overview & Key
Stats
14.1.2.
Financial Performance &
KPIs
14.1.3.
Product Portfolio
14.1.4.
SWOT Analysis
14.1.5.
Business Strategy & Recent
Developments
*Similar details would be provided for all
the players mentioned below
14.2.
Topcon Corporation
14.3.
Haag-Streit Group
14.4.
Heidelberg Engineering GmbH
14.5.
Konan Medical USA Inc.
14.6.
NIDEK Co., Ltd.
14.7.
Optopol Technology Sp. z o.o.
14.8.
Kowa Company, Ltd.
14.9.
Metrovision
14.10.
Medmont International Pty Ltd
14.11.
Others
15. Research Findings & Conclusion
16. Assumption & Acronyms Used
17. Research Methodology
17.1.
External Databases
17.2.
Internal Proprietary Database
17.3.
Primary Research
17.4.
Secondary Research
17.5.
Assumptions
17.6.
Limitations
17.7.
Report FAQs
Our Research Methodology
"Insight without rigor is just noise."
We follow a comprehensive, multi-phase research framework designed to deliver accurate, strategic, and decision-ready intelligence. Our process integrates primary and secondary research , both quantitative and qualitative , along with dual modeling techniques ( top-down and bottom-up) and a final layer of validation through our proprietary in-house repository.
PRIMARY RESEARCH
Primary research captures real-time, firsthand insights from the market to understand behaviors, motivations, and emerging trends.
1. Quantitative Primary Research
Objective: Generate statistically significant data directly from market participants.
Approaches:- Structured surveys with customers, distributors, and field agents
- Mobile-based data collection for point-of-sale audits and usage behavior
- Phone-based interviews (CATI) for market sizing and product feedback
- Online polling around industry events and digital campaigns
- Purchase frequency by customer type
- Channel performance across geographies
- Feature demand by application or demographic
2. Qualitative Primary Research
Objective: Explore decision-making drivers, pain points, and market readiness.
Approaches:- In-depth interviews (IDIs) with executives, product managers, and key decision-makers
- Focus groups among end users and early adopters
- Site visits and observational research for consumer products
- Informal field-level discussions for regional and cultural nuances
SECONDARY RESEARCH
This phase helps establish a macro-to-micro understanding of market trends, size, regulation, and competitive dynamics, sourced from credible and public domain information.
1. Quantitative Secondary Research
Objective: Model market value and segment-level forecasts based on published data.
Sources include:- Financial reports and investor summaries
- Government trade data, customs records, and regulatory statistics
- Industry association publications and economic databases
- Channel performance and pricing data from marketplace listings
- Revenue splits, pricing trends, and CAGR estimates
- Supply-side capacity and volume tracking
- Investment analysis and funding benchmarks
2. Qualitative Secondary Research
Objective: Capture strategic direction, innovation signals, and behavioral trends.
Sources include:- Company announcements, roadmaps, and product pipelines
- Publicly available whitepapers, conference abstracts, and academic research
- Regulatory body publications and policy briefs
- Social and media sentiment scanning for early-stage shifts
- Strategic shifts in market positioning
- Unmet needs and white spaces
- Regulatory triggers and compliance impact

DUAL MODELING: TOP-DOWN + BOTTOM-UP
To ensure robust market estimation, we apply two complementary sizing approaches:
Top-Down Modeling:- Start with broader industry value (e.g., global or regional TAM)
- Apply filters by segment, geography, end-user, or use case
- Adjust with primary insights and validation benchmarks
- Ideal for investor-grade market scans and opportunity mapping
- Aggregate from the ground up using sales volumes, pricing, and unit economics
- Use internal modeling templates aligned with stakeholder data
- Incorporate distributor-level or region-specific inputs
- Most accurate for emerging segments and granular sub-markets
DATA VALIDATION: IN-HOUSE REPOSITORY
We close the loop with proprietary data intelligence built from ongoing projects, industry monitoring, and historical benchmarking. This repository includes:
- Multi-sector market and pricing models
- Key trendlines from past interviews and forecasts
- Benchmarked adoption rates, churn patterns, and ROI indicators
- Industry-specific deviation flags and cross-check logic
- Catches inconsistencies early
- Aligns projections across studies
- Enables consistent, high-trust deliverables