
Blue Hydrogen Market Size and Forecast (2025–2033), Global and Regional Growth, Trend, Share and Industry Analysis Report Coverage: By Technology (Steam Methane Reforming, Gas Partial Oxidation, Auto Thermal Reforming), By Transportation (Pipeline, Cryogenic Liquid Tankers, Others), By Application (Chemicals, Refinery, Power Generation, Others), and Geography
2026-01-02
Energy & Power
Ekta Chaurasia (Team Lead)
Description
Blue Hydrogen Market Overview
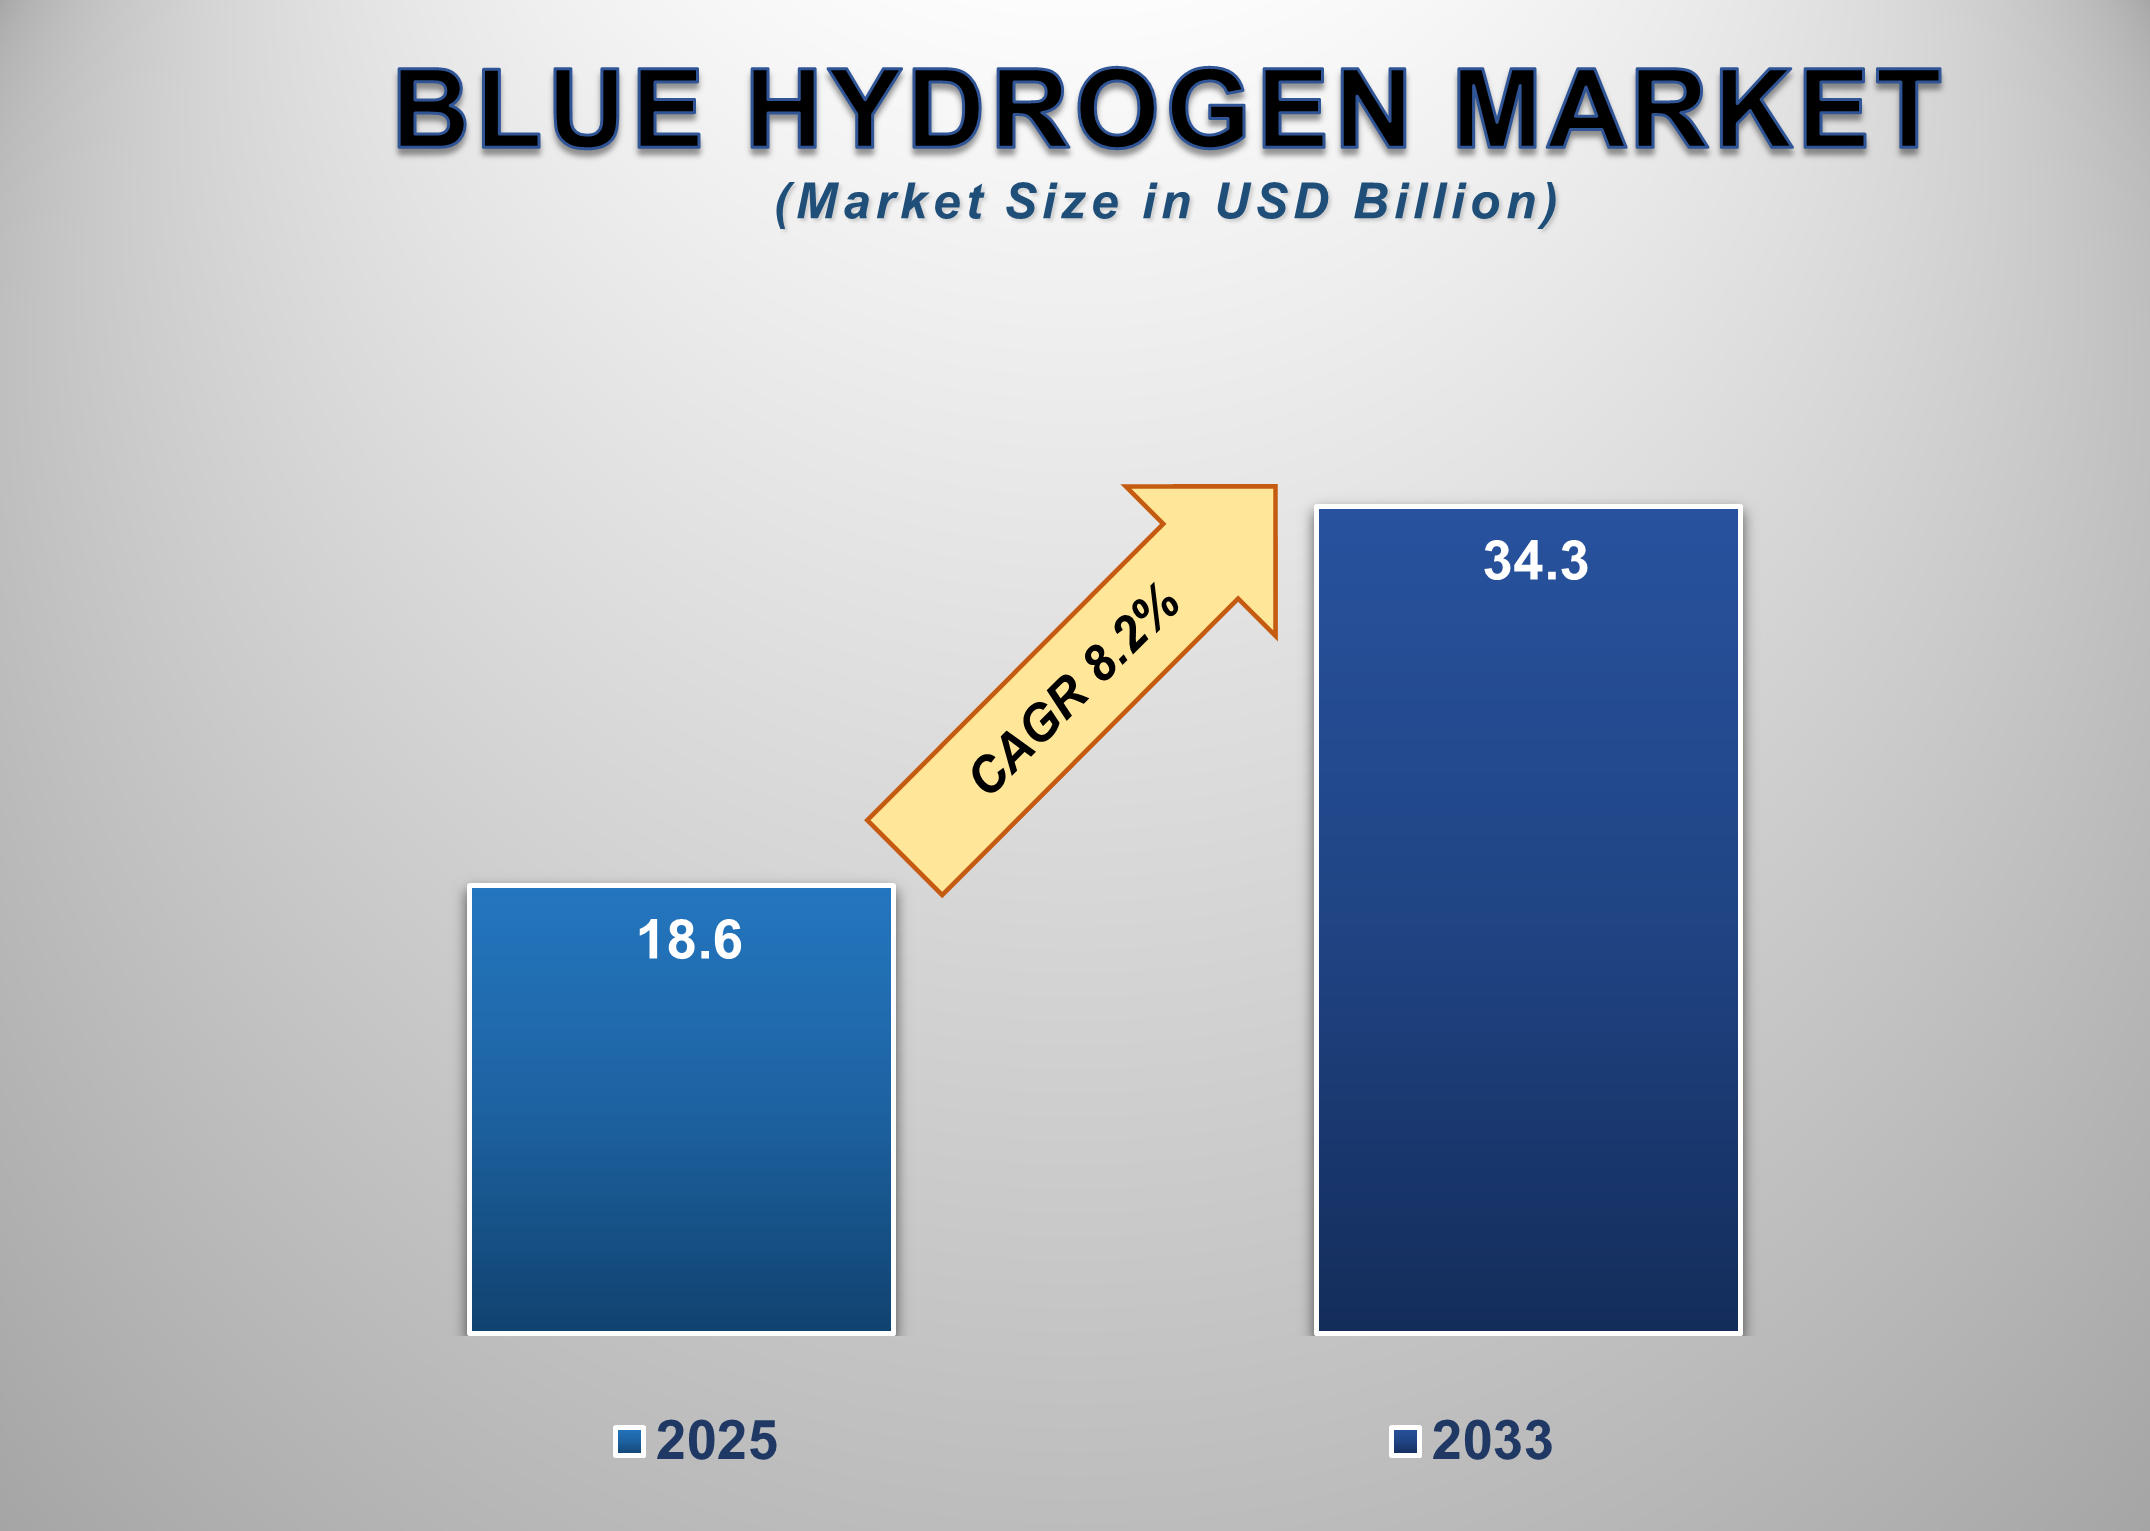
The global blue hydrogen market is expanding rapidly as the world accelerates its shift toward cleaner fuels and low-carbon industrial processes. Valued at USD 18.6 billion in 2025, the market is projected to grow to USD 34.3 billion by 2033, registering a strong CAGR of 8.2%. Blue hydrogen produced from natural gas with carbon capture, utilization, and storage (CCUS) has emerged as a critical transitional energy source capable of decarbonizing hard-to-abate sectors such as power generation, refining, ammonia production, and heavy industry. As global governments commit to net-zero targets, demand for low-emission hydrogen continues to surge across both developed and emerging markets.
Growing investment in CCUS
infrastructure, rising carbon taxes, and strong policy support for clean
hydrogen are key drivers of market growth. The hydrogen sector is also
benefitting from multi-billion-dollar funding programs in the U.S., Canada,
Europe, Japan, and South Korea aimed at establishing hydrogen hubs, advancing
transportation corridors, and enabling industrial-scale adoption. Blue hydrogen
offers a viable pathway to accelerate the broader hydrogen economy by providing
large-scale volumes at competitive costs compared to green hydrogen, which is
still limited by electrolyzer availability and renewable energy economics. Over
the forecast period, the integration of CCUS with natural gas reforming will
play a decisive role in accelerating the global energy transition, reinforcing
blue hydrogen’s position as a cornerstone of clean energy strategies.
Blue Hydrogen Market
Drivers and Opportunities
Escalating Global
Decarbonization Mandates Are Driving Large-Scale Adoption of Blue Hydrogen
Global commitments to carbon neutrality are causing a fundamental
shift in industrial, energy, and mobility systems, positioning blue hydrogen as
an essential decarbonization solution. Governments worldwide are implementing
stringent emission standards and carbon pricing mechanisms, compelling
industries to transition toward cleaner feedstocks and low-emission fuels. Blue
hydrogen allows companies to significantly cut CO₂ emissions while leveraging
existing natural gas infrastructure, enabling a smoother and more economically
viable transition compared to immediate adoption of green hydrogen. Major
economies, including the United States, the UK, Germany, Canada, Japan, and
South Korea, are developing hydrogen roadmaps that allocate substantial funding
and policy incentives for hydrogen production using carbon capture
technologies. Industrial clusters such as steel, cement, refining, and
chemicals are adopting blue hydrogen to comply with carbon reduction
regulations while maintaining operational efficiency. The commercial
transportation sector is also evaluating blue hydrogen as a potential fuel for
heavy-duty trucks, ships, and aviation, where electrification remains
technically challenging. The rapid expansion of CCUS capacity and technological
advancements in carbon capture rates are strengthening the business case for
blue hydrogen. With global emissions policies tightening and fossil-based
industries under increasing scrutiny, the demand for blue hydrogen is expected
to grow significantly through 2033.
Growing Investment in CCUS Infrastructure and Natural Gas
Reforming Is Strengthening Market Growth
Carbon capture, utilization, and storage (CCUS) technologies are
evolving rapidly, allowing natural gas reforming processes to produce hydrogen
with minimal carbon emissions. Steam methane reforming (SMR) and auto-thermal
reforming (ATR) combined with high-efficiency CO₂ capture systems are becoming
the preferred technologies for large-scale blue hydrogen production. As global
CCUS infrastructure expands, operational costs are decreasing, making blue
hydrogen competitive with conventional hydrogen and, in some regions, even with
early-stage green hydrogen. Globally, governments and private companies are
announcing large-scale CCUS investments and pipeline networks designed to
transport captured CO₂ to permanent storage sites. The U.S. Inflation Reduction
Act (IRA), EU Innovation Fund, Canada’s CCUS tax credits, and the UK’s Carbon
Capture & Storage Clusters are accelerating deployment at unprecedented
speed. Industrial players in oil & gas, refining, chemicals, and
fertilizers are integrating blue hydrogen into their long-term decarbonization
strategies to reduce carbon exposure and stabilize future operations.
Emerging Economies’ Industrialization and Energy Transition
Creating Strong Growth Opportunities
Emerging economies, particularly in Asia Pacific, the Middle East,
and Latin America, represent an enormous opportunity for blue hydrogen
adoption. As these regions expand industrial production, strengthen energy
security, and pursue emission reduction goals, hydrogen is gaining strategic
importance in national energy plans. Countries such as India, China, Saudi
Arabia, the UAE, and Brazil are investing heavily in building hydrogen-ready
infrastructure, expanding natural gas networks, and developing CCUS capabilities
to support blue hydrogen production. Rapid growth in refining, petrochemicals,
ammonia, and steel sectors in these regions is driving the need for cleaner
industrial feedstocks. Blue hydrogen, with its cost advantages over green
hydrogen and compatibility with existing industrial systems, is emerging as the
preferred transition fuel. The Middle East, in particular, is positioning
itself as a global hydrogen export hub due to its abundant natural gas
reserves, low production costs, and strong government backing. Asia-Pacific
nations are also pursuing hydrogen imports to meet clean energy requirements,
creating demand for global-scale blue hydrogen production and transportation
networks. Infrastructure investments in hydrogen pipelines, LNG retrofit
systems, and CO₂ storage reservoirs will further elevate blue hydrogen’s role
in emerging markets. With supportive policies and rising industrial
requirements, emerging economies will remain pivotal in driving global blue
hydrogen demand through 2033.
Blue Hydrogen Market
Scope
|
Report Attributes |
Description |
|
Market Size in 2025 |
USD 18.6 Billion |
|
Market Forecast in 2033 |
USD 34.3 Billion |
|
CAGR % 2025-2033 |
8.2% |
|
Base Year |
2024 |
|
Historic Data |
2020-2024 |
|
Forecast Period |
2025-2033 |
|
Report USP |
Production, Consumption,
Company Share, Company Heatmap, Company Production Capacity, Growth Factors,
and more |
|
Segments Covered |
●
By Technology,
Transportation, Application |
|
Regional Scope |
●
North America, ●
Europe, ●
APAC, ●
Latin America ●
Middle East and
Africa |
|
Country Scope |
1)
U.S. 2)
Canada 3)
Germany 4)
UK 5)
France 6)
Spain 7)
Italy 8)
Switzerland 9)
China 10)
Japan 11)
India 12)
Australia 13)
South Korea 14)
Brazil 15)
Mexico 16)
Argentina 17)
South Africa 18)
Saudi Arabia 19)
UAE |
Blue Hydrogen Market
Report Segmentation Analysis
The blue hydrogen market is segmented into technology,
transportation, application, and geography.
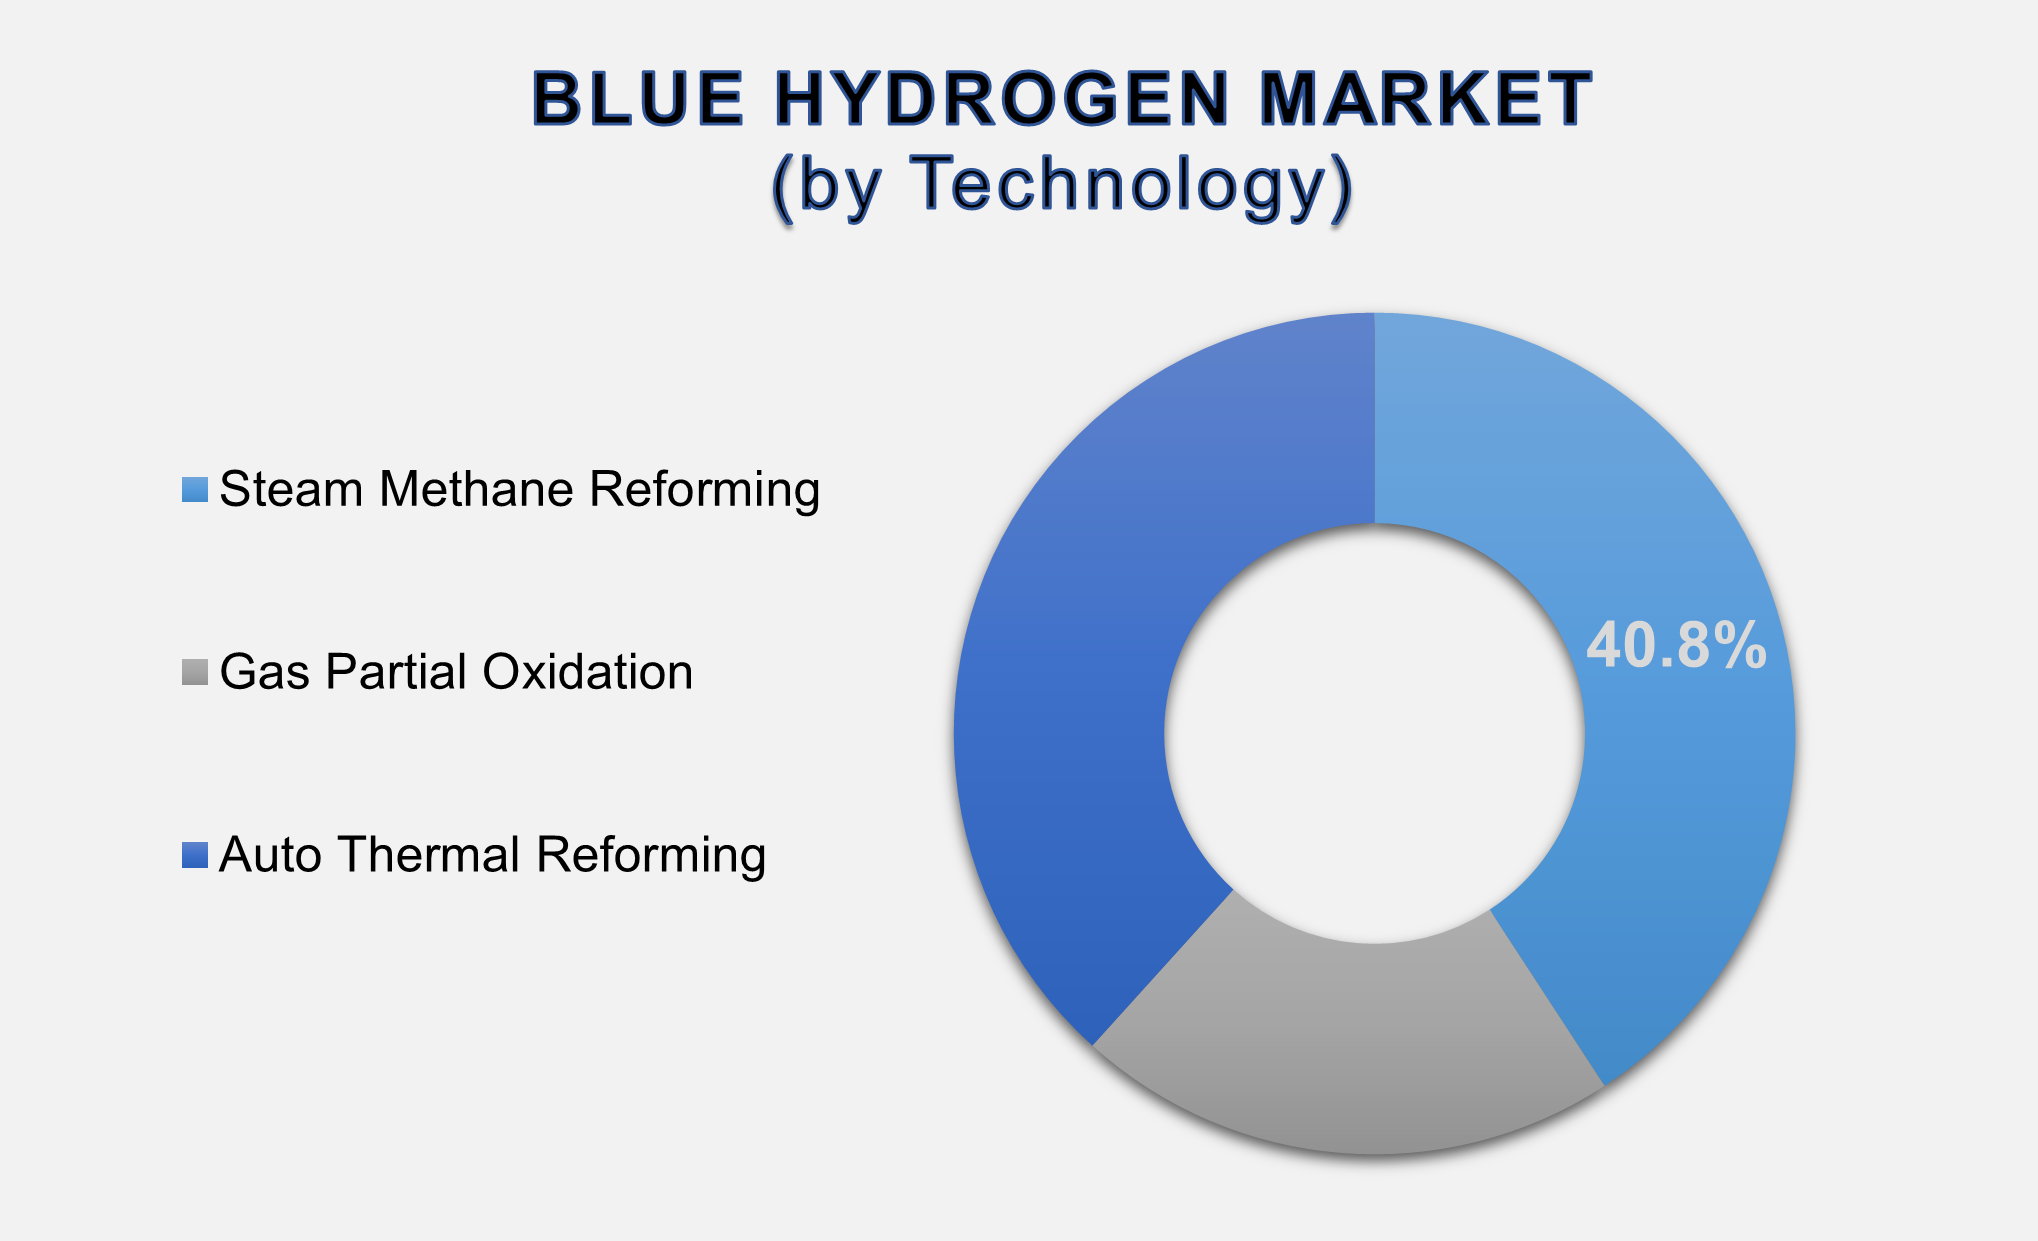
The Steam Methane
Reforming segment accounted for the largest market share in the global market.
Steam methane reforming (SMR) leads the global blue hydrogen market with a 40.8% share, supported by its technical maturity, large-scale deployment capabilities, and cost advantages compared to other reforming methods. SMR is widely used in refinery, chemical, and fertilizer industries due to its high hydrogen yield and compatibility with integrated CCUS systems. When combined with modern carbon capture technologies, SMR can achieve over 90–95% CO₂ capture efficiency, significantly reducing lifecycle emissions and making it one of the most commercially viable pathways for low-carbon hydrogen production. SMR’s well-established supply chain, existing natural gas infrastructure, and global availability of reforming technologies provide further advantages. The ongoing expansion of hydrogen hubs in the U.S., Canada, UK, and Middle East is heavily reliant on SMR due to its scalability and proven performance. Additionally, advancements in catalysts, process intensification, and heat integration are improving efficiency while lowering operating costs. As industries seek dependable and cost-effective solutions to decarbonize operations, SMR is expected to maintain its dominance through 2033, even as auto-thermal reforming gains traction for large-scale integrated CCUS projects.
Pipeline segment
accounted for the largest market share in the global market.
Pipeline transportation dominates
the blue hydrogen market due to its reliability, lower operational costs, and
suitability for high-volume hydrogen delivery to industrial clusters. Mature
natural gas pipeline networks allow repurposing of existing infrastructure for
hydrogen blends or pure hydrogen transport, significantly reducing new capital
investment requirements. Industrial facilities located within large energy hubs
such as those in North America, Europe, and the Middle East are particularly
well-positioned to benefit from pipeline-based hydrogen movement. Hydrogen
pipelines support continuous supply to refineries, chemical plants, power
stations, and steel industries, enabling efficient integration into downstream
processes. Several countries are developing hydrogen corridor projects to
expand pipeline networks, including the European Hydrogen Backbone (EHB), U.S.
Gulf Coast hydrogen pipelines, and large-scale infrastructure initiatives in
Japan and South Korea. As hydrogen demand accelerates, pipeline networks will
play a critical role in establishing long-term, cost-effective supply systems.
While cryogenic liquid tankers and carriers serve long-distance transport and
export markets, pipelines remain the preferred mode for industrial regions
where demand is concentrated. With increasing government support and
infrastructure modernization programs, the pipeline segment will continue to
grow steadily throughout the forecast period.
The Chemicals segment
accounted for the largest market share in the global market.
The chemicals segment leads the
global market, driven by extensive hydrogen use in ammonia production, methanol
synthesis, and various industrial chemical processes. Blue hydrogen is becoming
increasingly important as chemical manufacturers aim to reduce carbon emissions
from large-scale production facilities while maintaining output efficiency.
Ammonia plants, in particular, represent one of the highest hydrogen-consuming
industries, making them prime adopters of low-carbon hydrogen pathways. Blue
hydrogen provides an economically viable substitute for conventional hydrogen
derived from natural gas without carbon capture, enabling industries to meet
carbon-neutrality targets while avoiding major disruptions to existing
processes. Growing demand for low-carbon ammonia as a fertilizer component and
emerging fuel source is further driving segment growth. Methanol producers also
rely on hydrogen, and integrating blue hydrogen into production lines allows
them to achieve substantial emission reductions. With increasing regulatory
pressure and expanding clean hydrogen adoption across chemical, fertilizer, and
petrochemical industries, the chemical segment is expected to remain the
primary consumer of blue hydrogen throughout the forecast period.
The following segments are
part of an in-depth analysis of the global Blue Hydrogen market:
|
Market Segments |
|
|
by Technology |
●
Steam Methane
Reforming ●
Gas Partial
Oxidation ●
Auto Thermal
Reforming |
|
by
Transportation |
●
Pipeline ●
Cryogenic Liquid
Tankers |
|
by Application |
●
Chemicals ●
Refinery ●
Power Generation ●
Others |
Blue Hydrogen Market
Share Analysis by Region
North America is
anticipated to hold the biggest portion of the Blue Hydrogen Market globally
throughout the forecast period.
North
America leads due to aggressive federal funding, rapid deployment of hydrogen
hubs, and strong industrial demand across refining, chemicals, and power
sectors. The U.S. Inflation Reduction Act (IRA) provides substantial tax
credits for hydrogen production and CCUS, significantly improving commercial
viability. The region also benefits from extensive natural gas reserves,
large-scale CCUS facilities, and ongoing pipeline development projects.
Canada’s hydrogen and CCUS strategy further strengthens regional leadership,
especially in Alberta and British Columbia. With significant investments in
hydrogen storage, pipelines, and export terminals, North America will continue
dominating the blue hydrogen landscape.
Asia-Pacific is expected to grow
at the highest CAGR. Asia-Pacific’s rapid growth is driven by strong
industrialization, rising energy demand, and national commitments to reduce
carbon emissions. China, Japan, South Korea, and India are investing heavily in
hydrogen ecosystems, including large-scale reforming units, CCUS
infrastructure, and hydrogen-ready industrial plants. Japan and South Korea are
exploring blue hydrogen imports to support transportation and power generation
sectors, while the Middle East is emerging as a key exporter to Asia-Pacific
markets. Supportive policies, energy transition targets, and expanding heavy
industries will continue powering APAC’s strong growth trajectory.
Blue Hydrogen Market
Competition Landscape Analysis
The global blue hydrogen market
is moderately consolidated, with major energy companies, industrial gas
manufacturers, and technology providers driving innovation and capacity
expansion. Key players focus on scaling CCUS-integrated hydrogen production, developing
large industrial hubs, and establishing transportation infrastructure.
Strategic partnerships between oil & gas companies, utilities, and
government agencies are accelerating project development.
Global Blue Hydrogen
Market Recent Developments News:
- In March 2022 – Air Products Inc. announced
the construction of a new zero-carbon liquid hydrogen production facility
in Casa Grande, Arizona. The plant is designed to support the growing
demand for clean hydrogen and is scheduled to be operational by 2023.
- In January 2022 – Linde plc signed an
agreement with Yara to build and supply a 24 MW electrolysis-based
hydrogen plant. The facility will produce clean hydrogen to support
decarbonization efforts in the industrial sector.
The Global Blue Hydrogen Market Is Dominated by a Few Large Companies, such as
●
Air Liquide
●
Air Products and
Chemicals
●
Linde
●
Shell
●
BP
●
ExxonMobil
●
TotalEnergies
●
Equinor
●
Siemens Energy
●
Mitsubishi Power
●
Kawasaki Heavy
Industries
●
Toshiba Energy Systems
●
Doosan Fuel Cell
●
Uniper
●
Engie
●
BASF
●
SABIC
●
Yara International
●
CF Industries
●
Haldor Topsoe
● Others
Frequently Asked Questions
Ekta Chaurasia (Team Lead)
Ekta Chaurasia is a highly experienced Team Lead at M2Square Consultancy with over 7 years of expertise in market research, strategic consulting, competitive benchmarking, and business intelligence solutions. She specializes in ICT, semiconductors & electronics, automotive & transportation, and industrial machinery markets.
She leads end-to-end global research projects focused on market trends, industry analysis, growth forecasting, customer insights, and strategic decision-making. Known for her analytical leadership and industry expertise, Ekta helps businesses uncover growth opportunities, evaluate competitive landscapes, and stay ahead in rapidly evolving markets through accurate and insight-driven research.
1. Global Blue Hydrogen
Market Introduction and Market Overview
1.1.
Objectives
of the Study
1.2.
Global
Blue Hydrogen Market Scope and Market Estimation
1.2.1.Global Blue Hydrogen Overall
Market Size (US$ Bn), Market CAGR (%), Market forecast (2025 - 2033)
1.2.2.Global Blue Hydrogen
Market Revenue Share (%) and Growth Rate (Y-o-Y) from 2020 - 2033
1.3.
Market
Segmentation
1.3.1.Technology of Global Blue
Hydrogen Market
1.3.2.Transportation of Global Blue
Hydrogen Market
1.3.3.Application of Global Blue
Hydrogen Market
1.3.4.Region of Global Blue
Hydrogen Market
2. Executive
Summary
2.1.
Demand
Side Trends
2.2.
Key
Market Trends
2.3.
Market
Demand (US$ Bn) Analysis 2020 – 2024 and Forecast, 2025 – 2033
2.4.
Demand
and Opportunity Assessment
2.5.
Key
Developments
2.6.
Overview
of Tariff, Regulatory Landscape and Standards
2.7.
Market
Entry Strategies
2.8.
Market
Dynamics
2.8.1.Drivers
2.8.2.Limitations
2.8.3.Opportunities
2.8.4.Impact Analysis of Drivers
and Restraints
2.9.
Porter’s
Five Forces Analysis
2.10.
PEST
Analysis
3. Global
Blue Hydrogen Market Estimates
& Historical Trend Analysis (2020 - 2024)
4. Global
Blue Hydrogen Market Estimates
& Forecast Trend Analysis, by Technology
4.1.
Global
Blue Hydrogen Market Revenue (US$ Bn) Estimates and Forecasts, by Technology, 2020
- 2033
4.1.1.Steam Methane Reforming
4.1.2.Gas Partial Oxidation
4.1.3.Auto Thermal Reforming
5. Global
Blue Hydrogen Market Estimates
& Forecast Trend Analysis, by Transportation
5.1.
Global
Blue Hydrogen Market Revenue (US$ Bn) Estimates and Forecasts, by Transportation,
2020 - 2033
5.1.1.Pipeline
5.1.2.Cryogenic Liquid Tankers
6. Global
Blue Hydrogen Market Estimates
& Forecast Trend Analysis, by Application
6.1.
Global
Blue Hydrogen Market Revenue (US$ Bn) Estimates and Forecasts, by Application,
2020 - 2033
6.1.1.Chemicals
6.1.2.Refinery
6.1.3.Power Generation
6.1.4.Others
7. Global
Blue Hydrogen Market Estimates
& Forecast Trend Analysis, by Region
7.1.
Global
Blue Hydrogen Market Revenue (US$ Bn) Estimates and Forecasts, by Region, 2020
- 2033
7.1.1.North America
7.1.2.Europe
7.1.3.Asia Pacific
7.1.4.Middle East & Africa
7.1.5.Latin America
8. North America Blue
Hydrogen Market: Estimates &
Forecast Trend Analysis
8.1.
North
America Blue Hydrogen Market Assessments & Key Findings
8.1.1.North America Blue
Hydrogen Market Introduction
8.1.2.North America Blue
Hydrogen Market Size Estimates and Forecast (US$ Billion) (2020 - 2033)
8.1.2.1. By Technology
8.1.2.2. By Transportation
8.1.2.3. By Application
8.1.2.4.
By
Country
8.1.2.4.1. The U.S.
8.1.2.4.2. Canada
9. Europe Blue
Hydrogen Market: Estimates &
Forecast Trend Analysis
9.1.
Europe
Blue Hydrogen Market Assessments & Key Findings
9.1.1.Europe Blue Hydrogen
Market Introduction
9.1.2.Europe Blue Hydrogen
Market Size Estimates and Forecast (US$ Billion) (2020 - 2033)
9.1.2.1. By Technology
9.1.2.2. By Transportation
9.1.2.3. By Application
9.1.2.4.
By
Country
9.1.2.4.1.
Germany
9.1.2.4.2.
Italy
9.1.2.4.3.
U.K.
9.1.2.4.4.
France
9.1.2.4.5.
Spain
9.1.2.4.6.
Switzerland
9.1.2.4.7. Rest
of Europe
10. Asia Pacific Blue
Hydrogen Market: Estimates &
Forecast Trend Analysis
10.1.
Asia
Pacific Market Assessments & Key Findings
10.1.1.
Asia
Pacific Blue Hydrogen Market Introduction
10.1.2.
Asia
Pacific Blue Hydrogen Market Size Estimates and Forecast (US$ Billion) (2020 - 2033)
10.1.2.1. By Technology
10.1.2.2. By Transportation
10.1.2.3. By Application
10.1.2.4.
By
Country
10.1.2.4.1. China
10.1.2.4.2. Japan
10.1.2.4.3. India
10.1.2.4.4. Australia
10.1.2.4.5. South Korea
10.1.2.4.6. Rest of Asia Pacific
11. Middle East & Africa Blue
Hydrogen Market: Estimates &
Forecast Trend Analysis
11.1.
Middle
East & Africa Market Assessments & Key Findings
11.1.1.
Middle East & Africa Blue Hydrogen Market Introduction
11.1.2.
Middle East & Africa Blue Hydrogen Market Size Estimates
and Forecast (US$ Billion) (2020 - 2033)
11.1.2.1. By Technology
11.1.2.2. By Transportation
11.1.2.3. By Application
11.1.2.4.
By
Country
11.1.2.4.1. UAE
11.1.2.4.2. Saudi
Arabia
11.1.2.4.3. South
Africa
11.1.2.4.4. Rest
of MEA
12. Latin America
Blue Hydrogen Market: Estimates &
Forecast Trend Analysis
12.1.
Latin
America Market Assessments & Key Findings
12.1.1.
Latin
America Blue Hydrogen Market Introduction
12.1.2.
Latin
America Blue Hydrogen Market Size Estimates and Forecast (US$ Billion) (2020 - 2033)
12.1.2.1. By Technology
12.1.2.2. By Transportation
12.1.2.3. By Application
12.1.2.4.
By
Country
12.1.2.4.1. Brazil
12.1.2.4.2. Argentina
12.1.2.4.3. Mexico
12.1.2.4.4. Rest
of LATAM
13. Country Wise Market:
Introduction
14.
Competition
Landscape
14.1.
Global
Blue Hydrogen Market Product Mapping
14.2.
Global
Blue Hydrogen Market Concentration Analysis, by Leading Players / Innovators /
Emerging Players / New Entrants
14.3.
Global
Blue Hydrogen Market Tier Structure Analysis
14.4.
Global
Blue Hydrogen Market Concentration & Company Market Shares (%) Analysis,
2024
15.
Company
Profiles
15.1.
Air Liquide
15.1.1.
Company
Overview & Key Stats
15.1.2.
Financial
Performance & KPIs
15.1.3.
Product
Portfolio
15.1.4.
SWOT
Analysis
15.1.5.
Business
Strategy & Recent Developments
* Similar details would be provided for all the players
mentioned below
15.2. Air
Products and Chemicals
15.3. Linde
15.4. Shell
15.5. BP
15.6. ExxonMobil
15.7. TotalEnergies
15.8. Equinor
15.9. Siemens
Energy
15.10. Mitsubishi
Power
15.11. Kawasaki
Heavy Industries
15.12. Toshiba
Energy Systems
15.13. Doosan
Fuel Cell
15.14. Uniper
15.15. Engie
15.16. BASF
15.17. SABIC
15.18. Yara
International
15.19. CF
Industries
15.20. Haldor
Topsoe
15.21. Others
16. Research
Transportationology
16.1.
External
Transportations / Databases
16.2.
Internal
Proprietary Database
16.3.
Primary
Research
16.4.
Secondary
Research
16.5.
Assumptions
16.6.
Limitations
16.7.
Report
FAQs
17. Research
Findings & Conclusion
Our Research Methodology
"Insight without rigor is just noise."
We follow a comprehensive, multi-phase research framework designed to deliver accurate, strategic, and decision-ready intelligence. Our process integrates primary and secondary research , both quantitative and qualitative , along with dual modeling techniques ( top-down and bottom-up) and a final layer of validation through our proprietary in-house repository.
PRIMARY RESEARCH
Primary research captures real-time, firsthand insights from the market to understand behaviors, motivations, and emerging trends.
1. Quantitative Primary Research
Objective: Generate statistically significant data directly from market participants.
Approaches:- Structured surveys with customers, distributors, and field agents
- Mobile-based data collection for point-of-sale audits and usage behavior
- Phone-based interviews (CATI) for market sizing and product feedback
- Online polling around industry events and digital campaigns
- Purchase frequency by customer type
- Channel performance across geographies
- Feature demand by application or demographic
2. Qualitative Primary Research
Objective: Explore decision-making drivers, pain points, and market readiness.
Approaches:- In-depth interviews (IDIs) with executives, product managers, and key decision-makers
- Focus groups among end users and early adopters
- Site visits and observational research for consumer products
- Informal field-level discussions for regional and cultural nuances
SECONDARY RESEARCH
This phase helps establish a macro-to-micro understanding of market trends, size, regulation, and competitive dynamics, sourced from credible and public domain information.
1. Quantitative Secondary Research
Objective: Model market value and segment-level forecasts based on published data.
Sources include:- Financial reports and investor summaries
- Government trade data, customs records, and regulatory statistics
- Industry association publications and economic databases
- Channel performance and pricing data from marketplace listings
- Revenue splits, pricing trends, and CAGR estimates
- Supply-side capacity and volume tracking
- Investment analysis and funding benchmarks
2. Qualitative Secondary Research
Objective: Capture strategic direction, innovation signals, and behavioral trends.
Sources include:- Company announcements, roadmaps, and product pipelines
- Publicly available whitepapers, conference abstracts, and academic research
- Regulatory body publications and policy briefs
- Social and media sentiment scanning for early-stage shifts
- Strategic shifts in market positioning
- Unmet needs and white spaces
- Regulatory triggers and compliance impact

DUAL MODELING: TOP-DOWN + BOTTOM-UP
To ensure robust market estimation, we apply two complementary sizing approaches:
Top-Down Modeling:- Start with broader industry value (e.g., global or regional TAM)
- Apply filters by segment, geography, end-user, or use case
- Adjust with primary insights and validation benchmarks
- Ideal for investor-grade market scans and opportunity mapping
- Aggregate from the ground up using sales volumes, pricing, and unit economics
- Use internal modeling templates aligned with stakeholder data
- Incorporate distributor-level or region-specific inputs
- Most accurate for emerging segments and granular sub-markets
DATA VALIDATION: IN-HOUSE REPOSITORY
We close the loop with proprietary data intelligence built from ongoing projects, industry monitoring, and historical benchmarking. This repository includes:
- Multi-sector market and pricing models
- Key trendlines from past interviews and forecasts
- Benchmarked adoption rates, churn patterns, and ROI indicators
- Industry-specific deviation flags and cross-check logic
- Catches inconsistencies early
- Aligns projections across studies
- Enables consistent, high-trust deliverables