
Cashless Payments Market Size And Forecast (2020–2033), Global And Regional Growth, Trend, Share, and Industry Analysis Report Coverage: By Product (Groceries, Beauty & Personal Care, Fresh Food & Beverages, Electronics & Toys, Others), By Channel Type (Mobile Application, Web Portal), And Geography
2026-01-02
Business & Financial Services
Ekta Chaurasia (Team Lead)
Description
Cashless
Payments Market Overview
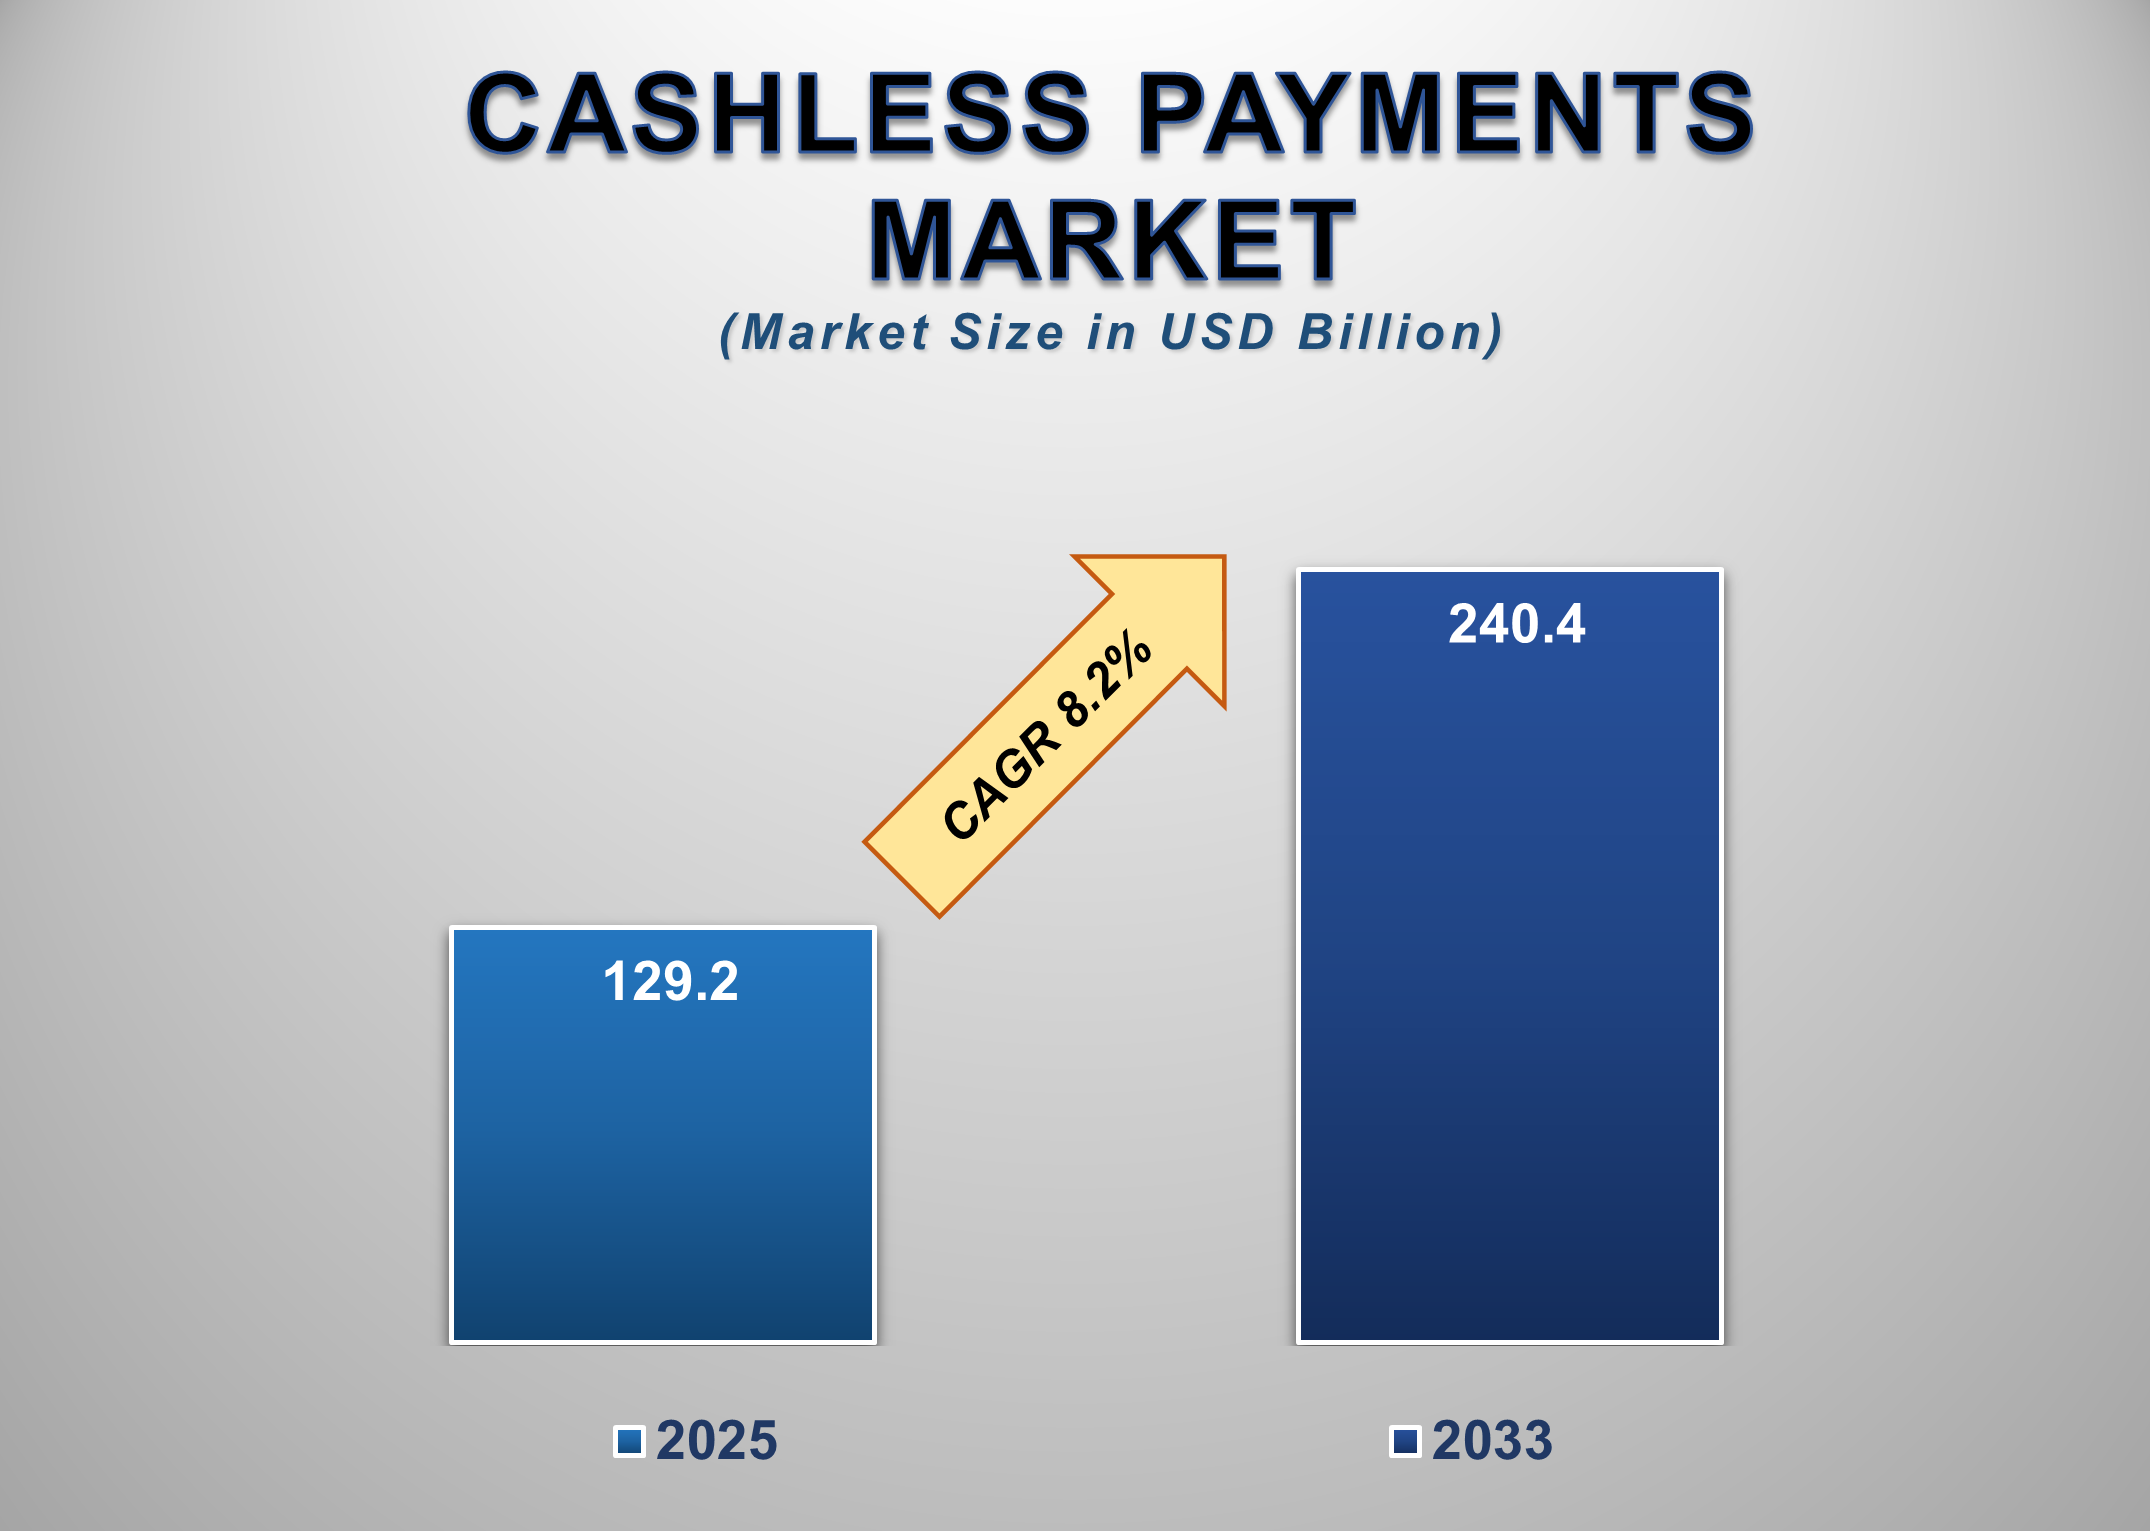
The Global Cashless Payments Market is entering a transformative growth phase between 2025 and 2033, driven by rapid cashlessization, the expansion of fintech ecosystems, and the increasing penetration of smartphones and internet services across both developed and emerging economies. The market is valued at USD 129.2 billion in 2025 and is projected to rise to USD 240.4 billion by 2033, reflecting a healthy CAGR of 8.2% over the forecast period. This growth is strongly supported by the rising adoption of mobile wallets, QR-based payments, digital banking platforms, and contactless card transactions that are reshaping how consumers and businesses engage in monetary exchanges.
Cashless payment systems provide
seamless, secure, and instant transaction capabilities, significantly reducing
reliance on physical currency while enhancing financial transparency,
transaction traceability, and operational efficiency for businesses. Governments
worldwide are promoting financial inclusion, reducing cash circulation, and
encouraging digital payments through regulatory incentives, tax benefits, and
the establishment of digital public infrastructure. In particular, economies
such as India, China, Singapore, the United States, and several European
nations are leading innovations in cashless ecosystems through real-time
payment systems, biometric authentication, and cross-border interoperability
frameworks.
Cashless Payments Market Drivers and
Opportunities
Rising Digital
Transformation and Fintech Innovation Are Significantly Driving the Cashless
Payments Market Growth
The
rapid digital transformation across banking, retail, and commerce ecosystems is
one of the strongest forces powering the expansion of the Cashless Payments
Market worldwide. A major factor behind this shift is the widespread adoption
of smartphones, high-speed internet, and mobile banking applications, enabling
users to execute peer-to-peer transfers, bill payments, online purchases, and
merchant transactions with unprecedented ease. Fintech companies and payment
service providers (PSPs) have introduced innovative platforms ranging from
mobile wallets and QR code payments to tap-and-go cards and biometric
authentication that are making digital payments faster, safer, and more
accessible. Governments in major economies are actively promoting cashless ecosystems
to enhance transparency, reduce tax leakage, minimize black-market
transactions, and improve financial documentation. Programs such as India's
Unified Payments Interface (UPI), Singapore's
PayNow, Europe's PSD2-driven open banking
framework, and the U.S. FedNow instant payments initiative have played a
transformative role in allowing seamless and interoperable digital payments
across sectors. The growth of e-commerce and digital marketplaces has further
fueled demand for online payment gateways and mobile-based payment channels.
The proliferation of wearable payments, voice-activated payments, and digital
identification systems is reshaping the payment landscape.
Growing Consumer
Preference for Contactless, Fast, and Secure Transactions Is Accelerating
Market Expansion
Consumer
behavior has undergone a dramatic shift toward convenience-driven, contactless,
and cash-free payments, especially after the COVID-19 pandemic, which
accelerated the global demand for hygienic and touch-free transaction methods.
Mobile wallets, NFC-based cards, QR code
payments, in-app transactions, and embedded payment features within super apps
have become dominant in both online and offline retail environments. This
increasing comfort with digital transactions,
particularly among younger demographics, has
strengthened the adoption of cashless payments across daily-use categories such
as groceries, personal care, pharmaceuticals, transport, fast food, and
entertainment. Advanced security features,
including multi-factor authentication (MFA), biometric verification,
tokenization, AI-driven fraud prevention, and real-time monitoring, are providing strong safeguards against cyber threats,
improving user trust, and encouraging greater
adoption. The rise of "Buy Now, Pay Later" (BNPL) platforms and instant
credit services integrated directly within digital payment channels is further
contributing to the growth of cashless ecosystems. Retailers and merchants
prefer digital payment acceptance due to reduced cash handling costs, error
reduction, faster settlements, and enhanced sales analytics. As more micro and
small enterprises join digital marketplaces and adopt UPI, POS terminals, QR
codes, and mobile payment apps, the global Cashless Payments Market is poised
to expand rapidly across both developed and developing countries in the coming
years.
Emerging Economies' Rapid
Digitalization and Fintech Adoption Are Creating High-Growth Opportunities
Worldwide
Emerging
markets across Asia-Pacific, Latin America, the Middle East, and Africa
represent major growth hotspots for cashless payments due to expanding
financial inclusion initiatives, rising smartphone usage, and government-led
digital economy programs. Countries such as India, Indonesia, Vietnam, Brazil,
Mexico, South Africa, and the UAE are witnessing surging demand for digital
wallets, QR-based payments, instant banking transfers, and e-commerce
transactions. These nations are transitioning rapidly away from cash as
financial literacy increases and fintech startups introduce highly
cost-effective and user-friendly digital payment platforms. In markets where
large unbanked populations dominate, mobile-based payments offer a
transformative opportunity for individuals to access financial services without
the need for traditional banking infrastructure. International players like
Visa, Mastercard, PayPal, and Stripe, along with regional leaders like Alipay,
WeChat Pay, Paytm, Mercado Pago, and M-Pesa, are expanding aggressively into
these geographies, forming partnerships with local banks, telecom operators,
and digital marketplaces. Government initiatives such as India's Digital India,
Brazil’s PIX instant payment system, and Middle Eastern smart city programs are
fast-tracking the deployment of interoperable digital payment frameworks.
Cashless Payments Market
Scope
|
Report Attributes |
Description |
|
Market Size in 2025 |
USD 129.2 Billion |
|
Market Forecast in 2033 |
USD 240.4 Billion |
|
CAGR % 2025-2033 |
8.2% |
|
Base Year |
2024 |
|
Historic Data |
2020-2024 |
|
Forecast Period |
2025-2033 |
|
Report USP |
Production, Consumption,
Company Share, Company Heatmap, Company Production Capacity, Growth Factors,
and more |
|
Segments Covered |
●
By Product, By
Channel Type |
|
Regional Scope |
●
North America ●
Europe ●
APAC ●
Latin America ●
Middle East and
Africa |
|
Country Scope |
1)
U.S. 2)
Canada 3)
Germany 4)
UK 5)
France 6)
Spain 7)
Italy 8)
Switzerland 9)
China 10)
Japan 11)
India 12)
Australia 13)
South Korea 14)
Brazil 15)
Mexico 16)
Argentina 17)
South Africa 18)
Saudi Arabia 19)
UAE |
Cashless Payments Market
Report Segmentation Analysis
The Global Cashless Payments
Market is segmented by Product, by Channel Type, and by Region.
The Groceries Segment
Accounted for the Largest Market Share in the Global Cashless Payments Market
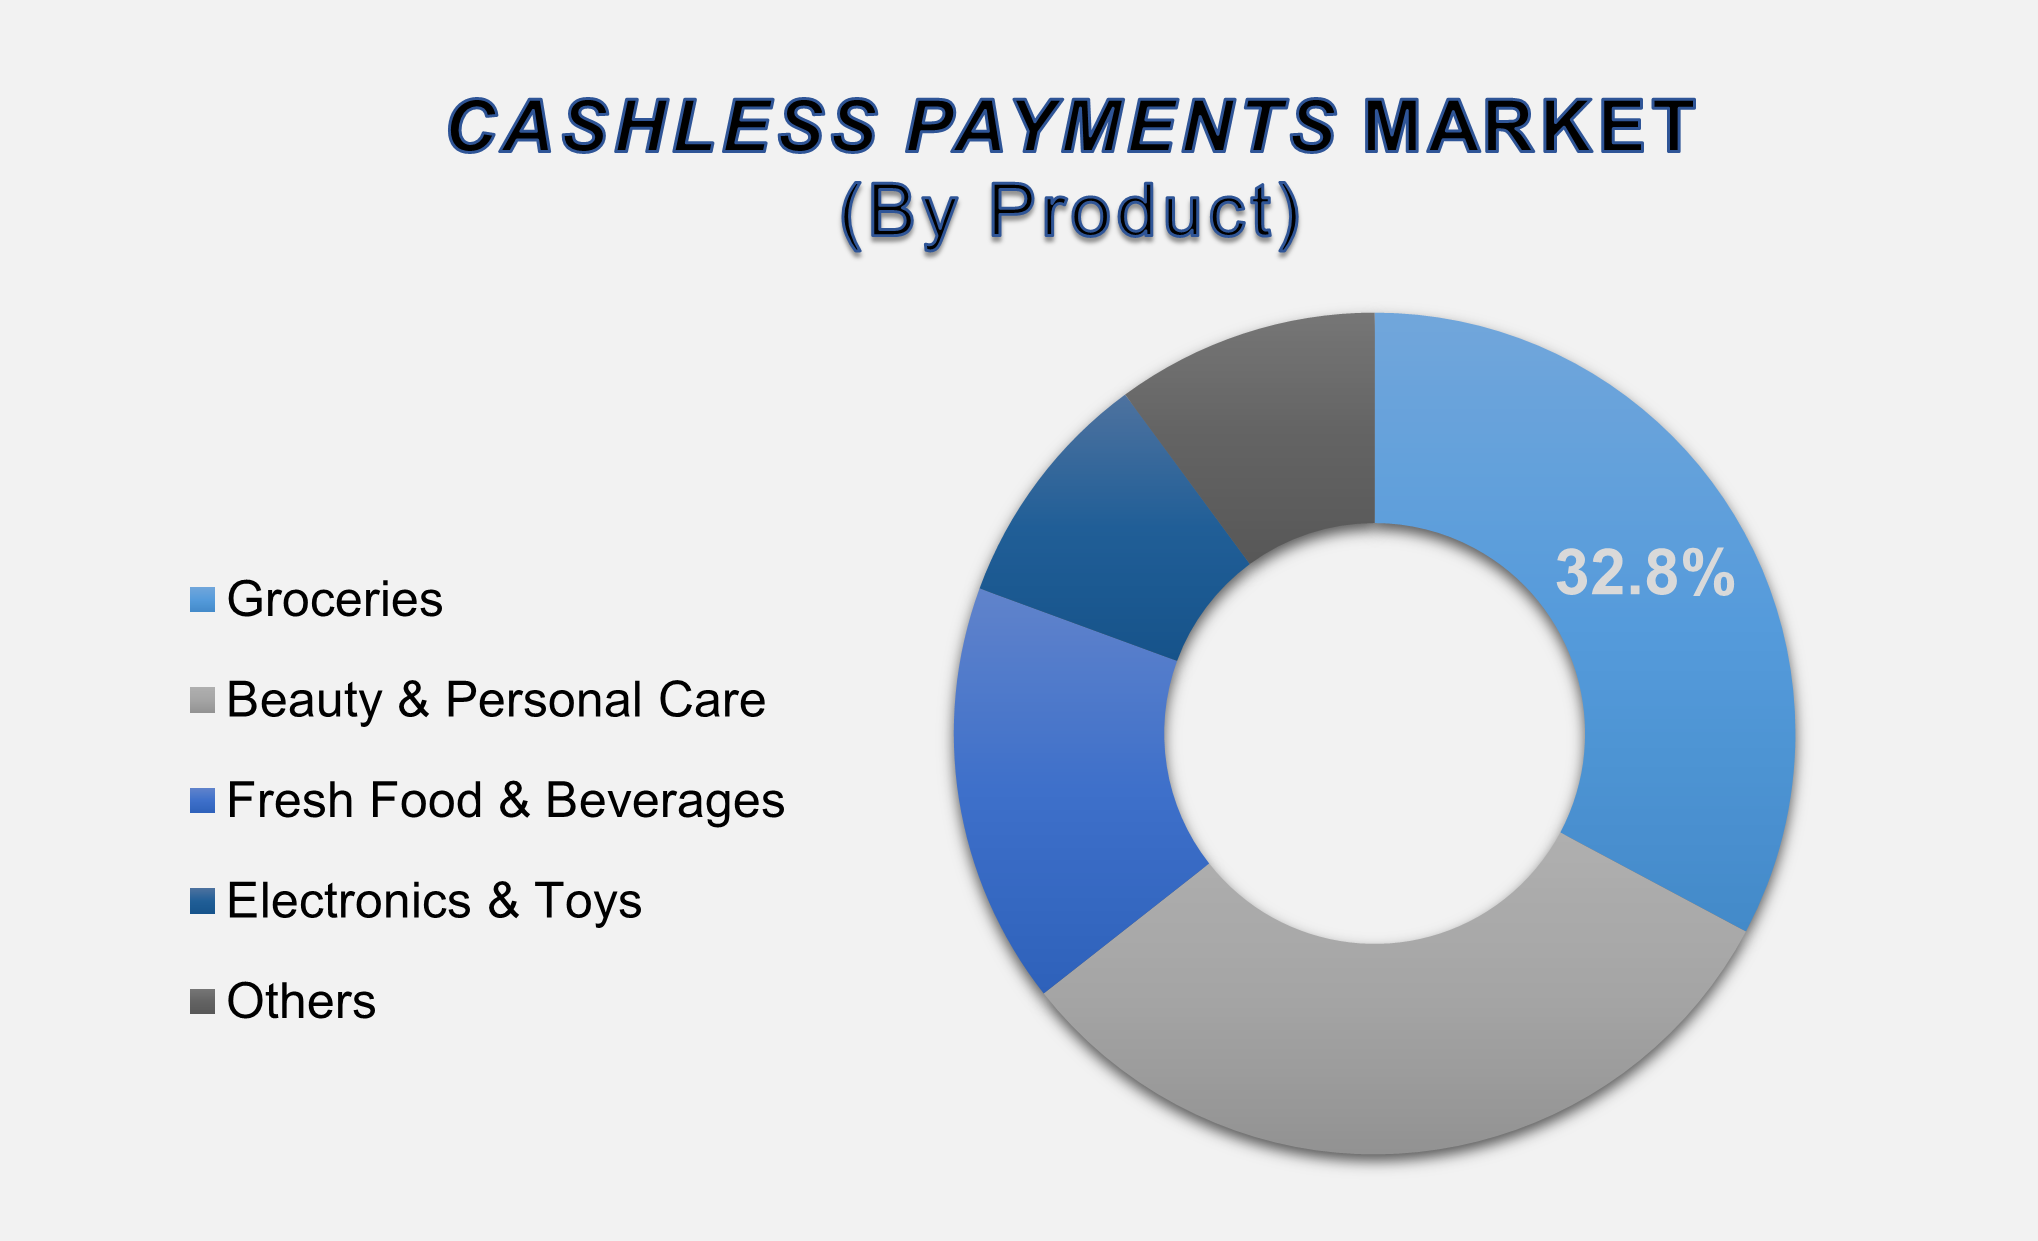
The groceries segment dominated the Cashless Payments Market in 2025 with a share of 32.8%, driven by a rapid increase in digital transactions across supermarkets, hypermarkets, convenience stores, and online grocery platforms. Consumers are increasingly preferring mobile wallets, QR-based payments, and instant bank transfers for grocery purchases due to ease of use, faster checkouts, and integration with loyalty programs and discounts. The expansion of quick commerce and on-demand delivery platforms has also boosted cashless transactions in daily essential categories. Key players such as Amazon Fresh, BigBasket, Instacart, and Blinkit have integrated end-to-end cashless payment options, increasing digital payment penetration in grocery retail. Supported by rising smartphone usage, expanding POS terminal deployment, and merchant acceptance of digital payments, the groceries segment will continue to drive significant market growth throughout the forecast period.
Mobile Application
Segment Dominated the Market and Will Grow at the Highest CAGR
By channel type, the mobile application segment holds the
largest share in 2025 and is projected to exhibit the strongest growth through
2033. Mobile payment applications, including
Apple Pay, Google Pay, Paytm, PhonePe, Alipay, WeChat Pay, and various banking
apps, are becoming central to global digital
payment infrastructure. These apps enable seamless peer-to-peer transfers,
online purchases, bill payments, merchant transactions, ticketing,
subscriptions, and international remittances. The increasing adoption of super
apps, which integrate payments with shopping, travel, social media, and
entertainment, is fueling growth. Mobile applications offer enhanced security
features such as biometrics, tokenization, and AI-driven fraud detection,
strengthening user trust and accelerating adoption. The segment is expected to
expand rapidly due to the rise of 5G-enabled instant payments, mobile-based POS
terminals, and digital banking evolution worldwide.
The following segments are
part of an in-depth analysis of the global Cashless Payments Market:
|
Market
Segments |
|
|
By Product |
●
Groceries ●
Beauty &
Personal Care ●
Fresh Food &
Beverages ●
Electronics &
Toys ●
Others |
|
By Channel
Type |
●
Mobile Application ●
Web Portal |
Cashless Payments Market Share Analysis by Region
The Asia Pacific region is projected to hold the
largest share of the global Cashless Payments market over the forecast period.
Asia-Pacific dominated the global
Cashless Payments Market with a 39.4% share in 2025, driven by the massive
adoption of mobile wallets, QR code payments, and digital banking solutions
across China, India, Japan, South Korea, and Southeast Asian countries. APAC is
the global epicenter for mobile-first financial ecosystems, with platforms like
Alipay, WeChat Pay, Paytm, PhonePe, and GrabPay leading widespread cashless
adoption. Government-backed digital payment infrastructure, India’s UPI,
Singapore’s PayNow, China’s PBOC-driven digital yuan, and Japan’s cashless
roadmap have further accelerated digital transaction growth. The region’s large
youth population, expanding e-commerce market, and rapid smartphone penetration
continue to strengthen APAC’s leadership in the global market.
North
America is expected to grow at the highest CAGR during the forecast period. The
region benefits from a mature fintech landscape, high credit card penetration,
strong security infrastructure, and rapid advancements in contactless payments,
embedded finance, and real-time payment systems. The U.S. market is witnessing
accelerated adoption of digital wallets, BNPL platforms, tap-to-pay solutions,
and Apple/Google ecosystem payments. Canada is also experiencing strong growth
in mobile banking and online retail transactions, driven by consumer preference
for convenient and secure digital payment options. With ongoing investments in
fintech innovation and real-time transaction networks such as FedNow and RTP,
North America is expected to be the fastest-growing regional market through
2033.
Cashless Payments Market Competition Landscape
Analysis
The global
Cashless Payments Market is moderately fragmented, with leading global firms
and rapidly expanding fintech companies competing through innovative
technologies, strategic partnerships, and ecosystem expansion. Companies are
investing heavily in authentication technologies, blockchain-based settlements,
cross-border payment capabilities, and cloud-native payment processing
solutions.
Global Cashless Payments Market Recent
Developments News:
- In February 2025, Shopify
renewed its partnership with Affirm, expanding Shop Pay Installments to
merchants in Canada and the U.K. This marks the first availability of the
buy-now-pay-later solution outside the U.S., supporting Shopify’s global
growth strategy.
- In February 2025, Cashfree
Payments raised USD 53 million in a funding round led by KRAFTON and Apis
Growth Fund II. The investment will enable the Indian fintech firm to
expand its payments portfolio and strengthen its market position.
- In December 2024, Visa Inc.
acquired Featurespace, a specialist in AI-driven fraud detection and
financial crime prevention. The acquisition enhances Visa’s real-time risk
management capabilities and strengthens security for global payment
networks.
The Global Cashless Payments Market is dominated
by a few large companies, such as
●
Visa
●
Mastercard
●
American Express
●
PayPal
●
Square
●
Stripe
●
Apple
●
Google
●
Alipay
●
WeChat Pay
●
Adyen
●
Fiserv
●
Worldpay
●
Global Payments
●
PayU
●
Razorpay
●
Paytm
●
Mercado Pago
●
TransferWise
●
Skrill
● Other Prominent Players
Frequently Asked Questions
Ekta Chaurasia (Team Lead)
Ekta Chaurasia is a highly experienced Team Lead at M2Square Consultancy with over 7 years of expertise in market research, strategic consulting, competitive benchmarking, and business intelligence solutions. She specializes in ICT, semiconductors & electronics, automotive & transportation, and industrial machinery markets.
She leads end-to-end global research projects focused on market trends, industry analysis, growth forecasting, customer insights, and strategic decision-making. Known for her analytical leadership and industry expertise, Ekta helps businesses uncover growth opportunities, evaluate competitive landscapes, and stay ahead in rapidly evolving markets through accurate and insight-driven research.
1. Global Cashless Payments
Market Introduction and Market Overview
1.1.
Objectives
of the Study
1.2.
Global
Cashless Payments Market Scope and Market Estimation
1.2.1.Global Cashless Payments Overall
Market Size (US$ Bn), Market CAGR (%), Market forecast (2025 - 2033)
1.2.2.Global Cashless Payments
Market Revenue Share (%) and Growth Rate (Y-o-Y) from 2020 - 2033
1.3.
Market
Segmentation
1.3.1.Product of Global Cashless
Payments Market
1.3.2.Channel Type of Global Cashless
Payments Market
1.3.3.Region of Global Cashless
Payments Market
2. Executive
Summary
2.1.
Demand
Side Trends
2.2.
Key
Market Trends
2.3.
Market
Demand (US$ Bn) Analysis 2020 – 2024 and Forecast, 2025 – 2033
2.4.
Demand
and Opportunity Assessment
2.5.
Demand
Supply Scenario
2.6.
Market
Dynamics
2.6.1.Drivers
2.6.2.Limitations
2.6.3.Opportunities
2.6.4.Impact Analysis of Drivers
and Restraints
2.7.
Emerging
Trends for Cashless Payments Market
2.8.
Porter’s
Five Forces Analysis
2.9.
PEST
Analysis
2.10.
Key
Regulation
3. Global
Cashless Payments Market Estimates
& Historical Trend Analysis (2020 - 2024)
4. Global
Cashless Payments Market Estimates
& Forecast Trend Analysis, by Product
4.1.
Global
Cashless Payments Market Revenue (US$ Bn) Estimates and Forecasts, by Product, 2020
- 2033
4.1.1.Groceries
4.1.2.Beauty & Personal Care
4.1.3.Fresh Food & Beverages
4.1.4.Electronics & Toys
4.1.5.Others
5. Global
Cashless Payments Market Estimates
& Forecast Trend Analysis, by Channel Type
5.1.
Global
Cashless Payments Market Revenue (US$ Bn) Estimates and Forecasts, by Channel
Type, 2020 - 2033
5.1.1.Mobile Application
5.1.2.Web Portal
6. Global
Cashless Payments Market Estimates
& Forecast Trend Analysis, by Region
6.1.
Global
Cashless Payments Market Revenue (US$ Bn) Estimates and Forecasts, by Region, 2020
- 2033
6.1.1.North America
6.1.2.Europe
6.1.3.Asia Pacific
6.1.4.Middle East & Africa
6.1.5.Latin America
7. North America Cashless
Payments Market: Estimates &
Forecast Trend Analysis
7.1.
North
America Cashless Payments Market Assessments & Key Findings
7.1.1.North America Cashless
Payments Market Introduction
7.1.2.North America Cashless
Payments Market Size Estimates and Forecast (US$ Billion) (2020 - 2033)
7.1.2.1. By Product
7.1.2.2. By Channel
Type
7.1.2.3.
By
Country
7.1.2.3.1. The U.S.
7.1.2.3.2. Canada
8. Europe Cashless
Payments Market: Estimates &
Forecast Trend Analysis
8.1.
Europe
Cashless Payments Market Assessments & Key Findings
8.1.1.Europe Cashless Payments
Market Introduction
8.1.2.Europe Cashless Payments
Market Size Estimates and Forecast (US$ Billion) (2020 - 2033)
8.1.2.1. By Product
8.1.2.2. By Channel
Type
8.1.2.3.
By
Country
8.1.2.3.1.
Germany
8.1.2.3.2.
Italy
8.1.2.3.3.
U.K.
8.1.2.3.4.
France
8.1.2.3.5.
Spain
8.1.2.3.6.
Switzerland
8.1.2.3.7. Rest
of Europe
9. Asia Pacific Cashless
Payments Market: Estimates &
Forecast Trend Analysis
9.1.
Asia
Pacific Market Assessments & Key Findings
9.1.1.Asia Pacific Cashless
Payments Market Introduction
9.1.2.Asia Pacific Cashless
Payments Market Size Estimates and Forecast (US$ Billion) (2020 - 2033)
9.1.2.1. By Product
9.1.2.2. By Channel
Type
9.1.2.3.
By
Country
9.1.2.3.1.
China
9.1.2.3.2.
Japan
9.1.2.3.3.
India
9.1.2.3.4.
Australia
9.1.2.3.5.
South
Korea
9.1.2.3.6. Rest of Asia Pacific
10. Middle East & Africa Cashless
Payments Market: Estimates &
Forecast Trend Analysis
10.1.
Middle
East & Africa Market Assessments & Key Findings
10.1.1.
Middle East & Africa Cashless Payments Market
Introduction
10.1.2.
Middle East & Africa Cashless Payments Market Size Estimates
and Forecast (US$ Billion) (2020 - 2033)
10.1.2.1. By Product
10.1.2.2. By Channel
Type
10.1.2.3.
By
Country
10.1.2.3.1. UAE
10.1.2.3.2. Saudi
Arabia
10.1.2.3.3. South
Africa
10.1.2.3.4. Rest
of MEA
11. Latin America
Cashless Payments Market: Estimates
& Forecast Trend Analysis
11.1.
Latin
America Market Assessments & Key Findings
11.1.1.
Latin
America Cashless Payments Market Introduction
11.1.2.
Latin
America Cashless Payments Market Size Estimates and Forecast (US$ Billion) (2020
- 2033)
11.1.2.1. By Product
11.1.2.2. By Channel
Type
11.1.2.3.
By
Country
11.1.2.3.1. Brazil
11.1.2.3.2. Argentina
11.1.2.3.3. Mexico
11.1.2.3.4. Rest
of LATAM
12. Country Wise Market:
Introduction
13.
Competition
Landscape
13.1.
Global
Cashless Payments Market Product Mapping
13.2.
Global
Cashless Payments Market Concentration Analysis, by Leading Players /
Innovators / Emerging Players / New Entrants
13.3.
Global
Cashless Payments Market Tier Structure Analysis
13.4.
Global
Cashless Payments Market Concentration & Company Market Shares (%)
Analysis, 2024
14.
Company
Profiles
14.1.
Visa
14.1.1.
Company
Overview & Key Stats
14.1.2.
Financial
Performance & KPIs
14.1.3.
Product
Portfolio
14.1.4.
SWOT
Analysis
14.1.5.
Business
Strategy & Recent Developments
* Similar details would be provided for all the players
mentioned below
14.2. Mastercard
14.3. American
Express
14.4. PayPal
14.5. Square
14.6. Stripe
14.7. Apple
14.8. Google
14.9. Alipay
14.10. WeChat
Pay
14.11. Adyen
14.12. Fiserv
14.13. Worldpay
14.14. Global
Payments
14.15. PayU
14.16. Razorpay
14.17. Paytm
14.18. Mercado
Pago
14.19. TransferWise
14.20. Skrill
14.21. Others
15. Research
Methodology
15.1.
External
Transportations / Databases
15.2.
Internal
Proprietary Database
15.3.
Primary
Research
15.4.
Secondary
Research
15.5.
Assumptions
15.6.
Limitations
15.7.
Report
FAQs
16. Research
Findings & Conclusion
Our Research Methodology
"Insight without rigor is just noise."
We follow a comprehensive, multi-phase research framework designed to deliver accurate, strategic, and decision-ready intelligence. Our process integrates primary and secondary research , both quantitative and qualitative , along with dual modeling techniques ( top-down and bottom-up) and a final layer of validation through our proprietary in-house repository.
PRIMARY RESEARCH
Primary research captures real-time, firsthand insights from the market to understand behaviors, motivations, and emerging trends.
1. Quantitative Primary Research
Objective: Generate statistically significant data directly from market participants.
Approaches:- Structured surveys with customers, distributors, and field agents
- Mobile-based data collection for point-of-sale audits and usage behavior
- Phone-based interviews (CATI) for market sizing and product feedback
- Online polling around industry events and digital campaigns
- Purchase frequency by customer type
- Channel performance across geographies
- Feature demand by application or demographic
2. Qualitative Primary Research
Objective: Explore decision-making drivers, pain points, and market readiness.
Approaches:- In-depth interviews (IDIs) with executives, product managers, and key decision-makers
- Focus groups among end users and early adopters
- Site visits and observational research for consumer products
- Informal field-level discussions for regional and cultural nuances
SECONDARY RESEARCH
This phase helps establish a macro-to-micro understanding of market trends, size, regulation, and competitive dynamics, sourced from credible and public domain information.
1. Quantitative Secondary Research
Objective: Model market value and segment-level forecasts based on published data.
Sources include:- Financial reports and investor summaries
- Government trade data, customs records, and regulatory statistics
- Industry association publications and economic databases
- Channel performance and pricing data from marketplace listings
- Revenue splits, pricing trends, and CAGR estimates
- Supply-side capacity and volume tracking
- Investment analysis and funding benchmarks
2. Qualitative Secondary Research
Objective: Capture strategic direction, innovation signals, and behavioral trends.
Sources include:- Company announcements, roadmaps, and product pipelines
- Publicly available whitepapers, conference abstracts, and academic research
- Regulatory body publications and policy briefs
- Social and media sentiment scanning for early-stage shifts
- Strategic shifts in market positioning
- Unmet needs and white spaces
- Regulatory triggers and compliance impact

DUAL MODELING: TOP-DOWN + BOTTOM-UP
To ensure robust market estimation, we apply two complementary sizing approaches:
Top-Down Modeling:- Start with broader industry value (e.g., global or regional TAM)
- Apply filters by segment, geography, end-user, or use case
- Adjust with primary insights and validation benchmarks
- Ideal for investor-grade market scans and opportunity mapping
- Aggregate from the ground up using sales volumes, pricing, and unit economics
- Use internal modeling templates aligned with stakeholder data
- Incorporate distributor-level or region-specific inputs
- Most accurate for emerging segments and granular sub-markets
DATA VALIDATION: IN-HOUSE REPOSITORY
We close the loop with proprietary data intelligence built from ongoing projects, industry monitoring, and historical benchmarking. This repository includes:
- Multi-sector market and pricing models
- Key trendlines from past interviews and forecasts
- Benchmarked adoption rates, churn patterns, and ROI indicators
- Industry-specific deviation flags and cross-check logic
- Catches inconsistencies early
- Aligns projections across studies
- Enables consistent, high-trust deliverables