
Dynamic Positioning System Market Size and Forecast (2025–2033), Global and Regional Share, Trends, and Industry Analysis Report Coverage: By Equipment Class (Class 1, Class 2, Class 3), By System (Position Reference & Tracking System, Thruster & Propulsion System, Power Management System, DP Control System, Motion & Environment Sensors), By Fit (Line Fit, Retrofit), By Ship Type (Commercial Vessel, Military Vessel), and Geography
2026-01-30
Aerospace & Defense
Ekta Chaurasia (Team Lead)
Description
Dynamic Positioning System Market Overview
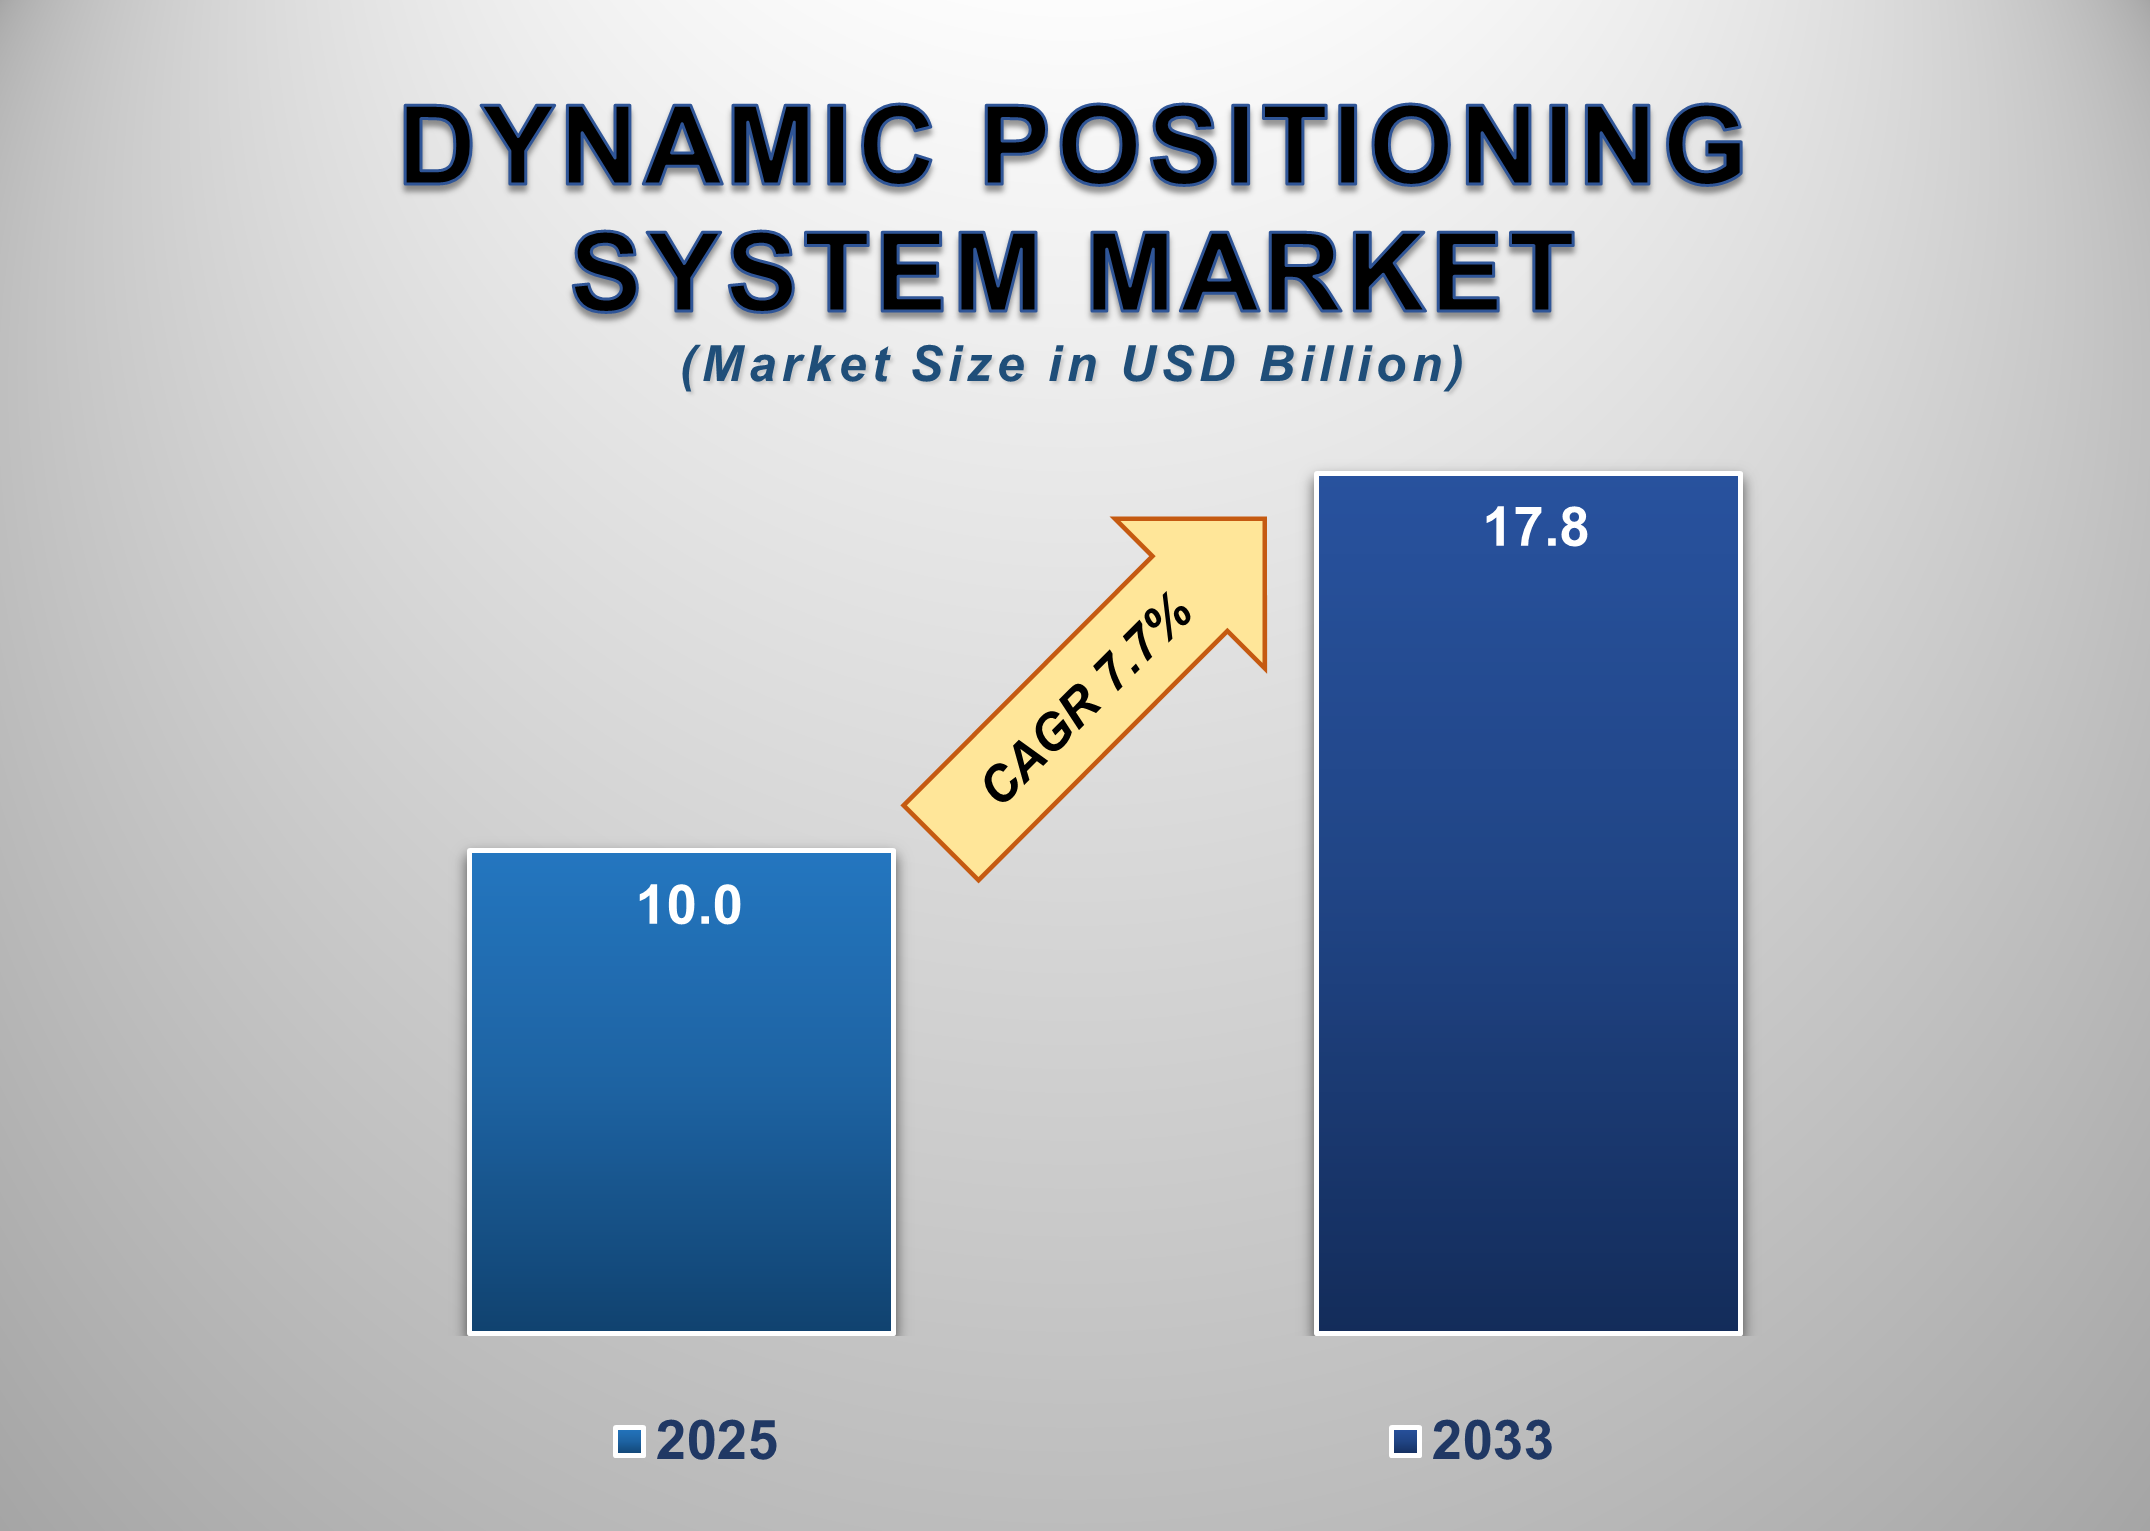
The global Dynamic Positioning System Market plays a critical role in modern maritime and offshore operations by enabling vessels to automatically maintain their position and heading using onboard propulsion and control systems. The market was valued at USD 10.0 billion in 2025 and is projected to reach USD 17.8 billion by 2033, growing at a CAGR of 7.7% during the forecast period. Dynamic positioning systems are extensively used in offshore oil & gas operations, subsea construction, offshore wind installation, dredging, research vessels, and military applications where precise station-keeping is essential. The increasing complexity of offshore projects, particularly in deepwater and ultra-deepwater environments, is driving demand for highly reliable and redundant DPS solutions.
Technological advancements in
sensors, control algorithms, power management, and propulsion integration are
enhancing system accuracy and operational safety. Moreover, the growing focus
on offshore renewable energy projects and naval fleet modernization is
expanding DPS adoption beyond traditional oil & gas applications. North
America currently dominates the market due to strong offshore activity and
naval investments, while Asia-Pacific is expected to witness the fastest
growth, supported by expanding offshore infrastructure and shipbuilding
capacity.
Dynamic Positioning
System Market Drivers and Opportunities
Rising
Offshore Oil, Gas, and Subsea Activities are Driving DPS Adoption
The increasing scale and complexity of offshore oil & gas
exploration and production activities are key drivers of the Dynamic
Positioning System Market. Modern offshore operations, including drilling,
pipe-laying, subsea construction, and maintenance, require vessels to maintain
precise positioning without anchoring, especially in deepwater environments
where anchoring is impractical. Dynamic positioning systems ensure operational
stability, safety, and efficiency during critical offshore tasks. As offshore
developments move into deeper and harsher environments, the demand for advanced
DPS with higher redundancy and fault tolerance is rising. Oil companies and
offshore service providers are investing in Class 2 and Class 3 systems to meet
stringent safety and regulatory requirements. Additionally, the resurgence of
offshore exploration projects in regions such as the Gulf of Mexico, North Sea,
and offshore Brazil is supporting sustained demand for DPS-equipped vessels,
reinforcing market growth.
Growth of Offshore Wind and Marine Infrastructure Projects Is
Accelerating Market Expansion
The rapid expansion of offshore wind energy projects is emerging
as a significant driver for the Dynamic Positioning System Market.
Installation, maintenance, and commissioning of offshore wind turbines require
vessels with high-precision positioning capabilities to ensure safe and
accurate operations. Dynamic positioning systems are increasingly deployed in
wind turbine installation vessels, cable-laying ships, and service operation
vessels. Governments worldwide are investing heavily in offshore renewable
energy to meet decarbonization targets, leading to a growing fleet of
specialized vessels equipped with DPS.
In addition to wind energy, marine infrastructure projects such as port construction, dredging, and subsea cable installation further contribute to DPS demand. As offshore infrastructure development accelerates globally, DPS adoption is expected to expand across multiple vessel types
Naval Modernization and Defense Applications Present
Long-Term Growth Opportunities
Naval and defense applications
represent a strong growth opportunity for the Dynamic Positioning System
Market. Modern naval vessels increasingly rely on DPS for precision maneuvering
during surveillance, research, rescue, and defense operations. Military vessels
require highly reliable and secure positioning systems that can operate under
complex environmental and operational conditions. Many countries are investing
in fleet modernization programs, incorporating advanced navigation and
positioning technologies to enhance operational capabilities. Class 2 and Class
3 DPS systems, with higher redundancy and fault tolerance, are particularly
favored for defense applications.
As geopolitical tensions and
maritime security concerns rise, defense spending on advanced naval platforms
is expected to increase, creating long-term opportunities for DPS manufacturers
and system integrators.
Dynamic Positioning
System Market Scope
|
Report Attributes |
Description |
|
Market Size in 2025 |
USD 10.0 Billion |
|
Market Forecast in 2033 |
USD 17.8 Billion |
|
CAGR % 2025-2033 |
7.7% |
|
Base Year |
2024 |
|
Historic Data |
2020-2024 |
|
Forecast Period |
2025-2033 |
|
Report USP |
Production, Consumption,
Company Share, Company Heatmap, Company Production Capacity, Growth Factor,
and more. |
|
Segments Covered |
●
By Equipment
Class, By System, By Fit, By Ship Type |
|
Regional Scope |
●
North America, ●
Europe, ●
APAC, ●
Latin America ●
Middle East and
Africa |
|
Country Scope |
1)
U.S. 2)
Canada 3)
Germany 4)
UK 5)
France 6)
Spain 7)
Italy 8)
Switzerland 9)
China 10)
Japan 11)
India 12)
Australia 13)
South Korea 14)
Brazil 15)
Mexico 16)
Argentina 17)
South Africa 18)
Saudi Arabia 19)
UAE |
Dynamic Positioning
System Market Report Segmentation Analysis
The Global Dynamic Positioning
System Market Industry Analysis is segmented by equipment class, system type,
fit type, ship type, and region.
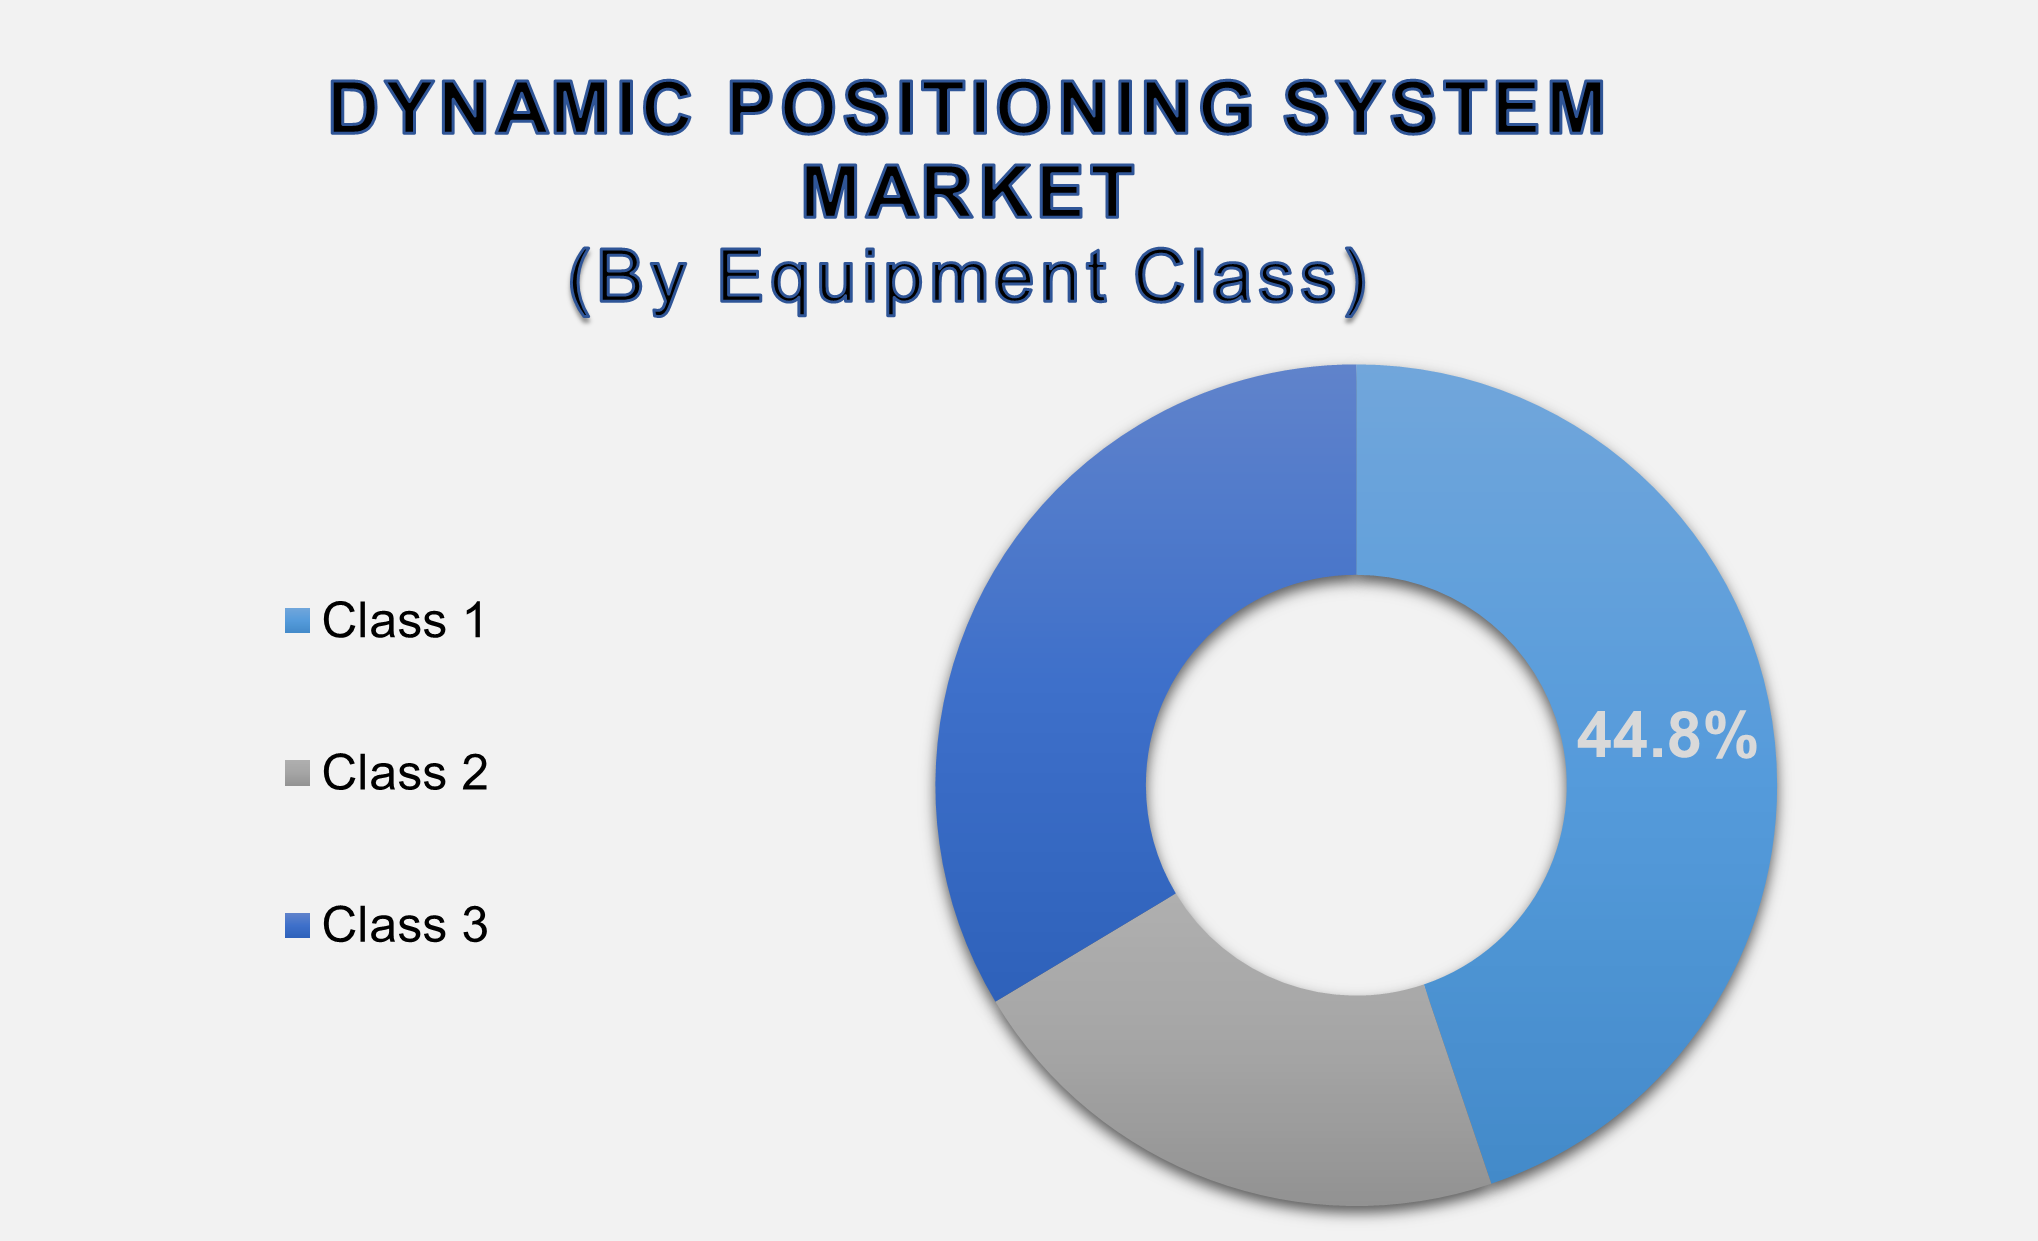
Class 1 Segment Accounted
for the Largest Market Share in the Global Dynamic Positioning System Market
The
Class 1 segment accounted for the largest market share at 44.8%, driven by its
widespread adoption across commercial vessels and less complex offshore
operations. Class 1 systems offer basic redundancy and are suitable for
applications where loss of position does not pose immediate safety risks.
These systems are commonly installed on supply vessels, research ships, and light offshore service vessels. Their relatively lower cost, simpler architecture, and sufficient performance for routine operations make them attractive for commercial operators. As demand for DPS expands beyond high-risk offshore operations into broader commercial maritime activities, Class 1 systems continue to dominate overall installations.
Position Reference &
Tracking System Segment Holds a Significant Share Due to Accuracy Requirements
The
position reference & tracking system segment holds a significant share, as
accurate position data is fundamental to dynamic positioning performance. These
systems integrate GPS, acoustic positioning, laser-based reference systems, and
gyrocompasses to provide real-time vessel location and movement data.
Advancements in sensor fusion and redundancy are enhancing system reliability,
particularly in challenging environmental conditions. As offshore operations
demand higher precision and safety, investments in advanced position reference
technologies continue to grow.
Line Fit Segment expected
to lead due to Newbuild Vessel Demand
The
line fit segment dominates the market, driven by increasing installation of DPS
during vessel construction. Newbuild offshore vessels, wind installation ships,
and naval platforms are increasingly designed with integrated DPS solutions to
optimize performance and compliance with regulatory standards. Line fit
installations offer better system integration, lower lifecycle costs, and
improved operational efficiency compared to retrofitting. Growth in global
shipbuilding activity, particularly in the Asia-Pacific
region, continues to support this segment’s dominance.
The following segments are
part of an in-depth analysis of the global Dynamic Positioning System market:
|
Market Segments |
|
|
By Equipment
Class |
●
Class 1 ●
Class 2 ●
Class 3 |
|
By System |
●
Position Reference
& Tracking System ●
Thruster &
Propulsion System ●
Power Management
System ●
DP Control System ●
Motion &
Environment Sensors |
|
By Fit |
●
Line Fit ●
Retrofit |
|
By Ship Type |
●
Commercial Vessel ●
Military Vessel |
Dynamic Positioning
System Market Share Analysis by Region
North America is
anticipated to hold the biggest portion of the Dynamic Positioning System
Market globally throughout the forecast period.
North America dominates the
global Dynamic Positioning System Market with 49.9% share, supported by
extensive offshore oil & gas activity, advanced naval fleets, and the
strong presence of leading DPS manufacturers. The Gulf of Mexico remains a
major hub for DPS-equipped vessels.
Asia-Pacific is expected to grow
at the fastest CAGR, driven by expanding offshore wind projects, rising
shipbuilding capacity, and increasing investments in offshore energy
infrastructure in countries such as China, South Korea, and India. Europe
maintains a strong position due to offshore wind development and North Sea
operations.
Dynamic Positioning
System Market Competition Landscape Analysis
The Dynamic Positioning System
Market is highly competitive, characterized by continuous technological
innovation, system integration expertise, and long-term service agreements. Key
players focus on enhancing system redundancy, cybersecurity, and automation to
meet evolving offshore and defense requirements.
Global Dynamic
Positioning System Market Recent Developments News:
- In March 2025,
Sonardyne launched SPRINT‑Nav
DP, a compact hybrid inertial and Doppler Velocity Log (DVL) positioning
system for dynamic positioning (DP) in shallow waters up to 230 meters.
Designed for GNSS‑denied
environments, the factory‑calibrated
system supports precise station‑keeping
without external references, targeting offshore wind, nearshore
construction, and subsea operations.
The Global Dynamic Positioning System Market Is Dominated by a Few Large Companies, such as
●
Kongsberg Gruppen
●
Wärtsilä
●
Rolls-Royce
●
GE
●
ABB
●
Marine Technologies
LLC
●
Navis Engineering Oy
●
Praxis Automation
Technology
●
Norr Systems
●
MTU Friedrichshafen
●
L-3 Communications
●
C-MAR
●
Sonardyne
●
JRC
●
iXblue
●
Thrustmaster of Texas
●
Ulstein
●
Wingd
●
Schottel
●
Brunvoll
● Others
Frequently Asked Questions
Ekta Chaurasia (Team Lead)
Ekta Chaurasia is a highly experienced Team Lead at M2Square Consultancy with over 7 years of expertise in market research, strategic consulting, competitive benchmarking, and business intelligence solutions. She specializes in ICT, semiconductors & electronics, automotive & transportation, and industrial machinery markets.
She leads end-to-end global research projects focused on market trends, industry analysis, growth forecasting, customer insights, and strategic decision-making. Known for her analytical leadership and industry expertise, Ekta helps businesses uncover growth opportunities, evaluate competitive landscapes, and stay ahead in rapidly evolving markets through accurate and insight-driven research.
1. Global Dynamic Positioning
System Market Introduction and Market Overview
1.1.
Objectives
of the Study
1.2.
Global
Dynamic Positioning System Market Scope and Market Estimation
1.2.1.Global Dynamic Positioning
System Overall Market Size (US$ Bn), Market CAGR (%), Market forecast (2025 - 2033)
1.2.2.Global Dynamic Positioning
System Market Revenue Share (%) and Growth Rate (Y-o-Y) from 2020 - 2033
1.3.
Market
Segmentation
1.3.1.Equipment Class of Global Dynamic
Positioning System Market
1.3.2.System of Global Dynamic
Positioning System Market
1.3.3.Fit of Global Dynamic
Positioning System Market
1.3.4.Ship Type of Global Dynamic
Positioning System Market
1.3.5.Region of Global Dynamic
Positioning System Market
2. Executive
Summary
2.1.
Demand
Side Trends
2.2.
Key
Market Trends
2.3.
Market
Demand (US$ Bn) Analysis 2020 – 2024 and Forecast, 2025 – 2033
2.4.
Demand
and Opportunity Assessment
2.5.
Key
Developments
2.6.
Overview
of Tariff, Regulatory Landscape and Standards
2.7.
Market
Entry Strategies
2.8.
Market
Dynamics
2.8.1.Drivers
2.8.2.Limitations
2.8.3.Opportunities
2.8.4.Impact Analysis of Drivers
and Restraints
2.9.
Porter’s
Five Forces Analysis
2.10.
PEST
Analysis
3. Global
Dynamic Positioning System Market
Estimates & Historical Trend Analysis (2020 - 2024)
4. Global
Dynamic Positioning System Market
Estimates & Forecast Trend Analysis, by Equipment
Class
4.1.
Global
Dynamic Positioning System Market Revenue (US$ Bn) Estimates and Forecasts, by Equipment
Class, 2020 - 2033
4.1.1.Class 1
4.1.2.Class 2
4.1.3.Class 3
5. Global
Dynamic Positioning System Market
Estimates & Forecast Trend Analysis, by System
5.1.
Global
Dynamic Positioning System Market Revenue (US$ Bn) Estimates and Forecasts, by System,
2020 - 2033
5.1.1.Position Reference &
Tracking System
5.1.2.Thruster & Propulsion
System
5.1.3.Power Management System
5.1.4.DP Control System
5.1.5.Motion & Environment
Sensors
6. Global
Dynamic Positioning System Market
Estimates & Forecast Trend Analysis, by Fit
6.1.
Global
Dynamic Positioning System Market Revenue (US$ Bn) Estimates and Forecasts, by Fit,
2020 - 2033
6.1.1.Line Fit
6.1.2.Retrofit
7. Global
Dynamic Positioning System Market
Estimates & Forecast Trend Analysis, by Ship Type
7.1.
Global
Dynamic Positioning System Market Revenue (US$ Bn) Estimates and Forecasts, by Ship
Type, 2020 - 2033
7.1.1.Commercial Vessel
7.1.2.Military Vessel
8. Global
Dynamic Positioning System Market
Estimates & Forecast Trend Analysis, by Region
8.1.
Global
Dynamic Positioning System Market Revenue (US$ Bn) Estimates and Forecasts, by Region,
2020 - 2033
8.1.1.North America
8.1.2.Europe
8.1.3.Asia Pacific
8.1.4.Middle East & Africa
8.1.5.Latin America
9. North America Dynamic
Positioning System Market: Estimates
& Forecast Trend Analysis
9.1.
North
America Dynamic Positioning System Market Assessments & Key Findings
9.1.1.North America Dynamic
Positioning System Market Introduction
9.1.2.North America Dynamic
Positioning System Market Size Estimates and Forecast (US$ Billion) (2020 - 2033)
9.1.2.1. By Equipment
Class
9.1.2.2. By System
9.1.2.3. By Fit
9.1.2.4. By Ship Type
9.1.2.5.
By
Country
9.1.2.5.1. The U.S.
9.1.2.5.2. Canada
10. Europe Dynamic
Positioning System Market: Estimates
& Forecast Trend Analysis
10.1.
Europe
Dynamic Positioning System Market Assessments & Key Findings
10.1.1.
Europe
Dynamic Positioning System Market Introduction
10.1.2.
Europe
Dynamic Positioning System Market Size Estimates and Forecast (US$ Billion) (2020
- 2033)
10.1.2.1. By Equipment
Class
10.1.2.2. By System
10.1.2.3. By Fit
10.1.2.4. By Ship Type
10.1.2.5.
By
Country
10.1.2.5.1.
Germany
10.1.2.5.2.
Italy
10.1.2.5.3.
U.K.
10.1.2.5.4.
France
10.1.2.5.5.
Spain
10.1.2.5.6.
Switzerland
10.1.2.5.7. Rest
of Europe
11. Asia Pacific Dynamic
Positioning System Market: Estimates
& Forecast Trend Analysis
11.1.
Asia
Pacific Market Assessments & Key Findings
11.1.1.
Asia
Pacific Dynamic Positioning System Market Introduction
11.1.2.
Asia
Pacific Dynamic Positioning System Market Size Estimates and Forecast (US$ Billion)
(2020 - 2033)
11.1.2.1. By Equipment
Class
11.1.2.2. By System
11.1.2.3. By Fit
11.1.2.4. By Ship Type
11.1.2.5.
By
Country
11.1.2.5.1. China
11.1.2.5.2. Japan
11.1.2.5.3. India
11.1.2.5.4. Australia
11.1.2.5.5. South Korea
11.1.2.5.6. Rest of Asia Pacific
12. Middle East & Africa Dynamic
Positioning System Market: Estimates
& Forecast Trend Analysis
12.1.
Middle
East & Africa Market Assessments & Key Findings
12.1.1.
Middle East & Africa Dynamic Positioning System Market
Introduction
12.1.2.
Middle East & Africa Dynamic Positioning System Market
Size Estimates and Forecast (US$ Billion) (2020 - 2033)
12.1.2.1. By Equipment
Class
12.1.2.2. By System
12.1.2.3. By Fit
12.1.2.4. By Ship Type
12.1.2.5.
By
Country
12.1.2.5.1. UAE
12.1.2.5.2. Saudi
Arabia
12.1.2.5.3. South
Africa
12.1.2.5.4. Rest
of MEA
13. Latin America
Dynamic Positioning System Market:
Estimates & Forecast Trend Analysis
13.1.
Latin
America Market Assessments & Key Findings
13.1.1.
Latin
America Dynamic Positioning System Market Introduction
13.1.2.
Latin
America Dynamic Positioning System Market Size Estimates and Forecast (US$ Billion)
(2020 - 2033)
13.1.2.1. By Equipment
Class
13.1.2.2. By System
13.1.2.3. By Fit
13.1.2.4. By Ship Type
13.1.2.5.
By
Country
13.1.2.5.1. Brazil
13.1.2.5.2. Argentina
13.1.2.5.3. Mexico
13.1.2.5.4. Rest
of LATAM
14. Country Wise Market:
Introduction
15.
Competition
Landscape
15.1.
Global
Dynamic Positioning System Market Product Mapping
15.2.
Global
Dynamic Positioning System Market Concentration Analysis, by Leading Players /
Innovators / Emerging Players / New Entrants
15.3.
Global
Dynamic Positioning System Market Tier Structure Analysis
15.4.
Global
Dynamic Positioning System Market Concentration & Company Market Shares (%)
Analysis, 2024
16.
Company
Profiles
16.1.
Kongsberg Gruppen
16.1.1.
Company
Overview & Key Stats
16.1.2.
Financial
Performance & KPIs
16.1.3.
Product
Portfolio
16.1.4.
SWOT
Analysis
16.1.5.
Business
Strategy & Recent Developments
* Similar details would be provided for all the players
mentioned below
16.2. Wärtsilä
16.3. Rolls-Royce
16.4. GE
16.5. ABB
16.6. Marine
Technologies LLC
16.7. Navis
Engineering Oy
16.8. Praxis
Automation Technology
16.9. Norr
Systems
16.10. MTU
Friedrichshafen
16.11. L-3
Communications
16.12. C-MAR
16.13. Sonardyne
16.14. JRC
16.15. iXblue
16.16. Thrustmaster
of Texas
16.17. Ulstein
16.18. Wingd
16.19. Schottel
16.20. Brunvoll
16.21. Others
17. Research
Methodology
17.1.
External
Transportations / Databases
17.2.
Internal
Proprietary Database
17.3.
Primary
Research
17.4.
Secondary
Research
17.5.
Assumptions
17.6.
Limitations
17.7.
Report
FAQs
18. Research
Findings & Conclusion
Our Research Methodology
"Insight without rigor is just noise."
We follow a comprehensive, multi-phase research framework designed to deliver accurate, strategic, and decision-ready intelligence. Our process integrates primary and secondary research , both quantitative and qualitative , along with dual modeling techniques ( top-down and bottom-up) and a final layer of validation through our proprietary in-house repository.
PRIMARY RESEARCH
Primary research captures real-time, firsthand insights from the market to understand behaviors, motivations, and emerging trends.
1. Quantitative Primary Research
Objective: Generate statistically significant data directly from market participants.
Approaches:- Structured surveys with customers, distributors, and field agents
- Mobile-based data collection for point-of-sale audits and usage behavior
- Phone-based interviews (CATI) for market sizing and product feedback
- Online polling around industry events and digital campaigns
- Purchase frequency by customer type
- Channel performance across geographies
- Feature demand by application or demographic
2. Qualitative Primary Research
Objective: Explore decision-making drivers, pain points, and market readiness.
Approaches:- In-depth interviews (IDIs) with executives, product managers, and key decision-makers
- Focus groups among end users and early adopters
- Site visits and observational research for consumer products
- Informal field-level discussions for regional and cultural nuances
SECONDARY RESEARCH
This phase helps establish a macro-to-micro understanding of market trends, size, regulation, and competitive dynamics, sourced from credible and public domain information.
1. Quantitative Secondary Research
Objective: Model market value and segment-level forecasts based on published data.
Sources include:- Financial reports and investor summaries
- Government trade data, customs records, and regulatory statistics
- Industry association publications and economic databases
- Channel performance and pricing data from marketplace listings
- Revenue splits, pricing trends, and CAGR estimates
- Supply-side capacity and volume tracking
- Investment analysis and funding benchmarks
2. Qualitative Secondary Research
Objective: Capture strategic direction, innovation signals, and behavioral trends.
Sources include:- Company announcements, roadmaps, and product pipelines
- Publicly available whitepapers, conference abstracts, and academic research
- Regulatory body publications and policy briefs
- Social and media sentiment scanning for early-stage shifts
- Strategic shifts in market positioning
- Unmet needs and white spaces
- Regulatory triggers and compliance impact

DUAL MODELING: TOP-DOWN + BOTTOM-UP
To ensure robust market estimation, we apply two complementary sizing approaches:
Top-Down Modeling:- Start with broader industry value (e.g., global or regional TAM)
- Apply filters by segment, geography, end-user, or use case
- Adjust with primary insights and validation benchmarks
- Ideal for investor-grade market scans and opportunity mapping
- Aggregate from the ground up using sales volumes, pricing, and unit economics
- Use internal modeling templates aligned with stakeholder data
- Incorporate distributor-level or region-specific inputs
- Most accurate for emerging segments and granular sub-markets
DATA VALIDATION: IN-HOUSE REPOSITORY
We close the loop with proprietary data intelligence built from ongoing projects, industry monitoring, and historical benchmarking. This repository includes:
- Multi-sector market and pricing models
- Key trendlines from past interviews and forecasts
- Benchmarked adoption rates, churn patterns, and ROI indicators
- Industry-specific deviation flags and cross-check logic
- Catches inconsistencies early
- Aligns projections across studies
- Enables consistent, high-trust deliverables