
Electric Bus Market Size And Forecast (2020 - 2033), Global And Regional Growth, Trend, Share And Industry Analysis Report Coverage: By Propulsion Type (Battery Electric Vehicle (BEV), Plug-In Hybrid Electric Vehicle (PHEV), Fuel Cell Electric Vehicle (FCEV), By Battery Type (Lithium Nickel Manganese Cobalt Oxide, Lithium Iron Phosphate), By Application (Intercity, Intracity) By End Use (Public, Private) And Geography
2025-10-31
Automotive & Transportation (Mobility)
Ekta Chaurasia (Team Lead)
Description
Electric Bus Market Overview
The global Electric Bus Market Size is projected to grow significantly from 2025 to 2033, driven by the ongoing shift toward sustainable urban mobility and stringent government policies aimed at reducing vehicular emissions. By 2025, the market is expected to reach approximately USD 31.4 billion, expanding further to about USD 88.8 billion by 2033, reflecting a CAGR of 14.3% over the forecast period.

Electric buses serve as a
cornerstone of eco-friendly public transportation by offering zero emissions
and lower operational costs. Rising environmental concerns over traditional
fossil-fueled vehicles are a primary growth driver, with governments worldwide
providing subsidies, tax incentives, and regulatory mandates to accelerate the adoption
of electric buses. Additionally, escalating fuel costs and the need for
energy-efficient transit solutions are motivating agencies to replace
conventional buses with electric alternatives. Advancements in charging
infrastructure, battery swapping systems, and fast-charging technologies are
further fueling market expansion.
Electric Bus Market
Drivers and Opportunities
Growing urbanization and public transit demand are
anticipated to lift the electric bus market during the forecast period
The fast pace of global
urbanization has substantially raised the stakes for efficient and sustainable
public transportation networks. Cities are witnessing an unprecedented growth
in population density, which is resulting in higher traffic congestion,
increased pollution, and increased burden on existing transport infrastructure.
Electric buses provide an eco-friendly, noiseless, and cost-effective mode of
addressing urban mobility needs. As the number of people flowing into the
cities is on the rise, municipalities are adopting smart transport networks to
manage increasing commuter traffic, and electric buses are becoming an
essential element of these networks. These buses not only cut operational cost
because of reduced fuel and maintenance expenditure but are also in line with
the environmental aspirations of the city. Moreover, city planning is becoming
increasingly oriented toward enhancing public transit to decrease the
dependency on private transport, and the role of electric buses is at the forefront
of these endeavors. The flexibility and scalability of the range of electric
buses are well-suited to different route lengths and city structures.
Furthermore, real-time data monitoring and management features are enhancing
the performance of services, which is further adding to the prospects of
adoption. As populations in the city are anticipated to grow extensively in the
decades to come, the demand for the role of electric buses in future-proofed
city transit networks is expected to rise, positioning urbanization as an
important growth catalyst.
Government policies and emission regulations are vital
drivers for influencing the growth of the global electric bus market
Government regulations and
emission standards are crucial drivers for the growth of the global market for
electric buses. Across the globe, governments and local governments are
implementing strict standards on emissions as an effort to reduce increasing
levels of air pollution and fulfill environmental obligations under global
treaties such as the Paris Climate Agreement. The regulations are forcing the
replacement of diesel buses with electric versions, which emit zero tailpipe
pollutants. For example, China’s New Energy Vehicle (NEV) policy and the Clean
Vehicles Directive in Europe strongly accelerated the demand for electric
buses. Moreover, financial subsidies, which are in the form of cash subsidies,
discounts on registration fees, and tax relief, are motivating public transport
providers to switch fleets. Besides environmental requirements, governments are
providing the industry with low-interest loans and investment in the expansion
of infrastructure, mainly the establishment of charging points for electric
vehicles (EVs). Cities with poor air quality are also implementing requirements
where the operating public transit fleets need to include a proportion of
transit vehicles as electric, thereby giving rise to a strong demand. These
policies are not only increasing demand but also driving innovation as Original
Equipment Manufacturers (OEMs) are trying to achieve compliance with changing
standards. As governments continue to impose tightening standards, the market
is poised to witness sustained growth, with public policy being an integral
driver in the anticipated market growth.
Public-Private Partnerships (PPPs) for fleet electrification are
poised to create significant opportunities in the global electric bus market
The growth of public-private
partnerships (PPPs) is opening opportunities for large-scale growth in the
global market for electric buses. As governments seek to green public transit
fleets to reach environmental needs, scant public funds and technical capacity
frequently become an impediment. PPPs provide municipal and regional
governments with the ability to partner with private sector firms to
co-develop, finance, and operate networks of electric buses. These arrangements
can extend to the procurement of vehicles, infrastructure rollout, maintenance
services, and energy supply management. For instance, private sector firms
specializing in fleet management or green energy are partnering with transit
agencies to deliver integrated packages that guarantee low-carbon operation.
These collaborations also de-risk investment by spreading responsibility and
ensuring that ventures take advantage of private sector innovation and prowess
for efficiency. In addition, these arrangements can spur market take-up by
lowering the upfront capital burden on transport agencies. PPP models are being
increasingly backed by climate funds and international development banks,
further underpinning the trend. As global cities implement climate action
plans, PPPs will play the key role in transitioning to large-scale populations
of electric buses and related infrastructure. The success of these
collaborations in pilot areas is acting as a template for replication and is
therefore one of the key growth opportunities in the forecasted market.
Electric Bus Market Scope
|
Report Attributes |
Description |
|
Market Size in 2025 |
USD 31.4 Billion |
|
Market Forecast in 2033 |
USD 88.8 Billion |
|
CAGR % 2025-2033 |
14.3% |
|
Base Year |
2024 |
|
Historic Data |
2020-2024 |
|
Forecast Period |
2025-2033 |
|
Report USP |
Production, Consumption, company share, company heatmap, company
production capacity, growth factors and more |
|
Segments Covered |
●
By Propulsion Type ●
By Battery Type ●
By Application ●
By End Use |
|
Regional Scope |
●
North America, ●
Europe, ●
APAC, ●
Latin America ●
Middle East and Africa |
|
Country Scope |
1)
U.S. 2)
Canada 3)
U.K. 4)
Germany 5)
France 6)
Italy 7)
Spain 8)
Russia 9)
China 10)
India 11)
Japan 12)
South Korea 13)
Australia 14)
Mexico 15)
Brazil 16)
Argentina 17)
Saudi Arabia 18)
UAE 19) South Africa |
Electric Bus Market Report Segmentation Analysis
The Global Electric Bus Market
industry analysis is segmented by Propulsion Type, by Battery Type, by
Application, by End Use, and by Region.
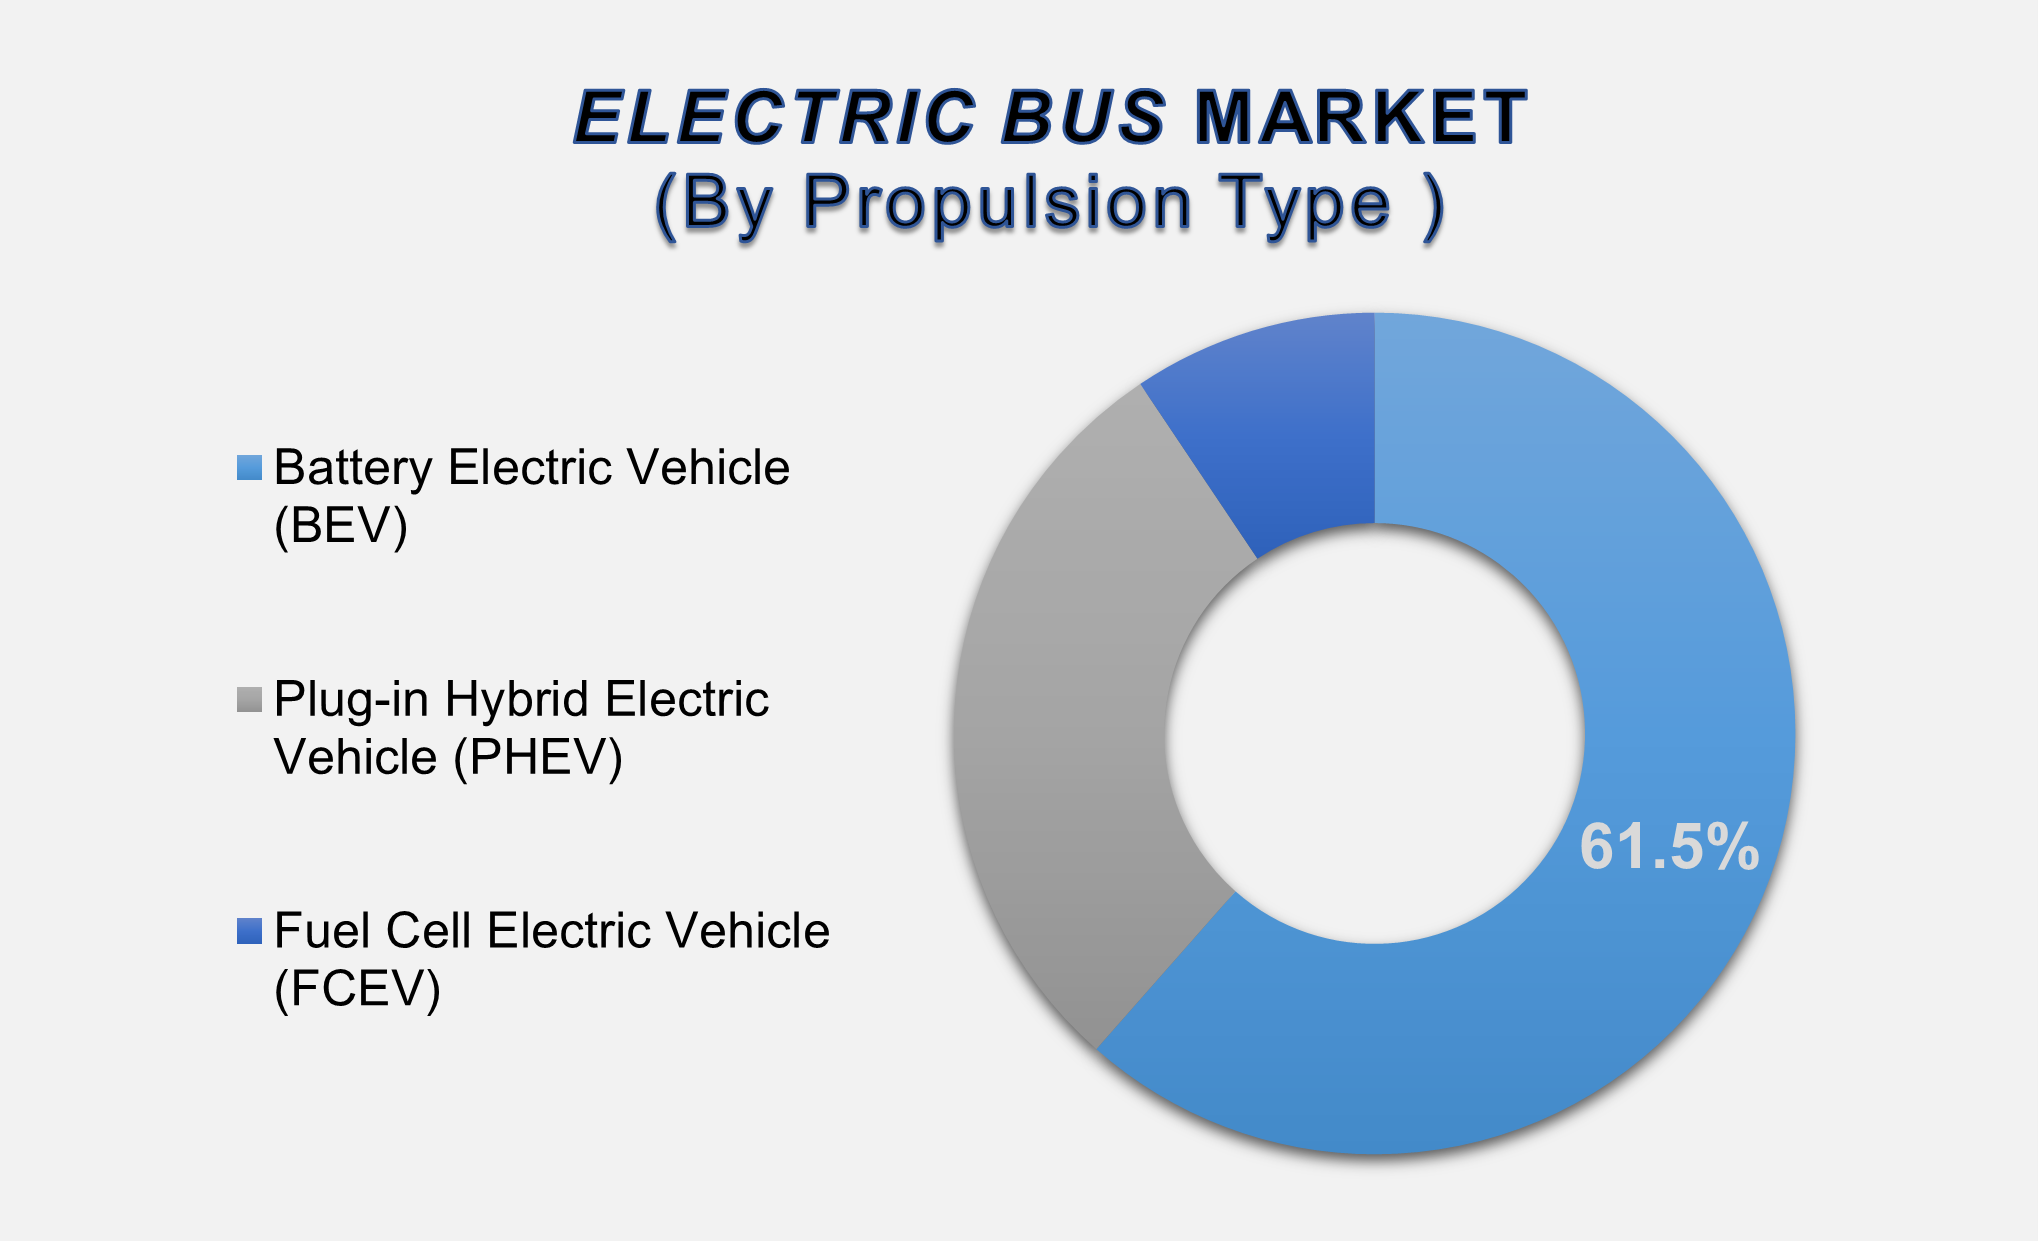
The Battery Electric Vehicle (BEV) segment is anticipated to
hold the highest share of the global electric bus market during the projected
timeframe
Based on the Propulsion Type market is segmented into Battery Electric Vehicle (BEV), Plug-in Hybrid Electric Vehicle (PHEV), and Fuel Cell Electric Vehicle (FCEV). The market is led by the Battery Electric Vehicle (BEV) during the forecast period. BEVs are powered by electricity alone and do not emit tailpipe exhaust, fitting well within global sustainability agendas and city clean-air programs. BEV acquisition is heavily subsidized by governments in various regions through cash incentives, tax credits, and subsidies, particularly for public transit. BEVs also enjoy the benefit of an existing charging network and lower maintenance costs compared to PHEVs and FCEVs. BEVs are most in demand for metropolitan applications because of the quiet operation, improved energy economy, and enhanced battery technologies that provide greater ranges and better charging rates.
The Lithium Iron Phosphate segment dominated the market in
2024 and is predicted to grow at the highest CAGR over the forecast period
By battery type, the market is
categorized into Lithium Nickel Manganese Cobalt Oxide (NMC) and Lithium Iron
Phosphate (LFP). The LFP battery segment in 2024 became the top pick and is set
to advance at the highest CAGR during the forecast period. The LFP batteries
are most commonly known for excellent thermal and chemical stability, long
lifespan, and safety features. These features render them highly suitable for
electric buses, whose frequent use demands high dependability and longevity.
The cost-effectiveness is also delivered through the absence of costly cobalt
and nickel metals, making them an affordable option for mass transit networks.
The concern for better fire safety and battery lifespan is further fueling the
growth of LFP through various global marketplaces.
The Intracity segment is predicted to grow at the highest
CAGR over the forecast period
Based on application, the global
electric bus market is segmented into Intercity and Intracity services. The
Intracity segment is anticipated to grow at the highest CAGR in the forecast
period, driven by the fast pace of electricalization of public transportation
networks within the city. Governments and municipal authorities are both
investing in fleets of electric buses to mitigate traffic-related emissions,
decongest the city, and align with climate requirements. Moreover, increasing
environmental consciousness among the public and government regulations on
clean city transport are further fueling the demand for electric intracity
buses.
The Public segment is expected to dominate the market during
the forecast period.
Based on end use, the market is
divided into the Public and Private sectors. The Public segment is expected to
dominate the market during the forecast period, accounting for the largest
share in terms of both volume and value. Public transportation authorities
across the globe are leading the transition from conventional diesel fleets to
electric alternatives to combat air pollution and reduce greenhouse gas
emissions. Governments are implementing regulatory mandates, offering funding
programs, and rolling out city-level initiatives that prioritize electric bus
deployment in public transit systems. Public agencies often operate large
fleets, which allows for economies of scale and greater impact in emission
reduction. Given the environmental urgency and public demand for cleaner
transportation options, the public end-use segment is set to drive major market
trends, contributing significantly to the forecasted expansion of the global
electric bus market.
The following segments are part of an in-depth analysis of the global
electric bus market:
|
Market Segments |
|
|
By Propulsion Type |
●
Battery Electric
Vehicle (BEV) ●
Plug-in Hybrid
Electric Vehicle (PHEV) ●
Fuel Cell Electric
Vehicle (FCEV) |
|
By Battery Type |
●
Lithium Nickel
Manganese Cobalt Oxide ●
Lithium Iron
Phosphate |
|
By Application |
●
Intercity ●
Intracity |
|
By End Use |
●
Public ●
Private |
Electric Bus Market Share
Analysis by Region
North America is
projected to hold the largest share of the global electric bus market over the
forecast period
North America led the global
market for electric buses in 2024 at an astonishing 47.2% market share and is
predicted to lead the market during the forecasting period. The massive market
is largely powered by extensive government subsidies, large-scale funding of
clean public transportation, and strict emission controls aimed at minimizing
carbon footprints in large metropolitan areas. The U.S. and Canadian
governments are actively using electric buses as part of green mobility
solutions, backed by incentives such as subsidies, tax credits, and grants
through the U.S. Bipartisan Infrastructure Law and the Canadian Zero Emission
Transit Fund. Moreover, the presence of global leading electric bus
manufacturers, rapid growth in the installation of advanced charging
facilities, as well as the increasing trend of fleet electrization in school
and public transit areas, are fuelling regional market growth. Public transit
agencies are collaborating with technology vendors and automotive titans to
increase rollout and enable cost-effective operation in metropolitan areas.
Further, the Asia Pacific is
expected to achieve the highest CAGR during the forecast period. The region's
accelerated urbanization, huge population base, and favorable government
policies, particularly in China and India, are driving demand. Aggressive
greenhouse gas reductions and city-wide transit electromobilization plans are
set to position Asia Pacific as the principal driver of future growth of the
electric bus market.
Electric Bus Market
Competition Landscape Analysis
The Global Electric Bus Market Is
Poised for Significant Growth, With Key Players Investing Heavily in Technology
and Infrastructure. These Companies Are Actively Engaged in Research and
Development, Strategic Partnerships, And Large-Scale Project Implementations to
Enhance Their Market Positions.
Global Electric Bus
Market Recent Developments News:
●
In March 2024, Volvo
Buses launched its BZR Electric electromobility platform, designed to support
urban, intercity, and commuter transport operations. The platform offers
multiple configurations to maximize profitability and sustainability for global
operators, aligning with the rising demand for electric mobility solutions.
Building on the success of Volvo’s low-floor electric buses—already in use
across more than 25 countries—the BZR Electric platform reinforces the
company’s commitment to advancing zero-emission public transportation. This
launch underscores Volvo Buses' leadership in delivering scalable, efficient,
and eco-friendly transit solutions for the future.
●
In May 2024, Yutong
achieved a milestone in China's electric vehicle export market by delivering 46
battery-electric apron buses to Spain. These zero-emission buses will serve 15
major Spanish airports, aligning with the country’s broader sustainability
objectives for airport infrastructure. Marking the largest order of its kind
for China, the deal underscores Yutong’s expanding footprint in Europe, where
its cutting-edge electric buses are already operational at over 70 airports,
including major hubs such as Madrid, Barcelona, and Rome.
The Global Electric Bus Market is dominated by a few large
companies, such as
●
BYD Company Limited
●
AB Volvo
●
Proterra
●
MAN
●
Nissan Motor Corporation
●
Ashok Leyland Limited
●
Daimler Truck AG
●
Zhengzhou Yutong Bus Co. Ltd.
●
TATA Motors Limited
●
Hyundai Motor Company
● Others
Frequently Asked Questions
Ekta Chaurasia (Team Lead)
Ekta Chaurasia is a highly experienced Team Lead at M2Square Consultancy with over 7 years of expertise in market research, strategic consulting, competitive benchmarking, and business intelligence solutions. She specializes in ICT, semiconductors & electronics, automotive & transportation, and industrial machinery markets.
She leads end-to-end global research projects focused on market trends, industry analysis, growth forecasting, customer insights, and strategic decision-making. Known for her analytical leadership and industry expertise, Ekta helps businesses uncover growth opportunities, evaluate competitive landscapes, and stay ahead in rapidly evolving markets through accurate and insight-driven research.
1.
Global
Electric Bus Market Introduction and Market Overview
1.1. Objectives of the Study
1.2. Global Electric Bus Market Scope
and Market Estimation
1.2.1.Global Electric Bus Overall
Market Size (US$ Bn), Market CAGR (%), Market forecast (2025 - 2033)
1.2.2.Global Electric Bus Market
Revenue Share (%) and Growth Rate (Y-o-Y) from 2020 - 2033
1.3. Market Segmentation
1.3.1.Propulsion Type of Global Electric
Bus Market
1.3.2.Battery Type of Global Electric
Bus Market
1.3.3.Application of Global Electric
Bus Market
1.3.4.End-use of Global Electric Bus
Market
1.3.5.Region of Global Electric Bus
Market
2.
Executive Summary
2.1. Demand Side Trends
2.2. Key Market Trends
2.3. Market Demand (US$ Bn) Analysis
2020 – 2024 and Forecast, 2025 – 2033
2.4. Demand and Opportunity
Assessment
2.5. Market Dynamics
2.5.1.Drivers
2.5.2.Limitations
2.5.3.Opportunities
2.5.4.Impact Analysis of Drivers and
Restraints
2.6. Key Product/Brand Analysis
2.7. Technological Advancements
2.8. Key Developments
2.9. Porter’s Five Forces Analysis
2.9.1.Bargaining Power of Suppliers
2.9.2.Bargaining Power of Buyers
2.9.3.Threat of Substitutes
2.9.4.Threat of New Entrants
2.9.5.Competitive Rivalry
2.10. PEST Analysis
2.10.1. Political Factors
2.10.2. Economic Factors
2.10.3. Social Factors
2.10.4. Technology Factors
2.11. Insights on Cost-effectiveness
of Electric Bus
2.12. Key Regulation
3.
Global Electric Bus Market Estimates & Historical Trend Analysis (2020 - 2024)
4.
Global Electric Bus Market Estimates & Forecast Trend Analysis, by
Propulsion Type
4.1. Global Electric Bus Market
Revenue (US$ Bn) Estimates and Forecasts, by Propulsion Type, 2020 - 2033
4.1.1.Battery Electric Vehicle (BEV)
4.1.2.Plug-in Hybrid Electric Vehicle
(PHEV)
4.1.3.Fuel Cell Electric Vehicle
(FCEV)
5.
Global Electric Bus Market Estimates & Forecast Trend Analysis, by
Battery Type
5.1. Global Electric Bus Market
Revenue (US$ Bn) Estimates and Forecasts, by Battery Type, 2020 - 2033
5.1.1.Lithium Nickel Manganese Cobalt
Oxide
5.1.2.Lithium Iron Phosphate
6.
Global Electric Bus Market Estimates & Forecast Trend Analysis, by
Application
6.1. Global Electric Bus Market
Revenue (US$ Bn) Estimates and Forecasts, by Application, 2020 - 2033
6.1.1.Intercity
6.1.2.Intracity
7.
Global Electric Bus Market Estimates & Forecast Trend Analysis, by
End-use
7.1. Global Electric Bus Market
Revenue (US$ Bn) Estimates and Forecasts, by End-use, 2020 - 2033
7.1.1.Public
7.1.2.Private
8.
Global Electric Bus Market Estimates & Forecast Trend Analysis,
by Region
8.1. Global Electric Bus Market
Revenue (US$ Bn) Estimates and Forecasts, by Region, 2020 - 2033
8.1.1.North America
8.1.2.Europe
8.1.3.Asia Pacific
8.1.4.Middle East & Africa
8.1.5.Latin America
9.
North
America Electric Bus Market: Estimates & Forecast Trend Analysis
9.1.
North
America Electric Bus Market Assessments & Key Findings
9.1.1.North America Electric Bus
Market Introduction
9.1.2.North America Electric Bus
Market Size Estimates and Forecast (US$ Billion) (2020 - 2033)
9.1.2.1. By Propulsion Type
9.1.2.2. By Battery Type
9.1.2.3. By Application
9.1.2.4. By End-use
9.1.2.5. By Country
9.1.2.5.1. The U.S.
9.1.2.5.2. Canada
10. Europe Electric
Bus Market: Estimates & Forecast
Trend Analysis
10.1. Europe Electric Bus Market
Assessments & Key Findings
10.1.1. Europe Electric Bus Market
Introduction
10.1.2. Europe Electric Bus Market Size
Estimates and Forecast (US$ Billion) (2020 - 2033)
10.1.2.1. By Propulsion Type
10.1.2.2. By Battery Type
10.1.2.3. By Application
10.1.2.4. By End-use
10.1.2.5. By Country
10.1.2.5.1.
Germany
10.1.2.5.2.
Italy
10.1.2.5.3.
U.K.
10.1.2.5.4.
France
10.1.2.5.5.
Spain
10.1.2.5.6. Rest
of Europe
11. Asia Pacific Electric
Bus Market: Estimates & Forecast
Trend Analysis
11.1. Asia Pacific Market Assessments
& Key Findings
11.1.1. Asia Pacific Electric Bus Market
Introduction
11.1.2. Asia Pacific Electric Bus Market
Size Estimates and Forecast (US$ Billion) (2020 - 2033)
11.1.2.1. By Propulsion Type
11.1.2.2. By Battery Type
11.1.2.3. By Application
11.1.2.4. By End-use
11.1.2.5. By Country
11.1.2.5.1. China
11.1.2.5.2. Japan
11.1.2.5.3. India
11.1.2.5.4. Australia
11.1.2.5.5. South Korea
11.1.2.5.6. Rest of Asia Pacific
12. Middle East & Africa Electric
Bus Market: Estimates & Forecast
Trend Analysis
12.1. Middle East & Africa Market
Assessments & Key Findings
12.1.1. Middle
East & Africa Electric
Bus Market Introduction
12.1.2. Middle
East & Africa Electric
Bus Market Size Estimates and Forecast (US$ Billion) (2020 - 2033)
12.1.2.1. By Propulsion Type
12.1.2.2. By Battery Type
12.1.2.3. By Application
12.1.2.4. By End-use
12.1.2.5. By Country
12.1.2.5.1. UAE
12.1.2.5.2. Saudi
Arabia
12.1.2.5.3. South
Africa
12.1.2.5.4. Rest of
MEA
13. Latin America
Electric Bus Market: Estimates &
Forecast Trend Analysis
13.1. Latin America Market Assessments
& Key Findings
13.1.1. Latin America Electric Bus
Market Introduction
13.1.2. Latin America Electric Bus
Market Size Estimates and Forecast (US$ Billion) (2020 - 2033)
13.1.2.1. By Propulsion Type
13.1.2.2. By Battery Type
13.1.2.3. By Application
13.1.2.4. By End-use
13.1.2.5. By Country
13.1.2.5.1. Brazil
13.1.2.5.2. Argentina
13.1.2.5.3. Mexico
13.1.2.5.4. Rest of
LATAM
14. Country Wise Market:
Introduction
15. Competition Landscape
15.1. Global Electric Bus Market Product
Mapping
15.2. Global Electric Bus Market
Concentration Analysis, by Leading Players / Innovators / Emerging Players /
New Entrants
15.3. Global Electric Bus Market Tier
Structure Analysis
15.4. Global Electric Bus Market
Concentration & Company Market Shares (%) Analysis, 2024
16. Company Profiles
16.1.
BYD Company Limited
16.1.1. Company Overview & Key Stats
16.1.2. Financial Performance & KPIs
16.1.3. Product Portfolio
16.1.4. SWOT Analysis
16.1.5. Business Strategy & Recent
Developments
* Similar details would be provided
for all the players mentioned below
16.2. AB Volvo
16.3. Proterra
16.4. MAN
16.5. Nissan Motor
Corporation
16.6. Ashok Leyland
Limited
16.7. Daimler Truck
AG
16.8. Zhengzhou
Yutong Bus Co. Ltd.
16.9. TATA Motors
Limited
16.10. Hyundai Motor
Company
16.11. Others
17. Research
Methodology
17.1. External Transportations /
Databases
17.2. Internal Proprietary Database
17.3. Primary Research
17.4. Secondary Research
17.5. Assumptions
17.6. Limitations
17.7. Report FAQs
18. Research
Findings & Conclusion
Our Research Methodology
"Insight without rigor is just noise."
We follow a comprehensive, multi-phase research framework designed to deliver accurate, strategic, and decision-ready intelligence. Our process integrates primary and secondary research , both quantitative and qualitative , along with dual modeling techniques ( top-down and bottom-up) and a final layer of validation through our proprietary in-house repository.
PRIMARY RESEARCH
Primary research captures real-time, firsthand insights from the market to understand behaviors, motivations, and emerging trends.
1. Quantitative Primary Research
Objective: Generate statistically significant data directly from market participants.
Approaches:- Structured surveys with customers, distributors, and field agents
- Mobile-based data collection for point-of-sale audits and usage behavior
- Phone-based interviews (CATI) for market sizing and product feedback
- Online polling around industry events and digital campaigns
- Purchase frequency by customer type
- Channel performance across geographies
- Feature demand by application or demographic
2. Qualitative Primary Research
Objective: Explore decision-making drivers, pain points, and market readiness.
Approaches:- In-depth interviews (IDIs) with executives, product managers, and key decision-makers
- Focus groups among end users and early adopters
- Site visits and observational research for consumer products
- Informal field-level discussions for regional and cultural nuances
SECONDARY RESEARCH
This phase helps establish a macro-to-micro understanding of market trends, size, regulation, and competitive dynamics, sourced from credible and public domain information.
1. Quantitative Secondary Research
Objective: Model market value and segment-level forecasts based on published data.
Sources include:- Financial reports and investor summaries
- Government trade data, customs records, and regulatory statistics
- Industry association publications and economic databases
- Channel performance and pricing data from marketplace listings
- Revenue splits, pricing trends, and CAGR estimates
- Supply-side capacity and volume tracking
- Investment analysis and funding benchmarks
2. Qualitative Secondary Research
Objective: Capture strategic direction, innovation signals, and behavioral trends.
Sources include:- Company announcements, roadmaps, and product pipelines
- Publicly available whitepapers, conference abstracts, and academic research
- Regulatory body publications and policy briefs
- Social and media sentiment scanning for early-stage shifts
- Strategic shifts in market positioning
- Unmet needs and white spaces
- Regulatory triggers and compliance impact

DUAL MODELING: TOP-DOWN + BOTTOM-UP
To ensure robust market estimation, we apply two complementary sizing approaches:
Top-Down Modeling:- Start with broader industry value (e.g., global or regional TAM)
- Apply filters by segment, geography, end-user, or use case
- Adjust with primary insights and validation benchmarks
- Ideal for investor-grade market scans and opportunity mapping
- Aggregate from the ground up using sales volumes, pricing, and unit economics
- Use internal modeling templates aligned with stakeholder data
- Incorporate distributor-level or region-specific inputs
- Most accurate for emerging segments and granular sub-markets
DATA VALIDATION: IN-HOUSE REPOSITORY
We close the loop with proprietary data intelligence built from ongoing projects, industry monitoring, and historical benchmarking. This repository includes:
- Multi-sector market and pricing models
- Key trendlines from past interviews and forecasts
- Benchmarked adoption rates, churn patterns, and ROI indicators
- Industry-specific deviation flags and cross-check logic
- Catches inconsistencies early
- Aligns projections across studies
- Enables consistent, high-trust deliverables