
Electrical Label Market Size and Forecast (2020 - 2033), Global and Regional Growth, Trend, Share, and Industry Analysis Report Coverage: By Material (Polyester, Polyimide, Vinyl, Others), By Identification Method (Wire & Cable Markers, Equipment Labels, Safety Labels, Asset Tags), By End-User (Industrial Manufacturing, Construction, Aerospace & Defence, Automotive, IT & Telecommunications, Utilities, Others) And Geography
2025-12-17
Semiconductor and Electronics
Ekta Chaurasia (Team Lead)
Description
Electrical
Label Market Overview
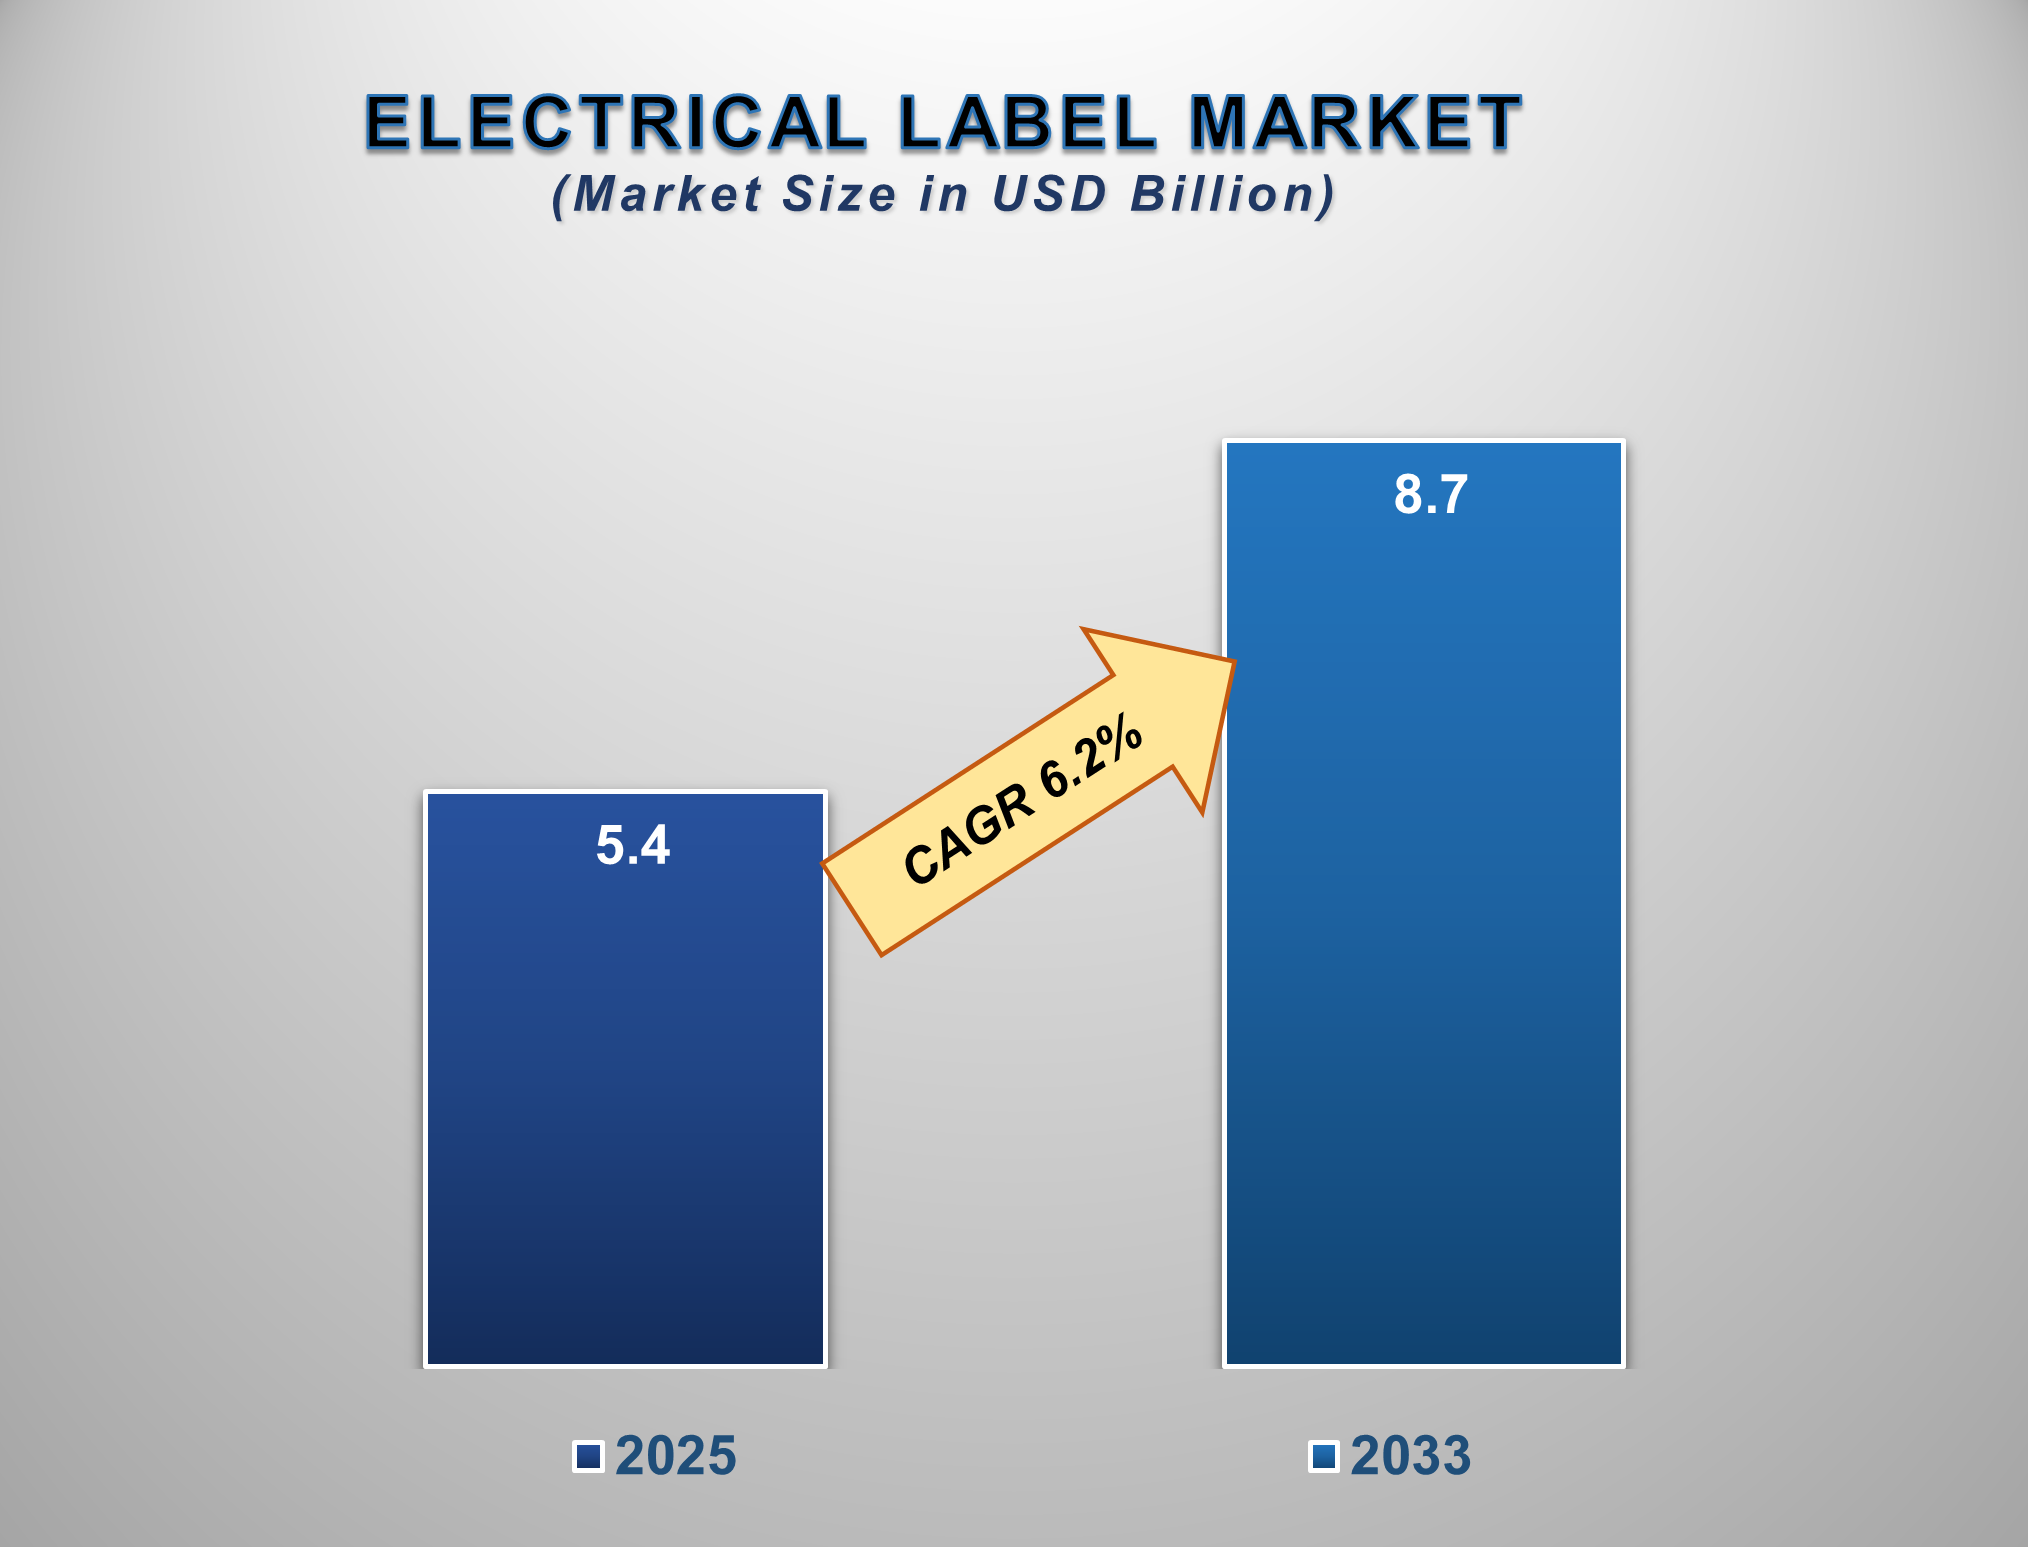
The Electrical Label Market is set for significant growth from 2025 to 2033, driven by stringent safety regulations, the global expansion of infrastructure, and the increasing complexity of electrical systems. The market is projected to be valued at approximately USD 5.4 billion in 2025 and is forecasted to reach nearly USD 8.7 billion by 2033, exhibiting a compound annual growth rate (CAGR) of 6.2% during this period.
Electrical labels are critical components used
for identification, safety warnings, and asset tracking in electrical systems.
They are designed to withstand harsh environments, including high temperatures,
moisture, chemicals, and abrasion, while maintaining legibility. The market's
expansion is underpinned by factors such as the global push for industrial
safety compliance (e.g., NEC, IEC standards), the rise in smart grid and energy
infrastructure projects, and the growing automation in manufacturing. Furthermore,
technological advancements in label materials, such as the development of
flame-retardant substrates and durable synthetic fabrics, along with the
adoption of digital printing for on-demand customization, are enhancing product
performance. Asia-Pacific currently holds the largest market share, driven by
rapid industrialization and infrastructure development, while North America
remains a key region due to its strict regulatory landscape.
Electrical Label Market Drivers and Opportunities
Stringent Regulatory Compliance and Safety Standards are the
Primary Market Driver
The implementation and enforcement of stringent
international and national safety standards, such as the National Electrical
Code (NEC) in the U.S., IEC standards in Europe, and similar regulations
globally, are the most significant drivers for the electrical labels market.
These regulations mandate clear, permanent, and durable identification of
circuit components, voltage warnings, and safety hazards to prevent accidents,
ensure worker safety, and facilitate efficient maintenance and troubleshooting.
The growing emphasis on workplace safety and the legal ramifications of
non-compliance are compelling industries across the board to adopt
high-quality, compliant labeling solutions.
Adoption of Industrial IoT (IIoT) and Asset Management Is
Driving Market Evolution
The integration of Industrial IoT and smart
manufacturing practices is a major catalyst for market growth. Electrical
labels are evolving beyond simple identification to become integral parts of
asset management systems. The use of labels integrated with QR codes, barcodes,
and RFID tags allows for quick scanning and access to digital twins,
maintenance history, and operational data of electrical assets. This trend
towards digitalization is fueling demand for
smart labels that can bridge the physical and digital worlds, improving
operational efficiency, predictive maintenance, and supply chain visibility in
complex industrial environments.
Growth in Renewable Energy and Smart Grid Infrastructure
Presents Significant Opportunities
The global transition towards renewable energy
sources like solar and wind, coupled with massive investments in modernizing
electrical grids into "smart grids," presents a major growth
frontier. These projects require extensive labeling for cables, switchgear,
control panels, and substations to ensure safety, interoperability, and
reliable operation. For label manufacturers, this creates a substantial
opportunity to provide specialized solutions that can endure extreme outdoor
conditions and UV exposure. Simultaneously, the booming construction sector,
particularly in emerging economies, and the retrofitting of existing
infrastructure with safer electrical systems are creating sustained demand for
standardized electrical identification products.
Electrical Label Market Scope
|
Report Attributes |
Description |
|
Market Size in 2025 |
USD 5.4 Billion |
|
Market Forecast in 2033 |
USD 8.7 Billion |
|
CAGR % 2025-2033 |
6.2% |
|
Base Year |
2024 |
|
Historic Data |
2020-2024 |
|
Forecast Period |
2025-2033 |
|
Report USP |
Product Portfolio,
Technological Analysis, Company Market Share, Company Heatmap, Pricing
Analysis, Growth Factors and more |
|
Segments Covered |
●
By Material ●
By Identification
Method ●
By End-user |
|
Regional Scope |
●
North America, ●
Europe, ●
APAC, ●
Latin America ●
Middle East and
Africa |
|
Country Scope |
1)
U.S. 2)
Canada 3)
Germany 4)
UK 5)
France 6)
Spain 7)
Italy 8)
Switzerland 9)
China 10)
Japan 11)
India 12)
Australia 13)
South Korea 14)
Brazil 15)
Mexico 16)
Argentina 17)
South Africa 18)
Saudi Arabia 19)
UAE |
Electrical Label Market Report Segmentation
Analysis
The global Electrical Label
Market industry analysis is segmented by Material, by Identification Method, by
End-User, and by Region
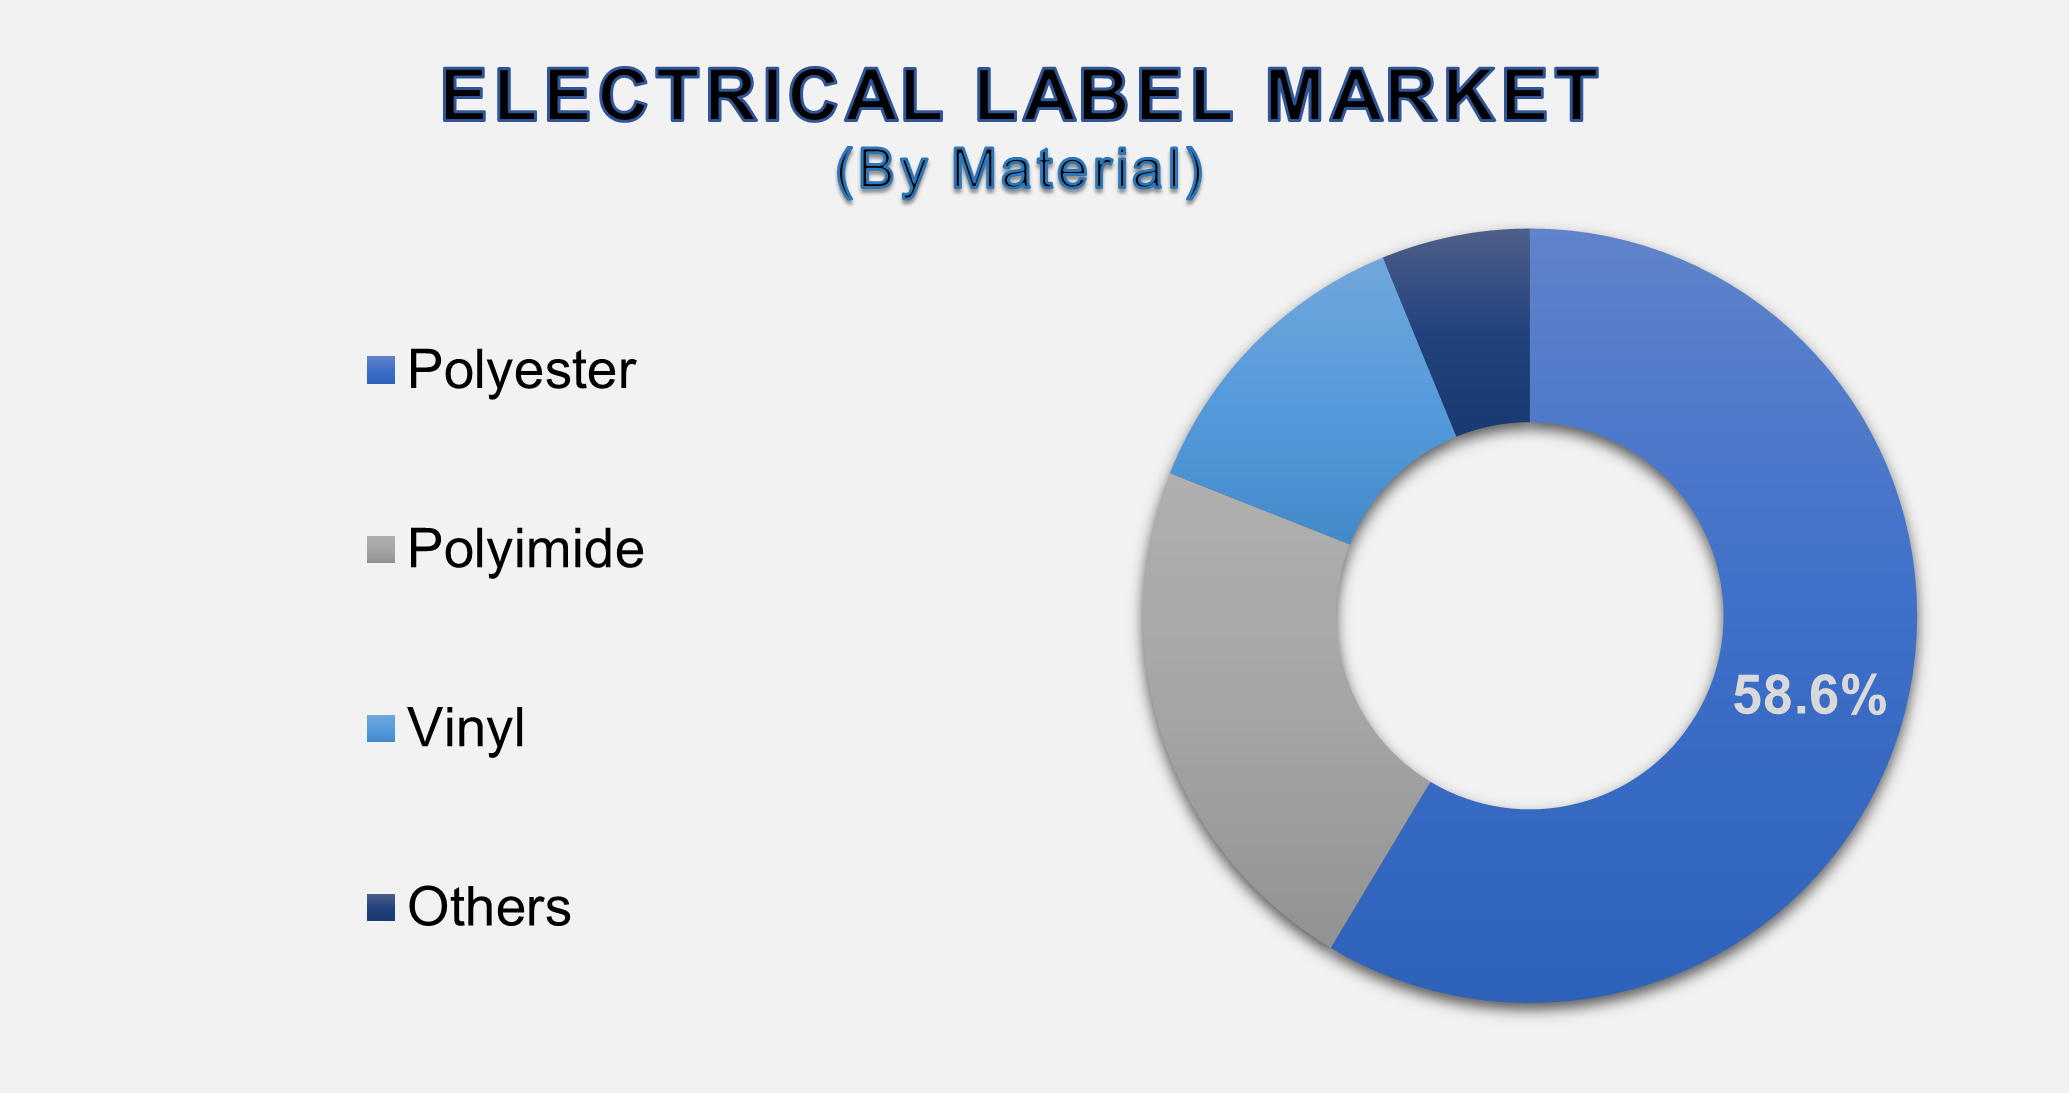
The Polyester segment is
anticipated to command a dominant market share in 2025.
The Material segment is categorized into Polyester, Polyimide, Vinyl, and Others. The Polyester segment commands a dominant market share, primarily due to its excellent durability, chemical and abrasion resistance, and thermal stability. Polyester labels offer a strong balance of performance and cost-effectiveness, making them suitable for a wide range of applications from control panels to equipment nameplates. Their ability to accept various printing technologies and adhesives, along with good dimensional stability, makes them the go-to material for general-purpose industrial electrical labeling.
The Industrial
Manufacturing segment is projected to be the fastest-growing.
The
End-User segment is divided into Industrial Manufacturing, Construction,
Aerospace & Defense, Automotive, IT & Telecommunications, Utilities,
and Others. The Industrial Manufacturing segment is projected to be the
fastest-growing end-user, driven by the global wave of automation and Industry
4.0 initiatives. Modern manufacturing facilities rely on complex machinery and
extensive electrical systems that require precise identification for
operational efficiency and safety. The need for asset tracking, preventive
maintenance, and compliance with safety standards in these high-stakes
environments is propelling the demand for durable and often smart-enabled
electrical labels.
The Wire & Cable
Markers segment is projected to exhibit the strongest growth.
The
Identification Method segment includes Wire & Cable Markers, Equipment
Labels, Safety Labels, and Asset Tags. The Wire & Cable Markers segment
exhibits the strongest growth due to the sheer volume of wiring in modern
infrastructure and industrial systems. Proper wire and cable identification is
critical for installation, troubleshooting, and repair, reducing downtime and
preventing errors. The expansion of data centers, telecommunications networks,
and building automation systems, all of which involve thousands of connections,
is creating massive, sustained demand for reliable and easy-to-apply wire
markers.
The following segments are
part of an in-depth analysis of the global Electrical Label Market:
|
Market
Segments |
|
|
By
Material |
●
Polyester ●
Polyimide ●
Vinyl ●
Others |
|
By
Identification Method |
●
Wire & Cable
Markers ●
Equipment Labels ●
Safety Labels ●
Asset Tags ●
Others |
|
By End-user |
●
Industrial
Manufacturing ●
Construction ●
Aerospace &
Defense ●
Automotive ●
IT &
Telecommunications ●
Utilities ●
Others |
Electrical Label Market Share Analysis by Region
The Asia Pacific region
is anticipated to hold the largest portion of the Electrical Label Market
globally throughout the forecast period.
Asia-Pacific's
dominance is attributed to its rapid industrialization, massive investments in
infrastructure development (including power generation, transportation, and
urban development), and the presence of a large manufacturing base. Countries
like China, India, and Southeast Asian nations are witnessing booming
construction and industrial sectors, all of which require extensive electrical
systems and compliant labeling. Government initiatives promoting manufacturing
and infrastructure, such as "Made in China 2025" and India's
industrial corridors, are key drivers solidifying the region's leading
position. In addition, the North America
region is expected to be a significant and steady market, characterized by
strict regulatory enforcement from bodies like OSHA and NFPA and a strong focus on modernizing aging infrastructure. The
high adoption of advanced technologies like IIoT and the presence of major
aerospace and defense contractors further contribute to the demand for
high-performance electrical labels in the region.
Electrical Label Market Competition Landscape
Analysis
The global electrical label
market is fragmented and features a mix of large multinational industrial
suppliers, specialized label manufacturers, and regional players. Competition
is based on product quality, durability, compliance with international standards,
product range, distribution network, and technical support. Key strategies
include new product development for harsh environments, expansion of digital
printing capabilities for customization, strategic acquisitions to gain market
share and technology, and a strong focus on providing comprehensive solutions
that include software for label design and management.
Global Electrical Label Market Recent
Developments News:
- In February 2025, Brady Corporation launched a new line of
ultra-durable RFID-enabled asset tags designed for tracking electrical
components in high-temperature and corrosive industrial environments.
- In December 2024, 3M Company introduced a new flame-retardant vinyl
material for its electrical safety label series, enhancing protection in
critical applications like energy storage systems.
- In September 2024, HellermannTyton (Aptiv PLC) acquired a specialized
digital printing company to expand its capabilities for on-demand,
customized wire marker production.
- In June 2024, TE Connectivity released a new software platform that
integrates with its label printers to simplify the design and management
of compliant electrical identification systems for large-scale projects.
The Global Electrical Label Market Is Dominated
by a Few Large Companies, such as
●
Brady Corporation
●
3M Company
●
HellermannTyton (Aptiv
PLC)
●
TE Connectivity Ltd.
●
Avery Dennison
Corporation
●
Panduit Corp.
●
Legrand
●
Siemens AG
●
ABB Ltd.
●
Phoenix Contact
●
CCL Industries Inc.
● Other Prominent Players
Frequently Asked Questions
Ekta Chaurasia (Team Lead)
Ekta Chaurasia is a highly experienced Team Lead at M2Square Consultancy with over 7 years of expertise in market research, strategic consulting, competitive benchmarking, and business intelligence solutions. She specializes in ICT, semiconductors & electronics, automotive & transportation, and industrial machinery markets.
She leads end-to-end global research projects focused on market trends, industry analysis, growth forecasting, customer insights, and strategic decision-making. Known for her analytical leadership and industry expertise, Ekta helps businesses uncover growth opportunities, evaluate competitive landscapes, and stay ahead in rapidly evolving markets through accurate and insight-driven research.
1. Global Electrical Label
Market Introduction and Market Overview
1.1.
Objectives
of the Study
1.2.
Global
Electrical Label Market Scope and Market Estimation
1.2.1.Global Electronic Toll
Collection Overall Market Size (US$ Mn), Market CAGR (%), Market forecast (2025
- 2033)
1.2.2.Global Electrical Label
Market Revenue Share (%) and Growth Rate (Y-o-Y) from 2020 - 2033
1.3.
Market
Segmentation
1.3.1.Material of Global Electrical
Label Market
1.3.2.Identification Method of
Global Electrical Label Market
1.3.3.End-user of Global Electrical
Label Market
1.3.4.Region of Global Electrical
Label Market
2. Executive
Summary
2.1.
Demand
Side Trends
2.2.
Key
Market Trends
2.3.
Market
Demand (US$ Mn) Analysis 2020 – 2024 and forecast, 2025 – 2033
2.4.
Demand
and Opportunity Assessment
2.5.
Technological
Advancements
2.6.
Regulatory
Scenario by Region
2.7.
Key
Developments
2.8.
Market
Entry Strategies
2.9.
Market
Dynamics
2.9.1.Drivers
2.9.2.Limitations
2.9.3.Opportunities
2.9.4.Impact Analysis of Drivers
and Restraints
2.10.
Porter’s
Five Forces Analysis
2.11.
PEST
Analysis
3. Global
Electrical Label Market Estimates
& Historical Trend Analysis (2020 - 2024)
4. Global
Electrical Label Market Estimates
& Forecast Trend Analysis, by Material
4.1.
Global
Electrical Label Market Revenue (US$ Mn) Estimates and Forecasts, by Material,
2020 - 2033
4.1.1.Polyester
4.1.2.Polyimide
4.1.3.Vinyl
4.1.4.Others
5. Global
Electrical Label Market Estimates
& Forecast Trend Analysis, by Identification Method
5.1.
Global
Electrical Label Market Revenue (US$ Mn) Estimates and Forecasts, by Identification
Method, 2020 - 2033
5.1.1.Wire & Cable Markers
5.1.2.Equipment Labels
5.1.3.Safety Labels
5.1.4.Asset Tags
5.1.5.Others
6. Global
Electrical Label Market Estimates
& Forecast Trend Analysis, by End-user
6.1.
Global
Electrical Label Market Revenue (US$ Mn) Estimates and Forecasts, by End-user
2020 - 2033
6.1.1.Industrial Manufacturing
6.1.2.Construction
6.1.3.Aerospace & Defense
6.1.4.Automotive
6.1.5.IT &
Telecommunications
6.1.6.Utilities
6.1.7.Others
7. Global
Electrical Label Market Estimates
& Forecast Trend Analysis, by region
7.1.
Global
Electrical Label Market Revenue (US$ Mn) Estimates and Forecasts, by region, 2020
- 2033
7.1.1.North America
7.1.2.Europe
7.1.3.Asia Pacific
7.1.4.Middle East & Africa
7.1.5.Latin America
8. North America Electrical
Label Market: Estimates & Forecast
Trend Analysis
8.1.
North
America Electrical Label Market Assessments & Key Findings
8.1.1.North America Electrical
Label Market Introduction
8.1.2.North America Electrical
Label Market Size Estimates and Forecast (US$ Billion) (2020 - 2033)
8.1.2.1. By Material
8.1.2.2. By Identification
Method
8.1.2.3. By End-user
8.1.2.4.
By
Country
8.1.2.4.1. The U.S.
8.1.2.4.2. Canada
9. Europe Electrical
Label Market: Estimates & Forecast
Trend Analysis
9.1.
Europe
Electrical Label Market Assessments & Key Findings
9.1.1.Europe Electrical Label
Market Introduction
9.1.2.Europe Electrical Label
Market Size Estimates and Forecast (US$ Billion) (2020 - 2033)
9.1.2.1. By Material
9.1.2.2. By Identification
Method
9.1.2.3. By End-user
9.1.2.4.
By
Country
9.1.2.4.1.
Germany
9.1.2.4.2.
Italy
9.1.2.4.3.
U.K.
9.1.2.4.4.
France
9.1.2.4.5.
Spain
9.1.2.4.6.
Switzerland
9.1.2.4.7. Rest
of Europe
10. Asia Pacific Electrical
Label Market: Estimates & Forecast
Trend Analysis
10.1.
Asia
Pacific Market Assessments & Key Findings
10.1.1.
Asia
Pacific Electrical Label Market Introduction
10.1.2.
Asia
Pacific Electrical Label Market Size Estimates and Forecast (US$ Billion) (2020
- 2033)
10.1.2.1. By Material
10.1.2.2. By Identification
Method
10.1.2.3. By End-user
10.1.2.4.
By
Country
10.1.2.4.1. China
10.1.2.4.2. Japan
10.1.2.4.3. India
10.1.2.4.4. Australia
10.1.2.4.5. South Korea
10.1.2.4.6. Rest of Asia Pacific
11. Middle East & Africa Electrical
Label Market: Estimates & Forecast
Trend Analysis
11.1.
Middle
East & Africa Market Assessments & Key Findings
11.1.1.
Middle East & Africa Electrical Label Market Introduction
11.1.2.
Middle East & Africa Electrical Label Market Size Estimates
and Forecast (US$ Billion) (2020 - 2033)
11.1.2.1. By Material
11.1.2.2. By Identification
Method
11.1.2.3. By End-user
11.1.2.4.
By
Country
11.1.2.4.1. UAE
11.1.2.4.2. Saudi
Arabia
11.1.2.4.3. South
Africa
11.1.2.4.4. Rest
of MEA
12. Latin America
Electrical Label Market: Estimates
& Forecast Trend Analysis
12.1.
Latin
America Market Assessments & Key Findings
12.1.1.
Latin
America Electrical Label Market Introduction
12.1.2.
Latin
America Electrical Label Market Size Estimates and Forecast (US$ Billion) (2020
- 2033)
12.1.2.1. By Material
12.1.2.2. By Identification
Method
12.1.2.3. By End-user
12.1.2.4.
By
Country
12.1.2.4.1. Brazil
12.1.2.4.2. Argentina
12.1.2.4.3. Mexico
12.1.2.4.4. Rest
of LATAM
13. Country Wise Market:
Introduction
14.
Competition
Landscape
14.1.
Global
Electrical Label Market Product Mapping
14.2.
Global
Electrical Label Market Concentration Analysis, by Leading Players / Innovators
/ Emerging Players / New Entrants
14.3.
Global
Electrical Label Market Tier Structure Analysis
14.4.
Global
Electrical Label Market Concentration & Company Market Shares (%) Analysis,
2024
15.
Company
Profiles
15.1.
Brady Corporation
15.1.1.
Company
Overview & Key Stats
15.1.2.
Financial
Performance & KPIs
15.1.3.
Product
Portfolio
15.1.4.
SWOT
Analysis
15.1.5.
Business
Strategy & Recent Developments
* Similar details would be provided for all the players
mentioned below
15.2. 3M Company
15.3. HellermannTyton
(Aptiv PLC)
15.4. TE
Connectivity Ltd.
15.5. Avery
Dennison Corporation
15.6. Panduit Corp.
15.7. Legrand
15.8. Siemens AG
15.9. ABB Ltd.
15.10. Phoenix
Contact
15.11. CCL
Industries Inc.
15.12. Other
Prominent Players
16. Research
Methodology
16.1.
External
Transportations / Databases
16.2.
Internal
Proprietary Database
16.3.
Primary
Research
16.4.
Secondary
Research
16.5.
Assumptions
16.6.
Limitations
16.7.
Report
FAQs
17. Research
Findings & Conclusion
Our Research Methodology
"Insight without rigor is just noise."
We follow a comprehensive, multi-phase research framework designed to deliver accurate, strategic, and decision-ready intelligence. Our process integrates primary and secondary research , both quantitative and qualitative , along with dual modeling techniques ( top-down and bottom-up) and a final layer of validation through our proprietary in-house repository.
PRIMARY RESEARCH
Primary research captures real-time, firsthand insights from the market to understand behaviors, motivations, and emerging trends.
1. Quantitative Primary Research
Objective: Generate statistically significant data directly from market participants.
Approaches:- Structured surveys with customers, distributors, and field agents
- Mobile-based data collection for point-of-sale audits and usage behavior
- Phone-based interviews (CATI) for market sizing and product feedback
- Online polling around industry events and digital campaigns
- Purchase frequency by customer type
- Channel performance across geographies
- Feature demand by application or demographic
2. Qualitative Primary Research
Objective: Explore decision-making drivers, pain points, and market readiness.
Approaches:- In-depth interviews (IDIs) with executives, product managers, and key decision-makers
- Focus groups among end users and early adopters
- Site visits and observational research for consumer products
- Informal field-level discussions for regional and cultural nuances
SECONDARY RESEARCH
This phase helps establish a macro-to-micro understanding of market trends, size, regulation, and competitive dynamics, sourced from credible and public domain information.
1. Quantitative Secondary Research
Objective: Model market value and segment-level forecasts based on published data.
Sources include:- Financial reports and investor summaries
- Government trade data, customs records, and regulatory statistics
- Industry association publications and economic databases
- Channel performance and pricing data from marketplace listings
- Revenue splits, pricing trends, and CAGR estimates
- Supply-side capacity and volume tracking
- Investment analysis and funding benchmarks
2. Qualitative Secondary Research
Objective: Capture strategic direction, innovation signals, and behavioral trends.
Sources include:- Company announcements, roadmaps, and product pipelines
- Publicly available whitepapers, conference abstracts, and academic research
- Regulatory body publications and policy briefs
- Social and media sentiment scanning for early-stage shifts
- Strategic shifts in market positioning
- Unmet needs and white spaces
- Regulatory triggers and compliance impact

DUAL MODELING: TOP-DOWN + BOTTOM-UP
To ensure robust market estimation, we apply two complementary sizing approaches:
Top-Down Modeling:- Start with broader industry value (e.g., global or regional TAM)
- Apply filters by segment, geography, end-user, or use case
- Adjust with primary insights and validation benchmarks
- Ideal for investor-grade market scans and opportunity mapping
- Aggregate from the ground up using sales volumes, pricing, and unit economics
- Use internal modeling templates aligned with stakeholder data
- Incorporate distributor-level or region-specific inputs
- Most accurate for emerging segments and granular sub-markets
DATA VALIDATION: IN-HOUSE REPOSITORY
We close the loop with proprietary data intelligence built from ongoing projects, industry monitoring, and historical benchmarking. This repository includes:
- Multi-sector market and pricing models
- Key trendlines from past interviews and forecasts
- Benchmarked adoption rates, churn patterns, and ROI indicators
- Industry-specific deviation flags and cross-check logic
- Catches inconsistencies early
- Aligns projections across studies
- Enables consistent, high-trust deliverables