
Energy Bar Market Size and Forecast (2025 – 2033), Global and Regional Growth, Trend, Share and Industry Analysis Report Coverage: By Type (Protein Bar, Nutrition Bar, Cereal Bar, Fiber Bar); By Ingredient (Cereals & Grains, Nuts & Seeds, Fruits, Protein, Chocolate Coated, Others); By Distribution Channel (Hypermarkets & Supermarkets, Traditional Grocery Store, Pharmacy & Drug Store, Convenience Stores, Online); and Geography
2025-12-17
Consumer Products
Description
Energy Bar Market Overview
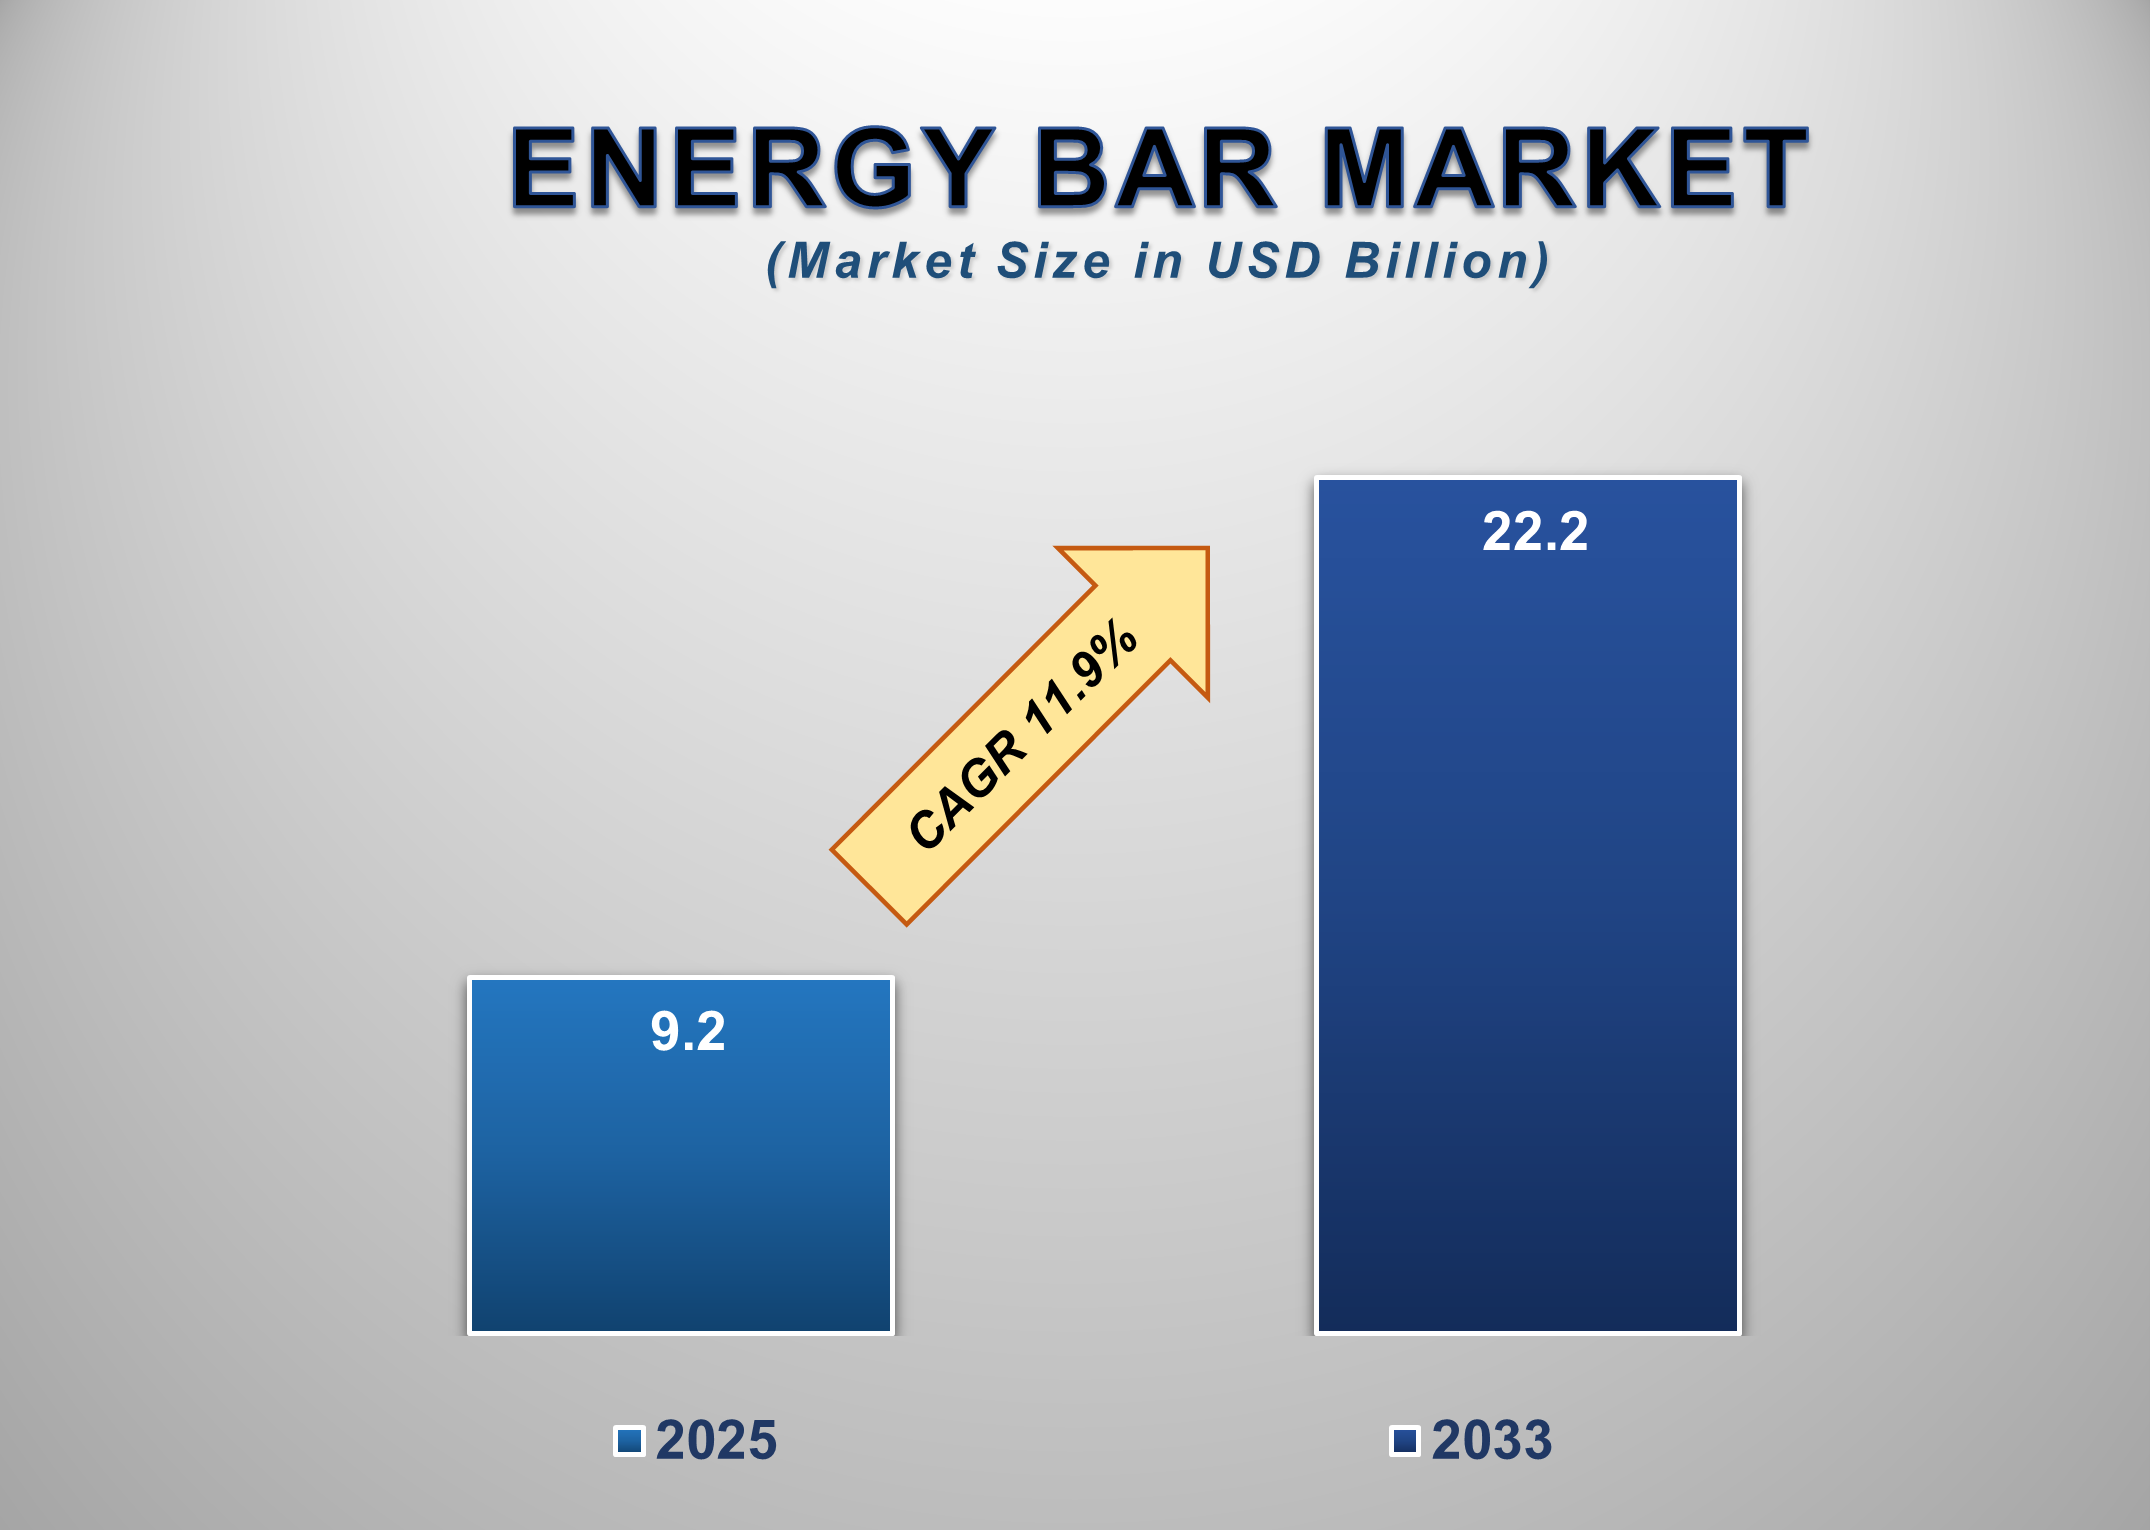
The Global Energy Bar Market Size is set for robust growth, driven by rising health consciousness, active lifestyles, and increasing demand for on-the-go nutrition. The market is valued at USD 9.2 billion in 2025 and projected to reach USD 22.2 billion by 2033, expanding at a CAGR of 11.9%. Consumers across all age groups are shifting toward convenient and nutritious snacking options that provide sustained energy and balanced macronutrients, which has positioned energy bars as a preferred choice over traditional snacks.
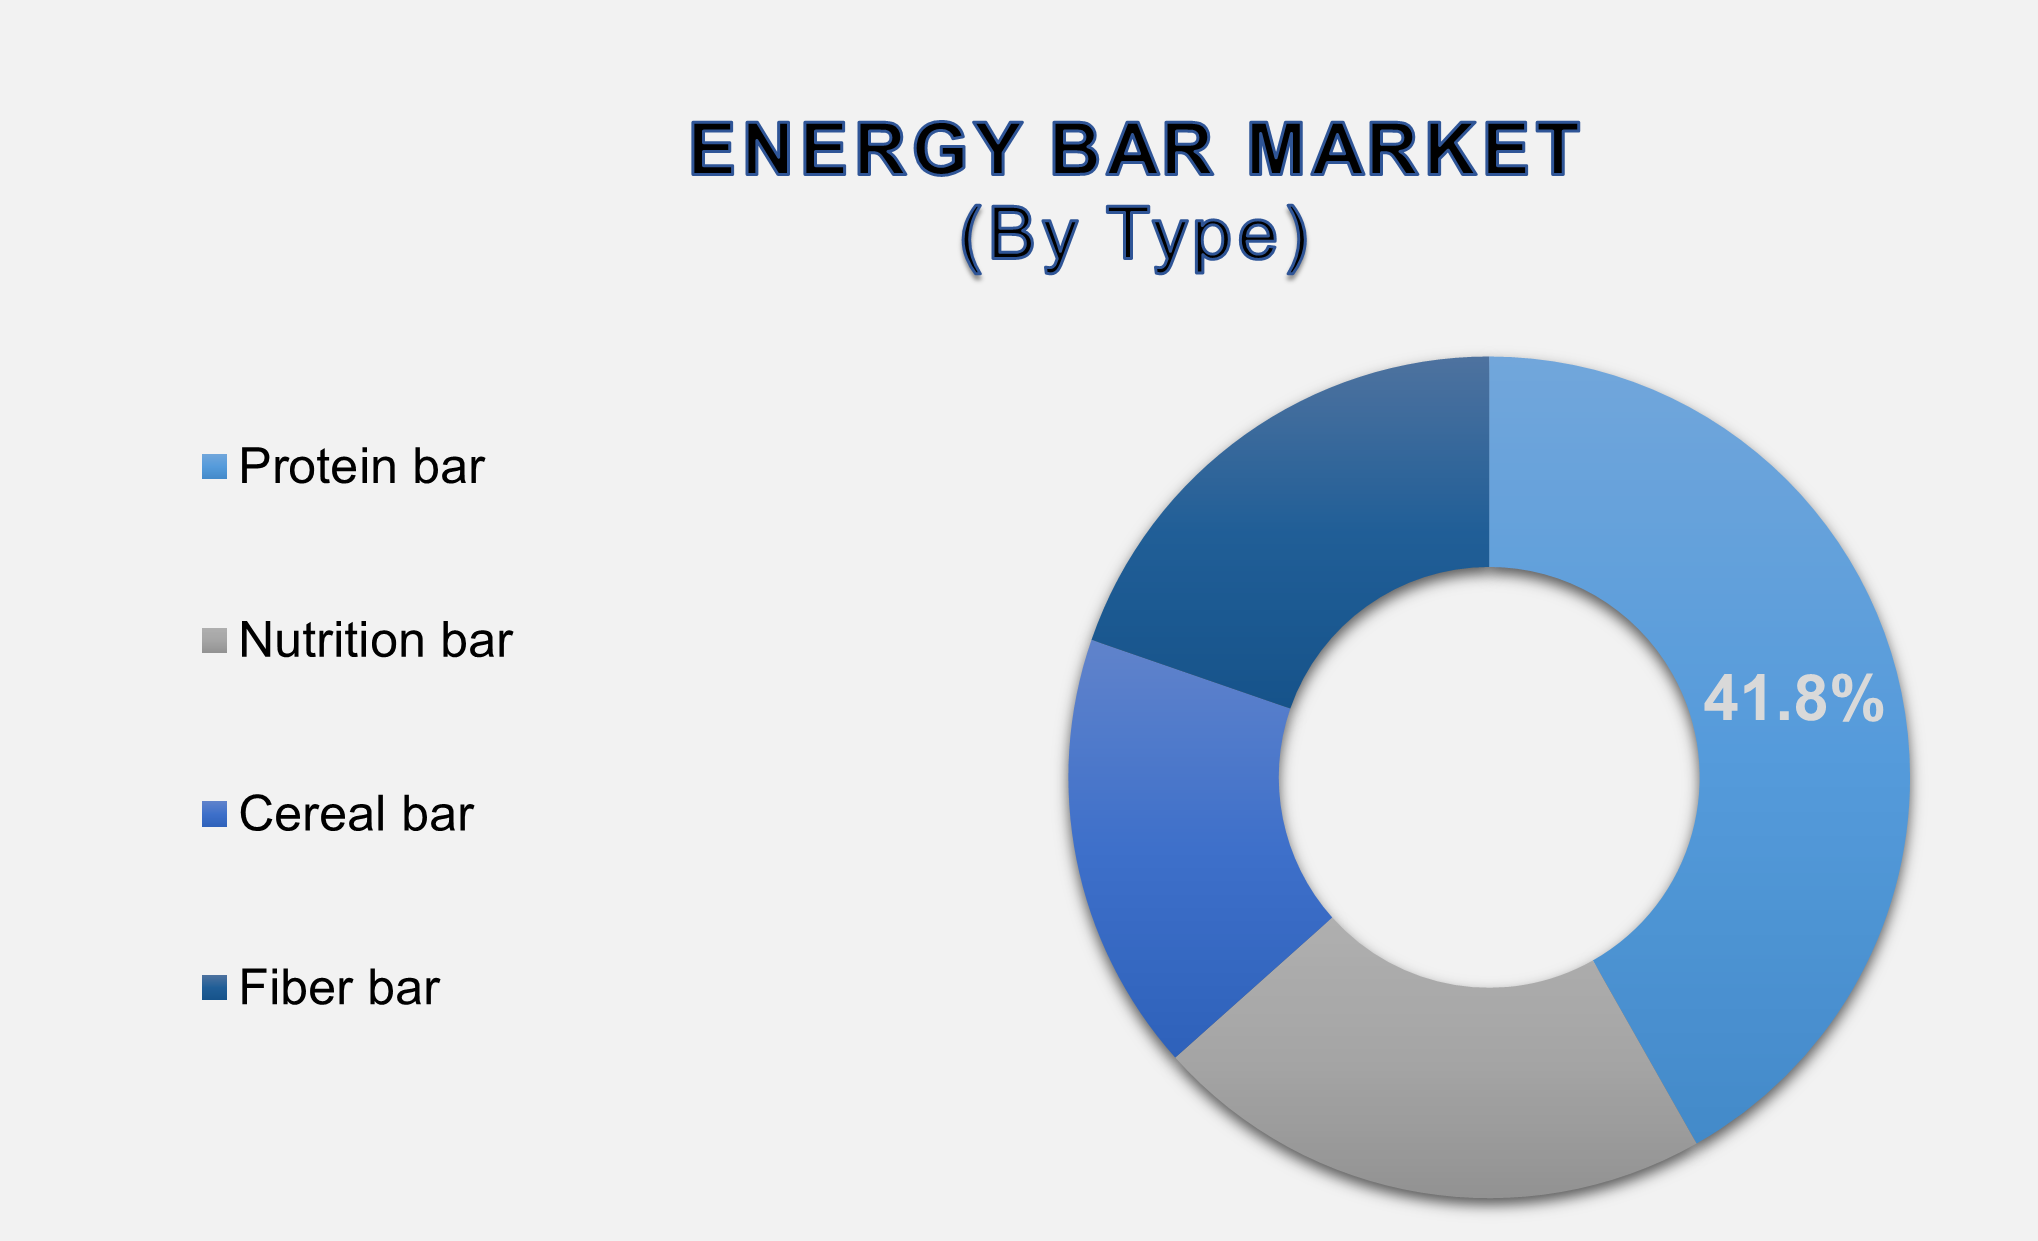
The protein bar segment dominates with a 41.8% share in 2025, reflecting the growing awareness about protein’s role in muscle recovery, fitness, and weight management. Moreover, the expansion of gyms, fitness centers, and sports activities globally is accelerating demand. The market is also benefiting from the rise of plant-based formulations and clean-label ingredients, catering to vegan and allergen-sensitive consumers.
Energy Bar Market Drivers and Opportunities
Rising Health Consciousness and Demand for Convenient Nutrition Are Fueling the Energy Bar Market Growth
The increasing focus on fitness, nutrition, and overall well-being is one of the key factors propelling the energy bar market. As consumers become more aware of the importance of balanced diets, they are opting for healthier snacking alternatives to traditional junk foods. Energy bars are perceived as convenient sources of essential nutrients such as proteins, complex carbohydrates, and dietary fibers, catering to athletes, gym-goers, and busy professionals. The rise in urbanization and on-the-go consumption patterns has amplified this trend.
Moreover, the growing popularity of clean-label and natural ingredient-based snacks has led companies to innovate with plant-based proteins, superfoods, and sugar-free formulations. In addition, the post-pandemic focus on immunity and preventive health has boosted the adoption of fortified and functional bars containing vitamins and probiotics. Evolving consumer lifestyles, expanding fitness centers, and widespread awareness about sustainable nutrition are expected to sustain the growth momentum. The availability of energy bars in multiple flavors and convenient packaging formats further enhances their appeal, positioning them as a mainstream healthy snack option across demographics.
Expansion of Retail and E-commerce Distribution Channels Is Boosting Global Market Accessibility
The growth of organized retail and digital commerce has revolutionized the availability and reach of energy bars. Supermarkets, hypermarkets, convenience stores, and online platforms now offer a wide variety of brands and product types, providing consumers with easy access to personalized nutrition. The proliferation of subscription-based delivery models and direct-to-consumer (D2C) brands has also enhanced customer engagement and loyalty.
E-commerce giants and specialty health stores have created online platforms for brands to reach health-conscious consumers globally. Companies leverage social media marketing, influencer collaborations, and digital campaigns to create awareness and promote new product launches. In emerging economies, expanding urban retail networks and improvements in cold chain logistics have enabled better product preservation and distribution.
Additionally, modern consumers are increasingly using mobile applications to purchase and track nutritional products, which supports demand for customized online offerings. Retailers are integrating advanced technologies such as AI-driven product recommendations and virtual nutrition assistants to personalize shopping experiences. Together, these advancements in retail and digital infrastructure are strengthening global energy bar sales and encouraging new entrants to innovate within the category.
Innovation in Plant-Based and Functional Ingredients Is Opening New Market Avenues
The growing consumer preference for plant-based, sustainable, and functionally enriched food products presents a major opportunity for energy bar manufacturers. Shifts in dietary preferences toward veganism and environmentally friendly nutrition are driving demand for bars made with natural proteins such as pea, soy, rice, and hemp. Moreover, the inclusion of functional ingredients—such as probiotics, adaptogens, omega fatty acids, and superfoods is allowing companies to cater to niche health segments.
Brands are investing heavily in R&D to create products targeting cognitive health, digestive wellness, and sustained energy release. The integration of bioavailable nutrients, prebiotics, and collagen-boosting compounds enhances product appeal among health enthusiasts. Additionally, advancements in food technology are enabling the development of low-sugar, high-protein, and allergen-free bars that appeal to consumers with specific dietary restrictions.
Sustainability trends, such as biodegradable wrappers and carbon-neutral production, are also resonating with eco-conscious buyers. As consumer awareness grows and the focus on holistic health intensifies, plant-based and functional ingredient innovations are expected to drive future growth and reshape the competitive landscape of the global energy bar market.
Energy Bar Market Scope
Report Attributes | Description |
Market Size in 2025 | USD 9.2 Billion |
Market Forecast in 2033 | USD 22.2 Billion |
CAGR % 2025-2033 | 11.9% |
Base Year | 2024 |
Historic Data | 2020-2024 |
Forecast Period | 2025-2033 |
Report USP | Production, Consumption, company share, company heatmap, company production Capacity, growth factors and more |
Segments Covered | ● By Type, By Ingredient, By Distribution Channel |
Regional Scope | ● North America ● Europe ● APAC ● Latin America ● Middle East and Africa |
Country Scope | 1) U.S. 2) Canada 3) Germany 4) UK 5) France 6) Spain 7) Italy 8) Switzerland 9) China 10) Japan 11) India 12) Australia 13) South Korea 14) Brazil 15) Mexico 16) Argentina 17) South Africa 18) Saudi Arabia 19) UAE |
Energy Bar Market Report Segmentation Analysis
The global Energy Bar Market industry analysis is segmented by Type, by Ingredient, by Distribution Channel, and by Region.
The Protein Bar Segment Accounted for the Largest Market Share in the Global Energy Bar Market
The type segment is segmented into Protein Bar, Nutrition Bar, Cereal Bar, and Fiber Bar.
In 2025, the Protein Bar segment dominated the global market, accounting for 41.8% of total revenue. Protein bars are widely consumed for their high protein content, which supports muscle recovery and satiety. The surge in fitness culture, sports participation, and growing awareness of protein’s health benefits have boosted demand. These bars are also favored by consumers seeking meal replacements or quick energy sources during busy schedules. Manufacturers continue to innovate with plant-based proteins, natural sweeteners, and new flavors, making protein bars appealing to broader audiences. The segment benefits from strong branding in fitness retail and increasing availability across online and offline channels. As dietary trends lean toward functional and clean-label nutrition, the dominance of the protein bar category is expected to persist throughout the forecast period.
Cereals & Grains Segment Leads the Market by Ingredient in the Global Energy Bar Market
By ingredient, the market is divided into Cereals & Grains, Nuts & Seeds, Fruits, Protein, Chocolate Coated, and Others. The Cereals & Grains segment held the largest share in 2025, driven by growing consumer preference for natural fiber sources and wholesome carbohydrates. Ingredients such as oats, quinoa, and barley provide sustained energy release and improved digestive benefits, making them ideal for athletes and health-conscious consumers. Manufacturers are increasingly using gluten-free and organic grains to cater to allergy-sensitive populations. The rise of clean-label and vegan trends has further accelerated the inclusion of whole grains in formulations. These ingredients not only enhance texture and flavor but also align with sustainability trends as they require less processing. As awareness of the nutritional benefits of complex carbohydrates grows, cereals & grains will continue to dominate the ingredient landscape in the global energy bar market.
The Hypermarkets & Supermarkets Segment Accounted for the Largest Market Share in the Global Energy Bar Market
By distribution channel, the market is segmented into Hypermarkets & Supermarkets, Traditional Grocery Stores, Pharmacy & Drug Stores, Convenience Stores, and Online.
In 2025, the Hypermarkets & Supermarkets segment led the global market owing to the increasing availability of diverse energy bar brands and flavors in large retail outlets. These stores provide high visibility, attractive promotions, and product sampling options that encourage consumer trials. The structured layout of modern supermarkets allows brands to leverage shelf placement and display strategies to capture consumer attention. In developing economies, the expansion of organized retail chains has further strengthened this channel’s dominance. Moreover, retailers are increasingly integrating health & wellness aisles to meet growing demand for nutritious snack options. Although online channels are gaining traction, hypermarkets and supermarkets remain the preferred purchasing venues due to their convenience, instant product access, and trust factor among consumers.
The following segments are part of an in-depth analysis of the global Energy Bar Market:
Market Segments | |
By Type | ● Protein bar ● Nutrition bar ● Cereal bar ● Fiber bar |
By Ingredient | ● Cereals & Grains ● Nuts & Seeds ● Fruits ● Protein ● Chocolate-Coated |
By Distribution Channel | ● Hypermarkets & Supermarkets ● Traditional Grocery Store ● Pharmacy & Drug Store ● Convenience Stores ● Online ● Others |
Energy Bar Market Share Analysis by Region
The North America region is projected to hold the largest share of the global Energy Bar Market over the forecast period.
North America held the largest share of the global energy bar market, accounting for 40.1% in 2025. The region’s dominance stems from a strong health and fitness culture, high consumer awareness of nutrition, and widespread availability of premium functional snacks. The United States and Canada host several leading energy bar manufacturers, including Clif Bar, Kellogg’s, and General Mills, who continue to innovate with new product lines. Additionally, the popularity of plant-based and organic bars has grown significantly among millennials and working professionals. The robust retail infrastructure and digital commerce ecosystem have also enhanced product accessibility. Growing emphasis on clean eating and convenient nutrition keeps North America at the forefront of global energy bar consumption.
Meanwhile, the Asia Pacific region is expected to register the fastest CAGR during the forecast period. Increasing disposable incomes, urbanization, and Western lifestyle adoption are driving higher consumption of convenient, healthy snacks. Countries such as China, Japan, and India are witnessing growing participation in fitness activities and awareness about protein-enriched foods. The rapid expansion of supermarkets and e-commerce platforms, coupled with innovations in local flavor profiles, is fueling demand. Rising health concerns, such as obesity and diabetes, have led consumers to prefer low-sugar, nutrient-rich bars. Moreover, investments from global brands in local manufacturing and marketing are accelerating growth across the Asia Pacific.
Energy Bar Market Competition Landscape Analysis
The global energy bar market is highly competitive, with leading players focusing on innovation, flavor diversity, and sustainability. Key companies include Clif Bar & Company, Kellogg’s, General Mills, Nature’s Bakery, Kind LLC, Quest Nutrition, RxBar, PowerBar, and GoMacro. These firms emphasize clean-label ingredients, protein enrichment, and functional formulations to appeal to health-conscious consumers. Strategic collaborations, mergers, and acquisitions are common as brands expand their geographic footprint and diversify portfolios.
Global Energy Bar Market Recent Developments News:
- In May 2024, Clif Bar (Mondelēz International) launched its integrated advertising campaign, "The Most Important Ingredient is You," featuring athletes such as Frances Tiafoe and Breanna Stewart. The campaign—spanning digital, TV, and social media—aims to inspire U.S. and Canadian consumers by linking Clif Bar’s nutrition to personal passion and perseverance in sports and outdoor pursuits.
- In August 2024, Kellogg's expanded its Nutri-Grain portfolio with "Fruit & VegetableMash-Ups," introducing flavors like strawberry and squash and chocolatey banana bites. The new line combines fruits and vegetables in child-friendly snacks, supporting the brand’s move into hybrid nutrition segments and appealing to health-conscious parents seeking convenient, nutrient-rich options for children.
The Global Energy Bar Market is dominated by a few large companies, such as
● Clif Bar & Company
● Kellogg's
● General Mills
● Nature's Bakery
● Kind LLC
● Quest Nutrition
● RxBar
● Lärabar
● PowerBar
● Gatorade
● ThinkThin
● ZonePerfect
● Bob's Red Mill
● ProBar
● GoMacro
● Kashi Company
● Munk Pack
● Health Warrior
● Bumble Bar
● Vega
● Other Prominent Players
Frequently Asked Questions
1. Global Energy Bar Market
Introduction and Market Overview
1.1.
Objectives
of the Study
1.2.
Global
Energy Bar Market Scope and Market Estimation
1.2.1.Global Energy Bar Market Overall
Market Size (US$ Bn), Market CAGR (%), Market forecast (2025 - 2033)
1.2.2.Global Energy Bar Market
Revenue Share (%) and Growth Rate (Y-o-Y) from 2020 - 2033
1.3.
Market
Segmentation
1.3.1.Type of Global Energy Bar
Market
1.3.2.Ingredient of Global Energy
Bar Market
1.3.3.Distribution Channel of
Global Energy Bar Market
1.3.4.Region of Global Energy
Bar Market
2. Executive
Summary
2.1.
Demand
Side Trends
2.2.
Key
Market Trends
2.3.
Market
Demand (US$ Bn) Analysis 2020 – 2024 and Forecast, 2025 – 2033
2.4.
Demand
and Opportunity Assessment
2.5.
Demand
Supply Scenario
2.6.
Market
Dynamics
2.6.1.Drivers
2.6.2.Limitations
2.6.3.Opportunities
2.6.4.Impact Analysis of Drivers
and Restraints
2.7.
Emerging
Trends for Energy Bar Market
2.8.
Porter’s
Five Forces Analysis
2.9.
PEST
Analysis
2.10.
Key
Regulation
3. Global
Energy Bar Market Estimates
& Historical Trend Analysis (2020 - 2024)
4.
Global Energy Bar Market Estimates & Forecast Trend Analysis, by
Type
4.1.
Global
Energy Bar Market Revenue (US$ Bn) Estimates and Forecasts, by Type, 2020 - 2033
4.1.1.Protein bar
4.1.2.Nutrition bar
4.1.3.Cereal bar
4.1.4.Fiber bar
5.
Global Energy Bar Market Estimates & Forecast Trend Analysis, by
Ingredient
5.1.
Global
Energy Bar Market Revenue (US$ Bn) Estimates and Forecasts, by Ingredient, 2020
- 2033
5.1.1.Cereals & Grains
5.1.2.Nuts & Seeds
5.1.3.Fruits
5.1.4.Protein
5.1.5.Chocolate Coated
6.
Global Energy Bar Market Estimates & Forecast Trend Analysis, by
Distribution Channel
6.1.
Global
Energy Bar Market Revenue (US$ Bn) Estimates and Forecasts, by Distribution
Channel, 2020 - 2033
6.1.1.Hypermarkets &
Supermarkets
6.1.2.Traditional Grocery Store
6.1.3.Pharmacy & Drug Store
6.1.4.Convenience Stores
6.1.5.Online
6.1.6.Others
7. Global
Energy Bar Market Estimates
& Forecast Trend Analysis, by region
1.1.
Global
Energy Bar Market Revenue (US$ Bn) Estimates and Forecasts, by region, 2020 - 2033
1.1.1.North America
1.1.2.Europe
1.1.3.Asia Pacific
1.1.4.Middle East & Africa
1.1.5.Latin America
8. North America Energy
Bar Market: Estimates & Forecast
Trend Analysis
8.1.
North
America Energy Bar Market Assessments & Key Findings
8.1.1.North America Energy Bar
Market Introduction
8.1.2.North America Energy Bar
Market Size Estimates and Forecast (US$ Billion) (2020 - 2033)
8.1.2.1. By Type
8.1.2.2. By Ingredient
8.1.2.3. By Distribution
Channel
8.1.2.4.
By
Country
8.1.2.4.1.
The
U.S.
8.1.2.4.2.
Canada
9. Europe Energy
Bar Market: Estimates & Forecast
Trend Analysis
9.1.
Europe
Energy Bar Market Assessments & Key Findings
9.1.1.Europe Energy Bar Market
Introduction
9.1.2.Europe Energy Bar Market
Size Estimates and Forecast (US$ Billion) (2020 - 2033)
9.1.2.1. By Type
9.1.2.2. By Ingredient
9.1.2.3. By Distribution
Channel
9.1.2.4.
By
Country
9.1.2.4.1. Germany
9.1.2.4.2. Italy
9.1.2.4.3. U.K.
9.1.2.4.4. France
9.1.2.4.5. Spain
9.1.2.4.6. Switzerland
9.1.2.4.7.
Rest of Europe
10. Asia Pacific Energy
Bar Market: Estimates & Forecast
Trend Analysis
10.1.
Asia
Pacific Market Assessments & Key Findings
10.1.1.
Asia
Pacific Energy Bar Market Introduction
10.1.2.
Asia
Pacific Energy Bar Market Size Estimates and Forecast (US$ Billion) (2020 - 2033)
10.1.2.1. By Type
10.1.2.2. By Ingredient
10.1.2.3. By Distribution
Channel
10.1.2.4.
By
Country
10.1.2.4.1. China
10.1.2.4.2. Japan
10.1.2.4.3. India
10.1.2.4.4. Australia
10.1.2.4.5. South Korea
10.1.2.4.6.
Rest
of Asia Pacific
11. Middle East & Africa Energy
Bar Market: Estimates & Forecast
Trend Analysis
11.1.
Middle
East & Africa Market Assessments & Key Findings
11.1.1.
Middle East & Africa Energy Bar Market Introduction
11.1.2.
Middle East & Africa Energy Bar Market Size Estimates and
Forecast (US$ Billion) (2020 - 2033)
11.1.2.1. By Type
11.1.2.2. By Ingredient
11.1.2.3. By Distribution
Channel
11.1.2.4.
By
Country
11.1.2.4.1. South
Africa
11.1.2.4.2. UAE
11.1.2.4.3. Saudi
Arabia
11.1.2.4.4.
Rest of MEA
12. Latin America
Energy Bar Market: Estimates &
Forecast Trend Analysis
12.1.
Latin
America Market Assessments & Key Findings
12.1.1.
Latin
America Energy Bar Market Introduction
12.1.2.
Latin
America Energy Bar Market Size Estimates and Forecast (US$ Billion) (2020 - 2033)
12.1.2.1. By Type
12.1.2.2. By Ingredient
12.1.2.3. By Distribution
Channel
12.1.2.4.
By
Country
12.1.2.4.1. Brazil
12.1.2.4.2. Mexico
12.1.2.4.3. Argentina
12.1.2.4.4.
Rest of LATAM
13. Country Wise Market:
Introduction
14.
Competition
Landscape
14.1.
Global
Energy Bar Market Product Mapping
14.2.
Global
Energy Bar Market Concentration Analysis, by Leading Players / Innovators /
Emerging Players / New Entrants
14.3.
Global
Energy Bar Market Tier Structure Analysis
14.4.
Global
Energy Bar Market Concentration & Company Market Shares (%) Analysis, 2023
15.
Company
Profiles
15.1. Clif Bar
& Company
15.1.1.
Company
Overview & Key Stats
15.1.2.
Financial
Performance & KPIs
15.1.3.
Product
Portfolio
15.1.4.
SWOT
Analysis
15.1.5.
Business
Strategy & Recent Developments
* Similar details would be provided for all
the players mentioned below
15.2. Kellogg's
15.3. General Mills
15.4. Nature's
Bakery
15.5. Kind LLC
15.6. Quest
Nutrition
15.7. RxBar
15.8. Lärabar
15.9. PowerBar
15.10. Gatorade
15.11. ThinkThin
15.12. ZonePerfect
15.13. Bob's Red
Mill
15.14. ProBar
15.15. GoMacro
15.16. Kashi Company
15.17. Munk Pack
15.18. Health
Warrior
15.19. Bumble Bar
15.20. Vega
15.21. Other
Prominent Players
16. Research
Methodology
16.1.
External
Transportations / Databases
16.2.
Internal
Proprietary Database
16.3.
Primary
Research
16.4.
Secondary
Research
16.5.
Assumptions
16.6.
Limitations
16.7.
Report
FAQs
17. Research
Findings & Conclusion
Our Research Methodology
"Insight without rigor is just noise."
We follow a comprehensive, multi-phase research framework designed to deliver accurate, strategic, and decision-ready intelligence. Our process integrates primary and secondary research , both quantitative and qualitative , along with dual modeling techniques ( top-down and bottom-up) and a final layer of validation through our proprietary in-house repository.
PRIMARY RESEARCH
Primary research captures real-time, firsthand insights from the market to understand behaviors, motivations, and emerging trends.
1. Quantitative Primary Research
Objective: Generate statistically significant data directly from market participants.
Approaches:- Structured surveys with customers, distributors, and field agents
- Mobile-based data collection for point-of-sale audits and usage behavior
- Phone-based interviews (CATI) for market sizing and product feedback
- Online polling around industry events and digital campaigns
- Purchase frequency by customer type
- Channel performance across geographies
- Feature demand by application or demographic
2. Qualitative Primary Research
Objective: Explore decision-making drivers, pain points, and market readiness.
Approaches:- In-depth interviews (IDIs) with executives, product managers, and key decision-makers
- Focus groups among end users and early adopters
- Site visits and observational research for consumer products
- Informal field-level discussions for regional and cultural nuances
SECONDARY RESEARCH
This phase helps establish a macro-to-micro understanding of market trends, size, regulation, and competitive dynamics, sourced from credible and public domain information.
1. Quantitative Secondary Research
Objective: Model market value and segment-level forecasts based on published data.
Sources include:- Financial reports and investor summaries
- Government trade data, customs records, and regulatory statistics
- Industry association publications and economic databases
- Channel performance and pricing data from marketplace listings
- Revenue splits, pricing trends, and CAGR estimates
- Supply-side capacity and volume tracking
- Investment analysis and funding benchmarks
2. Qualitative Secondary Research
Objective: Capture strategic direction, innovation signals, and behavioral trends.
Sources include:- Company announcements, roadmaps, and product pipelines
- Publicly available whitepapers, conference abstracts, and academic research
- Regulatory body publications and policy briefs
- Social and media sentiment scanning for early-stage shifts
- Strategic shifts in market positioning
- Unmet needs and white spaces
- Regulatory triggers and compliance impact

DUAL MODELING: TOP-DOWN + BOTTOM-UP
To ensure robust market estimation, we apply two complementary sizing approaches:
Top-Down Modeling:- Start with broader industry value (e.g., global or regional TAM)
- Apply filters by segment, geography, end-user, or use case
- Adjust with primary insights and validation benchmarks
- Ideal for investor-grade market scans and opportunity mapping
- Aggregate from the ground up using sales volumes, pricing, and unit economics
- Use internal modeling templates aligned with stakeholder data
- Incorporate distributor-level or region-specific inputs
- Most accurate for emerging segments and granular sub-markets
DATA VALIDATION: IN-HOUSE REPOSITORY
We close the loop with proprietary data intelligence built from ongoing projects, industry monitoring, and historical benchmarking. This repository includes:
- Multi-sector market and pricing models
- Key trendlines from past interviews and forecasts
- Benchmarked adoption rates, churn patterns, and ROI indicators
- Industry-specific deviation flags and cross-check logic
- Catches inconsistencies early
- Aligns projections across studies
- Enables consistent, high-trust deliverables