
Events Industry Size and Forecast (2020 - 2033), Global and Regional Growth, Trend, Share and Industry Analysis Report Coverage; Type (Music Concert, Festivals, Sports, Exhibitions and Conferences, Corporate Events and Seminar, and Others), Revenue Source (Ticket Sale, Sponsorship, Food and Beverage, Advertising, Merchandise Sales, Membership Fees, Participation Fees, Media and Licensing Revenue, and Others), Organizer (Corporate, Sports, Education, Entertainment, and Others); Age Group (Below 20 Years, 21-40 Years, and Above 40 Years); Origin of Attendees (National, Continental, and Transcontinental); Event Location (Tier 1 Cities, Tier 2 Cities, and Tier 3 Cities); and Geography
2026-02-05
Consumer Products
Jaya Bundele (Research Analyst)
Description
Events
Industry Overview
The global events
industry is experiencing strong growth, driven by rapid digital transformation and
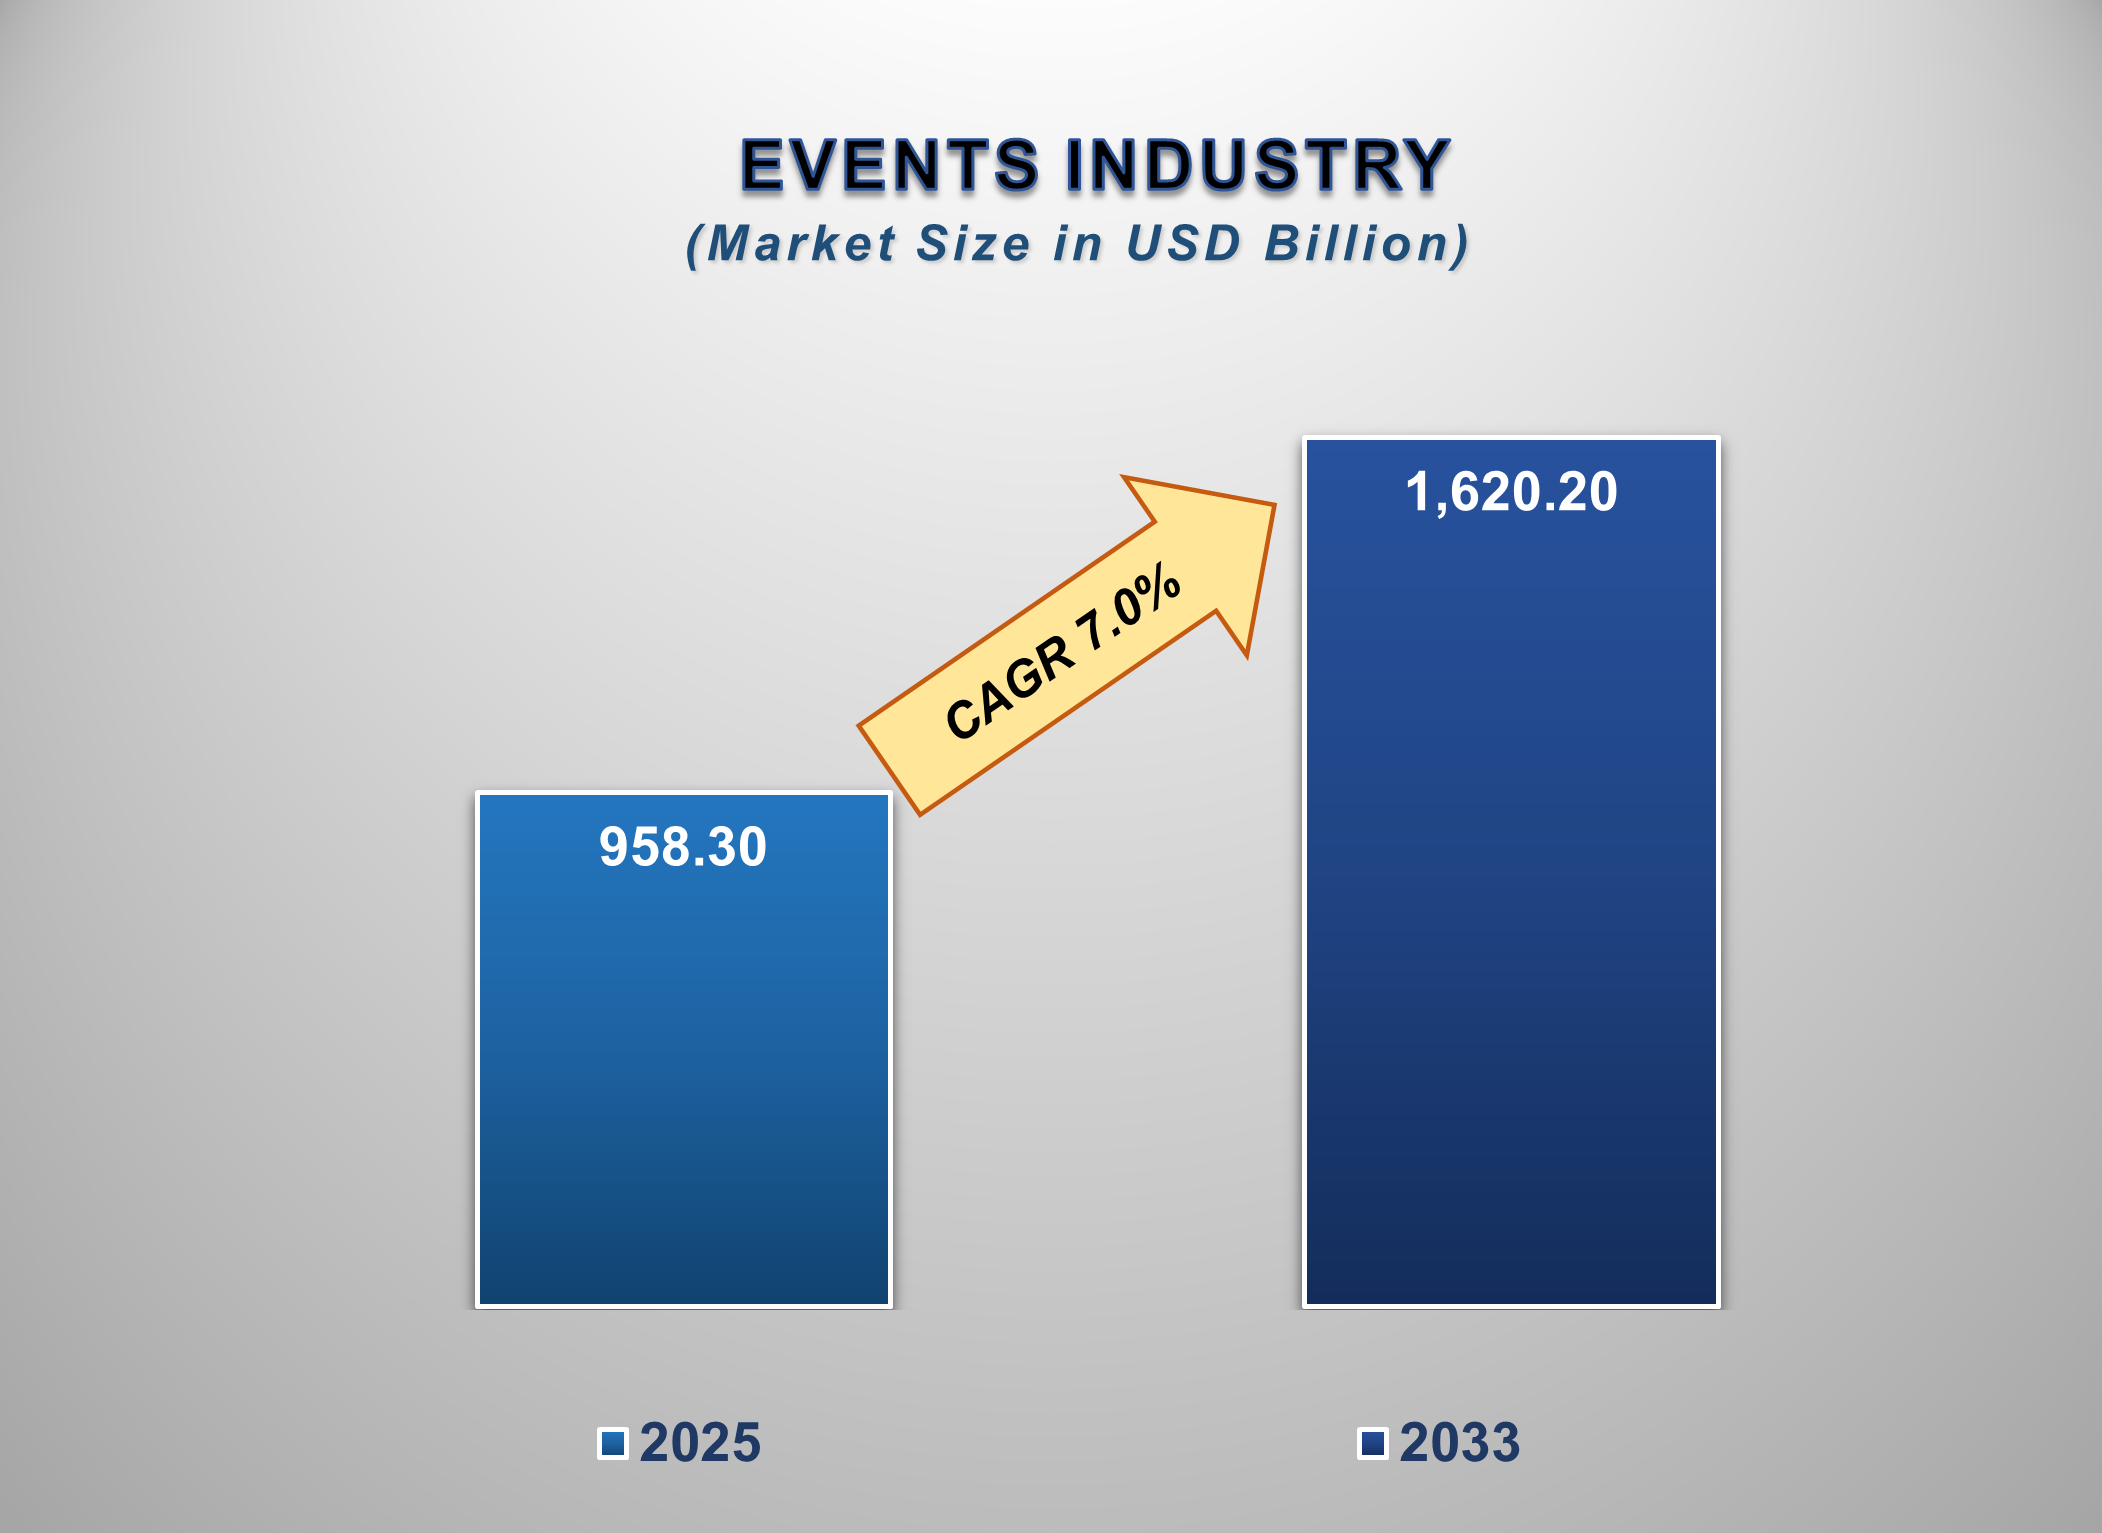
advancements in technology. Valued at USD 958.30 billion in 2025, the
market is projected to reach USD 1,620.20 billion by 2033, growing at a CAGR of
7.0% during the forecast period.
The planning,
organization, execution, and management of a broad range of events, including
corporate meetings, conferences, exhibitions, trade shows, concerts, festivals,
sporting events, weddings, and social gatherings, are all included in the
dynamic and diverse global events industry. Event planners, venue operators,
logistics companies, audiovisual firms, catering services, and digital event
technology platforms are among the many service providers that the sector
combines. The events industry has evolved significantly over the past decade,
moving from traditional in-person forms to hybrid and virtual models that make
use of modern digital technologies.
Following the
disruption caused by the COVID-19 pandemic, the industry has witnessed a strong
recovery. Growing demand for in-person contacts, brand experiences, and
large-scale events sped up industry expansion when limitations loosened. Events
are becoming more and more recognized by organizations as essential instruments
for revenue development, staff cooperation, customer engagement, and brand
growth. Growing corporate marketing and promotion expenditures, an increase in
business travel, and increased consumer spending on live events and
entertainment all contribute to the industry.
The global events
industry is projected to be worth several hundred billion dollars in 2025 and
is projected to develop at a robust compound annual growth rate through 2033.
Technology integration, corporate globalization, rising sponsorship
expenditures, and the spread of experiential marketing techniques across
sectors like technology, healthcare, education, sports, and entertainment are
the main drivers of growth.
Physical venues are
no longer the only option for the events sector. With their scalability, global
reach, cost efficiency, and data-driven insights, virtual and hybrid events
have become a crucial component of the market. Artificial intelligence (AI),
augmented reality (AR), virtual reality (VR), live streaming, and event
management software platforms are examples of innovative technologies that are
changing the way events are planned and executed. This allows event planners to
improve attendee engagement and more accurately assess return on investment.
Events
Industry Drivers and Opportunities
Growing Demand
for Corporate Events and Experiential Marketing
The growing need for corporate events and
experiential marketing campaigns is one of the main factors propelling
expansion in the global events sector. Companies across industries are making
significant investments in conferences, product launches, trade fairs,
exhibitions, and internal meetings in order to improve employee engagement,
build client relationships, and promote brand presence. Organizations see
events as high-impact venues to convey brand values, promote innovation, and
produce memorable consumer experiences in an increasingly competitive business
climate. Experiential marketing has become a major strategic concern,
especially in consumer-oriented industries like fast-moving consumer goods,
retail, automotive, and technology. Budgets for immersive, interactive events
that enable direct interaction with target audiences are replacing traditional
advertising. Experiential roadshows, pop-up events, and live brand activations
are becoming more popular because they can foster strong emotional bonds and
enduring brand loyalty. This trend is expected to sustain the high demand for
expert event management services around the world.
Expansion of Business
Travel and MICE Tourism
Another important aspect driving the events
industry is the rapid expansion of Meetings, Incentives, Conferences, and
Exhibitions (MICE) tourism. By making investments in large convention halls,
exhibition spaces, lodging, and transportation infrastructure, governments and
tourism boards around the globe are aggressively marketing their locations as
international event hubs. Major cities in Europe, the Middle East, and the Asia-Pacific
are establishing themselves as the go-to locations for international
exhibitions and conferences. International conferences and trade exhibitions
are becoming more frequent due to growing globalization and cross-border
economic activities. As businesses use travel-based incentives to boost
employee motivation and improve partner relationships, incentive travel
programs are likewise becoming more and more popular. The general growth
trajectory of the events industry is being reinforced by these trends, which
are producing significant revenue for venue operators, hospitality providers,
event organizers, and local economies.
Digital Transformation
and Technology Adoption
The events industry is changing as a result of
technological advancements that make planning, execution, and engagement more
effective. These days, end-to-end solutions for registration, ticketing,
attendee analytics, marketing automation, and post-event reporting are
available on event management software platforms. Artificial intelligence is
being utilized to enhance event scheduling, suggest networking possibilities,
and customize attendee experiences. By eliminating geographical restrictions
and lowering travel and venue rental expenses, the use of virtual and hybrid
event formats has opened up new growth prospects. Organizers looking to enhance
reach while preserving physical involvement are especially drawn to hybrid
events, which combine in-person and virtual components. Live streaming, virtual
exhibition booths, AR/VR experiences, and interactive polling tools are
examples of technologies that are becoming commonplace and opening up new
revenue sources for both technology companies and event planners.
Events Industry Scope
|
Report Attributes |
Description |
|
Market Size in
2025 |
USD 958.30
Billion |
|
Market Forecast
in 2033 |
USD 1,620.20
Billion |
|
CAGR % 2025-2033 |
7.0% |
|
Base Year |
2024 |
|
Historic Data |
2020-2024 |
|
Forecast Period |
2025-2033 |
|
Report USP |
Global events
industry market size and forecast analysis, event type and service-based
revenue assessment, corporate, MICE, and entertainment event insights,
virtual, hybrid and in-person event coverage, regional and country-level
market evaluation, competitive landscape and market share analysis,
sponsorship, ticketing and revenue stream assessment, event technology and
digital platform adoption trends, experiential marketing and brand activation
analysis, sustainability and green event practices, growth drivers,
challenges and opportunity mapping, strategic insights for event organizers
and industry stakeholders |
|
Segments Covered |
●
By Type ●
By
Revenue Source ●
By
Organizer ●
By Age
Group ●
By Origin
of Attendees ●
By Event
Location |
|
Regional Scope |
●
North
America ●
Europe ●
APAC ●
Latin
America ●
Middle
East and Africa |
|
Country Scope |
1)
U.S. 2)
Canada
3)
U.K. 4)
Germany
5)
France
6)
Italy 7)
Spain 8)
Switzerland
9)
China
10)
India
11)
Japan 12)
South
Korea 13)
Australia 14)
Mexico
15)
Brazil
16)
Argentina
17)
Saudi
Arabia 18)
UAE 19)
South
Africa |
Events Industry
Report Segmentation Analysis
The global events
industry analysis is segmented by Type, Revenue Source, Organizer, Age Group,
Origin of Attendees, Event Location, and Region.
The corporate
events and seminars segment dominated the market in 2025 and is projected to
grow at the highest CAGR during the forecast period.
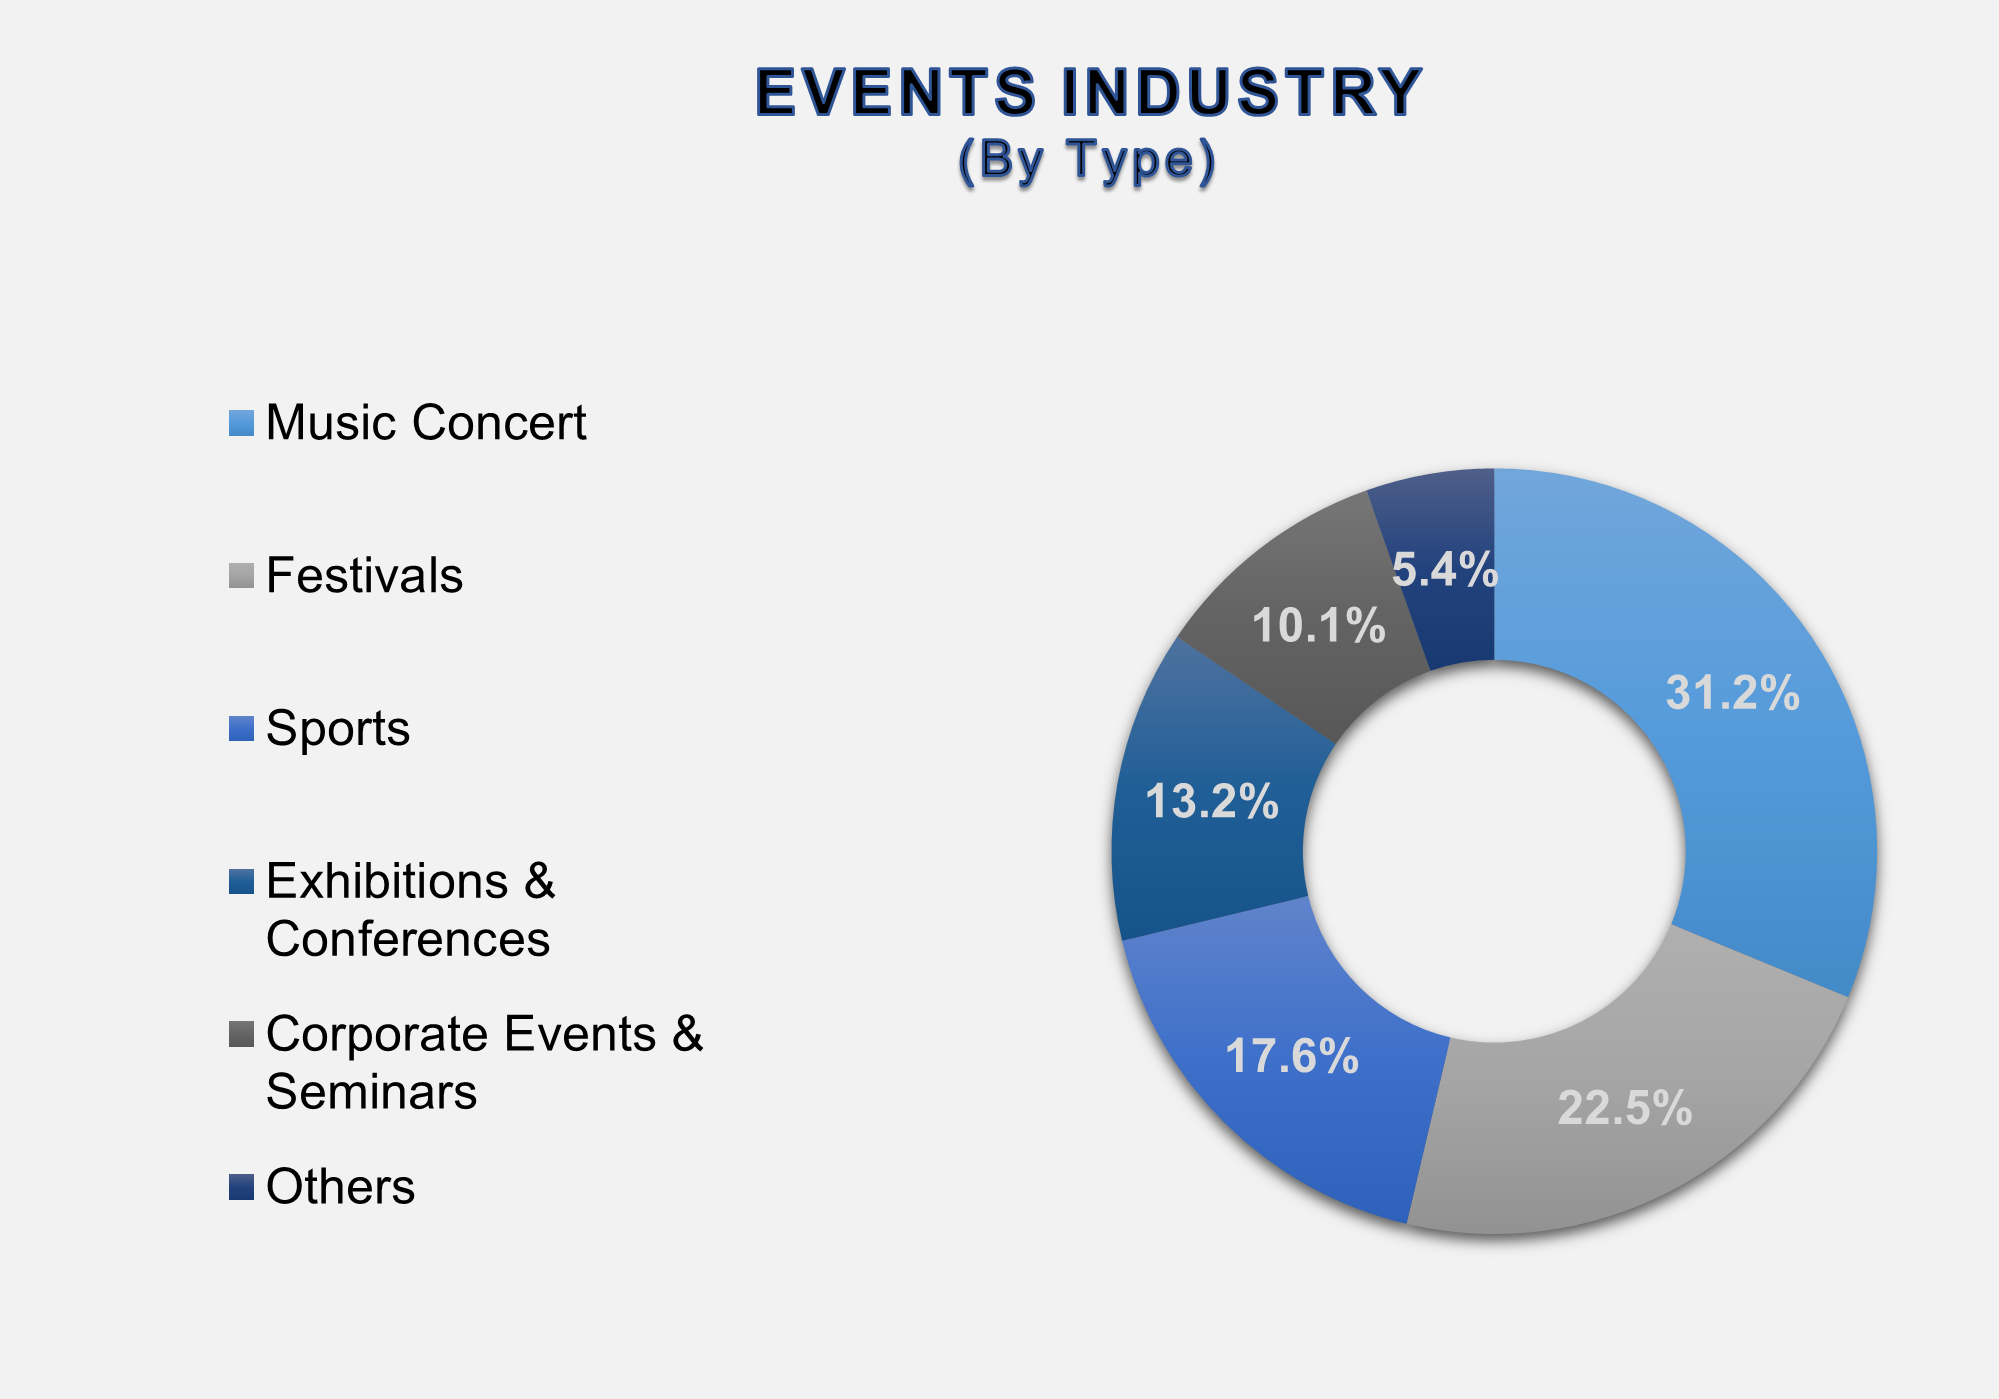
By Type, the Events
Industry is segmented into music concerts, festivals, sports, exhibitions &
conferences, corporate events & seminars, and others. Corporate events and
seminars account for the largest market share in the events industry due to
high spending by businesses and sponsors. Conferences, meetings, product
launches, exhibitions, and incentive programs are examples of corporate events
that encourage business networking, increase stakeholder engagement, boost
brand visibility, and advance marketing, training, and sales goals globally.
However, sports events are expected to grow at a higher CAGR during the
forecast period. Professional and amateur competitions, tournaments, leagues,
and championships are all included in sports events. These events attract huge
crowds, make money from ticket sales and sponsorships, improve fan interaction,
and advance travel, media attention, and community development on a global
scale.
Sponsorship holds
the highest share of the Revenue Source Segment over the forecast period
Based on revenue source, the market is bifurcated into Ticket Sales,
Sponsorship, Food and Beverage, Advertising, Merchandise Sales, Membership
Fees, Participation Fees, Media and Licensing Revenue, and Others. The
sponsorship segment accounts for the largest share of the market. The term
"sponsorship" describes strategic alliances in which companies
provide material or financial assistance for events in return for brand
association, audience participation, and marketing exposure. It is essential
for generating income since it allows event planners to improve event size,
quality, and reach while providing sponsors with quantifiable promotional
value.
The entertainment segment will probably dominate the market during the forecast
period
In terms of organizers,
the events industry is segmented into Corporate, Sports, Education,
Entertainment, and Others. The entertainment segment holds the largest share in
the events industry. Concerts, music festivals, cultural performances, and live
performances are examples of entertainment events that provide immersive
experiences, draw sizable crowds, make money from ticket sales and
sponsorships, and promote travel, media attention, and cultural involvement on
a worldwide scale.
21-40 Years hold the highest share of the Age Group
Segment over the forecast period
Based on age group,
the market is bifurcated into below 20 years, 21 to 40 years, and above 40 years.
The 21–40 years age group holds the highest share in the market. A significant
audience segment for the events industry, the 21–40 age group is distinguished
by high levels of social engagement, digital connectivity, and a strong
preference for brand-driven experiences, live entertainment, networking events,
and experiential activities. These traits are strengthened by rising disposable
incomes and active participation in corporate, cultural, and sporting events.
The national segment will probably dominate the market during the forecast
period
In terms of the origin
of attendees, the events industry is segmented into National, Continental, and
Transcontinental. The national segment holds the largest share in the events
industry. The geographic and cultural background of guests, both local and
foreign, refers to the geographic and cultural background of attendees. In
addition to having a significant impact on tourism, cross-border networking,
and global audience involvement, this element also affects event scalability,
content modification, language needs, marketing methods, and revenue potential.
Tier 1 Cities hold the highest share of the Event
Location Segment over the forecast period
Based on event
location, the market is bifurcated into Tier 1 Cities, Tier 2 Cities, and Tier
3 Cities. Tier 1 cities are significant urban centers with sophisticated
infrastructure, dense populations, and robust economies. Large-scale corporate,
entertainment, and international events are hosted by the events industry
because of their excellent venues, connections, hospitality capacity, trained
staff, and greater potential for sponsorship and audience spending.
The following
segments are part of an in-depth analysis of the global events industry:
|
Market Segments |
|
|
By
Type |
●
Music
Concert ●
Festivals ●
Sports ●
Exhibitions
and Conferences ●
Corporate
Events and Seminars ●
Others |
|
By
Revenue Source |
●
Ticket
Sale ●
Sponsorship ●
Food and
Beverage ●
Advertising ●
Merchandise
Sales ●
Membership
Fees ●
Participation
Fees ●
Media and
Licensing Revenue ●
Others |
|
By
Organizer |
●
Corporate ●
Sports ●
Education ●
Entertainment ●
Others |
|
By Age
Group |
●
Below 20
Years ●
21 to 40
Years ●
Above 40
Years |
|
By
Origin of Attendees |
●
National ●
Continental ●
Transcontinental |
|
By
Event Location |
●
Tier 1
Cities ●
Tier 2
Cities ●
Tier 3
Cities |
Events Industry Share Analysis by Region
The Europe region
is projected to hold the largest share of the global events industry over the
forecast period.
Europe leads the
global events industry and is also expected to be the fastest-growing region
throughout the forecast period. The Europe region is a mature and
well-established market within the global events industry with a robust
corporate presence, innovative facilities, and a diverse cultural backdrop.
Every year, a large number of international conferences, exhibits, trade shows,
cultural festivals, and athletic events are held in nations including Germany,
the UK, France, Italy, and Spain. Europe leads the world in the MICE industry
due to corporate travel, international trade, and government backing for
tourism and event promotion. Additionally, the region shows a high uptake of
digital ticketing, hybrid event forms, and sustainable practices. The quality,
scope, and international appeal of events throughout the area are further
improved by Europe's rich sponsorship economy, varied cultural legacy, and
legislative emphasis on environmental and safety requirements.
Global Events Industry Recent Developments
News:
●
In December
2025, Bending Spoons agreed to acquire Eventbrite for approximately $500
million, aiming to revitalize the ticketing and events platform under its
technology portfolio.
●
In June 2025,
Zoho announced a strategic partnership with Whova to integrate CRM with
event-management solutions, enhancing attendee data insights and engagement
tools.
●
In May 2025,
Cvent acquired PlanHero to strengthen its event-planning workflow and
hybrid-event capabilities, enhancing its software portfolio for global event
management.
●
In January
2025, DRPG Group accelerated its North American expansion by acquiring The
Special Event Company and UK agency OWB, broadening creative production
capabilities.
The
Global Events industry is dominated by a few large companies, such as
●
Live Nation
Entertainment
●
Freeman
●
Informa PLC
●
Reed
Exhibitions (Reed Elsevier Group)
●
Messe
Frankfurt
●
Tarsus Group
●
GL Events
●
The
Experiential Marketing Firm (EMF)
●
MCI Group
●
Cvent
●
Hubb
●
Eventbrite
●
ASM Global
●
SMG (now
merged under ASM Global)
●
Lagardère
Sports and Entertainment
●
SXM (Social
Experience Management)
●
BCD Meetings
& Events
●
GES (Global
Experience Specialists)
●
Comexposium
● UBM (now part of Informa Group)
Frequently Asked Questions
Jaya Bundele (Research Analyst)
Jaya Bundele is a skilled Research Analyst with 4+ years of experience in market intelligence, consumer insights, competitive analysis, and industry forecasting across the consumer goods, agriculture, and food & beverage sectors. She specializes in market sizing, trend analysis, growth opportunity mapping, and strategic secondary research for global and regional markets.
Her expertise lies in transforming complex industry data into actionable business strategies that help organizations identify emerging trends, understand customer behavior, and gain a competitive edge. With a strong focus on data-driven insights, business intelligence, and future market trends, Jaya delivers high-quality research solutions aligned with evolving industry demands and market dynamics.
1.
Global Events Industry Introduction and Market Overview
1.1.
Objectives of the Study
1.2.
Global Events Industry Scope and Market Estimation
1.2.1.Global Events
Overall Market Size (US$ Bn), Market CAGR (%), Market forecast (2025 - 2033)
1.2.2.Global Events
Industry Revenue Share (%) and Growth Rate (Y-o-Y) from 2020 - 2033
1.3.
Market Segmentation
1.3.1.Type of
Global Events industry
1.3.2.Revenue
Source of Global Events Industry
1.3.3.Organizer of
Global Events Industry
1.3.4.Age Group of
Global Events Industry
1.3.5.Origin of
Attendees of Global Events Industry
1.3.6.Event
Location of Global Events Industry
1.3.7.Region of
Global Events Industry
2.
Executive
Summary
2.1.
Demand Side Trends
2.2.
Key Market Trends
2.3.
Market Demand (US$ Bn) Analysis 2020 – 2024 and Forecast, 2025 – 2033
2.4.
Demand and Opportunity Assessment
2.5.
Market Dynamics
2.5.1.Drivers
2.5.2.Limitations
2.5.3.Opportunities
2.5.4.Impact
Analysis of Drivers and Restraints
2.6.
Porter’s Five Forces Analysis
2.7.
PEST Analysis
2.8.
Key Regulation
2.9.
Key Developments
2.10. Value
Chain / Ecosystem Analysis
3.
Global
Events Industry Estimates & Historical Trend Analysis (2020 - 2024)
4. Global Events Industry Estimates & Forecast Trend Analysis, by Type
4.1.
Global Events Industry Revenue (US$ Bn) Estimates and Forecasts,
by Type, 2020 - 2033
4.1.1.Music
concerts
4.1.2.Festivals
4.1.3.Sports
4.1.4.Exhibitions
& conferences
4.1.5.Corporate
events & seminars
4.1.6.Others
5. Global Events Industry Estimates & Forecast Trend Analysis, by Revenue Source
5.1.
Global Events Industry Revenue (US$ Bn) Estimates and Forecasts,
by Revenue Source, 2020 - 2033
5.1.1.Ticket
Sale
5.1.2.Sponsorship
5.1.3.Food and
Beverage
5.1.4.Advertising
5.1.5.Merchandise
Sales
5.1.6.Membership
Fees
5.1.7.Participation
Fees
5.1.8.Media and
Licensing Revenue
5.1.9.Others
6. Global Events Industry Estimates & Forecast Trend Analysis, by Organizer
6.1.
Global Events Industry Revenue (US$ Bn) Estimates and Forecasts,
by Organizer, 2020 - 2033
6.1.1.Corporate
6.1.2.Sports
6.1.3.Education
6.1.4.Entertainment
6.1.5.Others
7. Global Events Industry Estimates & Forecast Trend Analysis, by Age Group
7.1.
Global Events Industry Revenue (US$ Bn) Estimates and Forecasts,
by Age Group, 2020 - 2033
7.1.1.Below 20
Years
7.1.2.21-40
Years
7.1.3.Above 40
Years
8. Global Events Industry Estimates & Forecast Trend Analysis, by Origin of Attendee
8.1.
Global Events Industry Revenue (US$ Bn) Estimates and Forecasts,
by Origin of Attendee, 2020 - 2033
8.1.1.National
8.1.2.Continental
8.1.3.Transcontinental
9. Global Events Industry Estimates & Forecast Trend Analysis, by Event Location
9.1.
Global Events Industry Revenue (US$ Bn) Estimates and Forecasts,
by Event Location, 2020 - 2033
9.1.1.Tier 1
Cities
9.1.2.Tier 2
Cities
9.1.3.Tier 3
Cities
10.
Global
Events Industry Estimates & Forecast Trend Analysis, by Region
1.1.
Global Events Industry Revenue (US$ Bn) Estimates and Forecasts,
by Region, 2020 - 2033
1.1.1.North America
1.1.2.Europe
1.1.3.Asia Pacific
1.1.4.Middle East
& Africa
1.1.5.Latin America
11.
North America Events
Industry: Estimates & Forecast
Trend Analysis
11.1.
North America Events Industry Assessments & Key Findings
11.1.1.
North America Events Industry Introduction
11.1.2.
North America Events Industry Size Estimates and Forecast (US$ Billion)
(2020 - 2033)
11.1.2.1. By Type
11.1.2.2. By Revenue Source
11.1.2.3. By Organizer
11.1.2.4. By Age Group
11.1.2.5. By Origin of Attendees
11.1.2.6. By Event Location
11.1.2.7.
By Country
11.1.2.7.1. The
U.S.
11.1.2.7.2. Canada
12.
Europe Events
Industry: Estimates & Forecast
Trend Analysis
12.1. Europe
Events Industry Assessments & Key Findings
12.1.1.
Europe Events Industry Introduction
12.1.2.
Europe Events Industry Size Estimates and Forecast (US$ Billion) (2020
- 2033)
12.1.2.1. By Type
12.1.2.2. By Revenue Source
12.1.2.3. By Organizer
12.1.2.4. By Age Group
12.1.2.5. By Origin of Attendees
12.1.2.6. By Event Location
12.1.2.7.
By Country
12.1.2.7.1.
Germany
12.1.2.7.2.
Italy
12.1.2.7.3.
U.K.
12.1.2.7.4.
France
12.1.2.7.5.
Spain
12.1.2.7.6.
Russia
12.1.2.7.7. Rest of Europe
13.
Asia Pacific Events
industry: Estimates & Forecast
Trend Analysis
13.1. Asia
Pacific Events Industry Assessments & Key Findings
13.1.1.
Asia Pacific Events Industry Introduction
13.1.2.
Asia Pacific Events Industry Size Estimates and Forecast (US$ Billion)
(2020 - 2033)
13.1.2.1. By Type
13.1.2.2. By Revenue Source
13.1.2.3. By Organizer
13.1.2.4. By Age Group
13.1.2.5. By Origin of Attendees
13.1.2.6. By Event Location
13.1.2.7.
By Country
13.1.2.7.1.
China
13.1.2.7.2.
Japan
13.1.2.7.3.
India
13.1.2.7.4.
Australia
13.1.2.7.5.
South Korea
13.1.2.7.6. Rest
of Asia Pacific
14.
Middle East & Africa Events Industry: Estimates
& Forecast Trend Analysis
14.1. Middle
East & Africa Events Industry Assessments & Key Findings
14.1.1.
Middle East & Africa Events
Industry Introduction
14.1.2.
Middle East & Africa Events
Industry Size Estimates and Forecast (US$ Billion) (2020 - 2033)
14.1.2.1. By Type
14.1.2.2. By Revenue Source
14.1.2.3. By Organizer
14.1.2.4. By Age Group
14.1.2.5. By Origin of Attendees
14.1.2.6. By Event Location
14.1.2.7.
By Country
14.1.2.7.1.
UAE
14.1.2.7.2.
Saudi Arabia
14.1.2.7.3.
South Africa
14.1.2.7.4. Rest of MEA
15.
Latin America Events
Industry: Estimates & Forecast
Trend Analysis
15.1. Latin
America Event Industry Assessments & Key Findings
15.1.1.
Latin America Events Industry Introduction
15.1.2.
Latin America Events Industry Size Estimates and Forecast (US$ Billion)
(2020 - 2033)
15.1.2.1. By Type
15.1.2.2. By Revenue Source
15.1.2.3. By Organizer
15.1.2.4. By Age Group
15.1.2.5. By Origin of Attendees
15.1.2.6. By Event Location
15.1.2.7.
By Country
15.1.2.7.1.
Brazil
15.1.2.7.2.
Mexico
15.1.2.7.3.
Argentina
15.1.2.7.4. Rest of LATAM
16.
Country Wise Market: Introduction
17. Competition
Landscape
17.1. Global
Events Industry Product Mapping
17.2. Global
Events Industry Concentration Analysis, by Leading Players / Innovators /
Emerging Players / New Entrants
17.3. Global
Events Industry Tier Structure Analysis
17.4. Global
Events Industry Concentration & Company Market Shares (%) Analysis, 2024
18. Company
Profiles
18.1. Live
Nation Entertainment
18.1.1.
Company Overview & Key Stats
18.1.2.
Financial Performance & KPIs
18.1.3.
Product Portfolio
18.1.4.
SWOT Analysis
18.1.5.
Business Strategy & Recent Developments
*
Similar details would be provided for all the players mentioned below
18.2.
Freeman
18.3.
Informa PLC
18.4.
Reed Exhibitions (Reed Elsevier Group)
18.5.
Messe Frankfurt
18.6.
Tarsus Group
18.7.
GL Events
18.8.
The Experiential Marketing Firm (EMF)
18.9.
MCI Group
18.10.
Cvent
18.11.
Hubb
18.12.
Eventbrite
18.13.
ASM Global
18.14.
SMG (now merged under ASM Global)
18.15.
Lagardère Sports and Entertainment
18.16.
SXM (Social Experience Management)
18.17.
BCD Meetings & Events
18.18.
GES (Global Experience Specialists)
18.19.
Comexposium
18.20.
UBM (now part of Informa Group)
18.21.
Other Prominent Players
19.
Research
Methodology
19.1. External
Transportations / Databases
19.2. Internal
Proprietary Database
19.3. Primary
Research
19.4. Secondary
Research
19.5. Assumptions
19.6. Limitations
19.7. Report
FAQs
20.
Research
Findings & Conclusion
Our Research Methodology
"Insight without rigor is just noise."
We follow a comprehensive, multi-phase research framework designed to deliver accurate, strategic, and decision-ready intelligence. Our process integrates primary and secondary research , both quantitative and qualitative , along with dual modeling techniques ( top-down and bottom-up) and a final layer of validation through our proprietary in-house repository.
PRIMARY RESEARCH
Primary research captures real-time, firsthand insights from the market to understand behaviors, motivations, and emerging trends.
1. Quantitative Primary Research
Objective: Generate statistically significant data directly from market participants.
Approaches:- Structured surveys with customers, distributors, and field agents
- Mobile-based data collection for point-of-sale audits and usage behavior
- Phone-based interviews (CATI) for market sizing and product feedback
- Online polling around industry events and digital campaigns
- Purchase frequency by customer type
- Channel performance across geographies
- Feature demand by application or demographic
2. Qualitative Primary Research
Objective: Explore decision-making drivers, pain points, and market readiness.
Approaches:- In-depth interviews (IDIs) with executives, product managers, and key decision-makers
- Focus groups among end users and early adopters
- Site visits and observational research for consumer products
- Informal field-level discussions for regional and cultural nuances
SECONDARY RESEARCH
This phase helps establish a macro-to-micro understanding of market trends, size, regulation, and competitive dynamics, sourced from credible and public domain information.
1. Quantitative Secondary Research
Objective: Model market value and segment-level forecasts based on published data.
Sources include:- Financial reports and investor summaries
- Government trade data, customs records, and regulatory statistics
- Industry association publications and economic databases
- Channel performance and pricing data from marketplace listings
- Revenue splits, pricing trends, and CAGR estimates
- Supply-side capacity and volume tracking
- Investment analysis and funding benchmarks
2. Qualitative Secondary Research
Objective: Capture strategic direction, innovation signals, and behavioral trends.
Sources include:- Company announcements, roadmaps, and product pipelines
- Publicly available whitepapers, conference abstracts, and academic research
- Regulatory body publications and policy briefs
- Social and media sentiment scanning for early-stage shifts
- Strategic shifts in market positioning
- Unmet needs and white spaces
- Regulatory triggers and compliance impact

DUAL MODELING: TOP-DOWN + BOTTOM-UP
To ensure robust market estimation, we apply two complementary sizing approaches:
Top-Down Modeling:- Start with broader industry value (e.g., global or regional TAM)
- Apply filters by segment, geography, end-user, or use case
- Adjust with primary insights and validation benchmarks
- Ideal for investor-grade market scans and opportunity mapping
- Aggregate from the ground up using sales volumes, pricing, and unit economics
- Use internal modeling templates aligned with stakeholder data
- Incorporate distributor-level or region-specific inputs
- Most accurate for emerging segments and granular sub-markets
DATA VALIDATION: IN-HOUSE REPOSITORY
We close the loop with proprietary data intelligence built from ongoing projects, industry monitoring, and historical benchmarking. This repository includes:
- Multi-sector market and pricing models
- Key trendlines from past interviews and forecasts
- Benchmarked adoption rates, churn patterns, and ROI indicators
- Industry-specific deviation flags and cross-check logic
- Catches inconsistencies early
- Aligns projections across studies
- Enables consistent, high-trust deliverables