
Geothermal Power Market Size and Forecast (2020 - 2033), Global and Regional Growth, Trend, Share, and Industry Analysis Report Coverage; Power Station Type (Dry Steam Power Stations, Flash Steam Power Stations, and Binary Cycle Power Stations), End Use (Residential, Commercial, Industrial, and Others), and Geography
2026-02-04
Energy & Power
Ekta Chaurasia (Team Lead)
Description
Geothermal
Power Market Overview
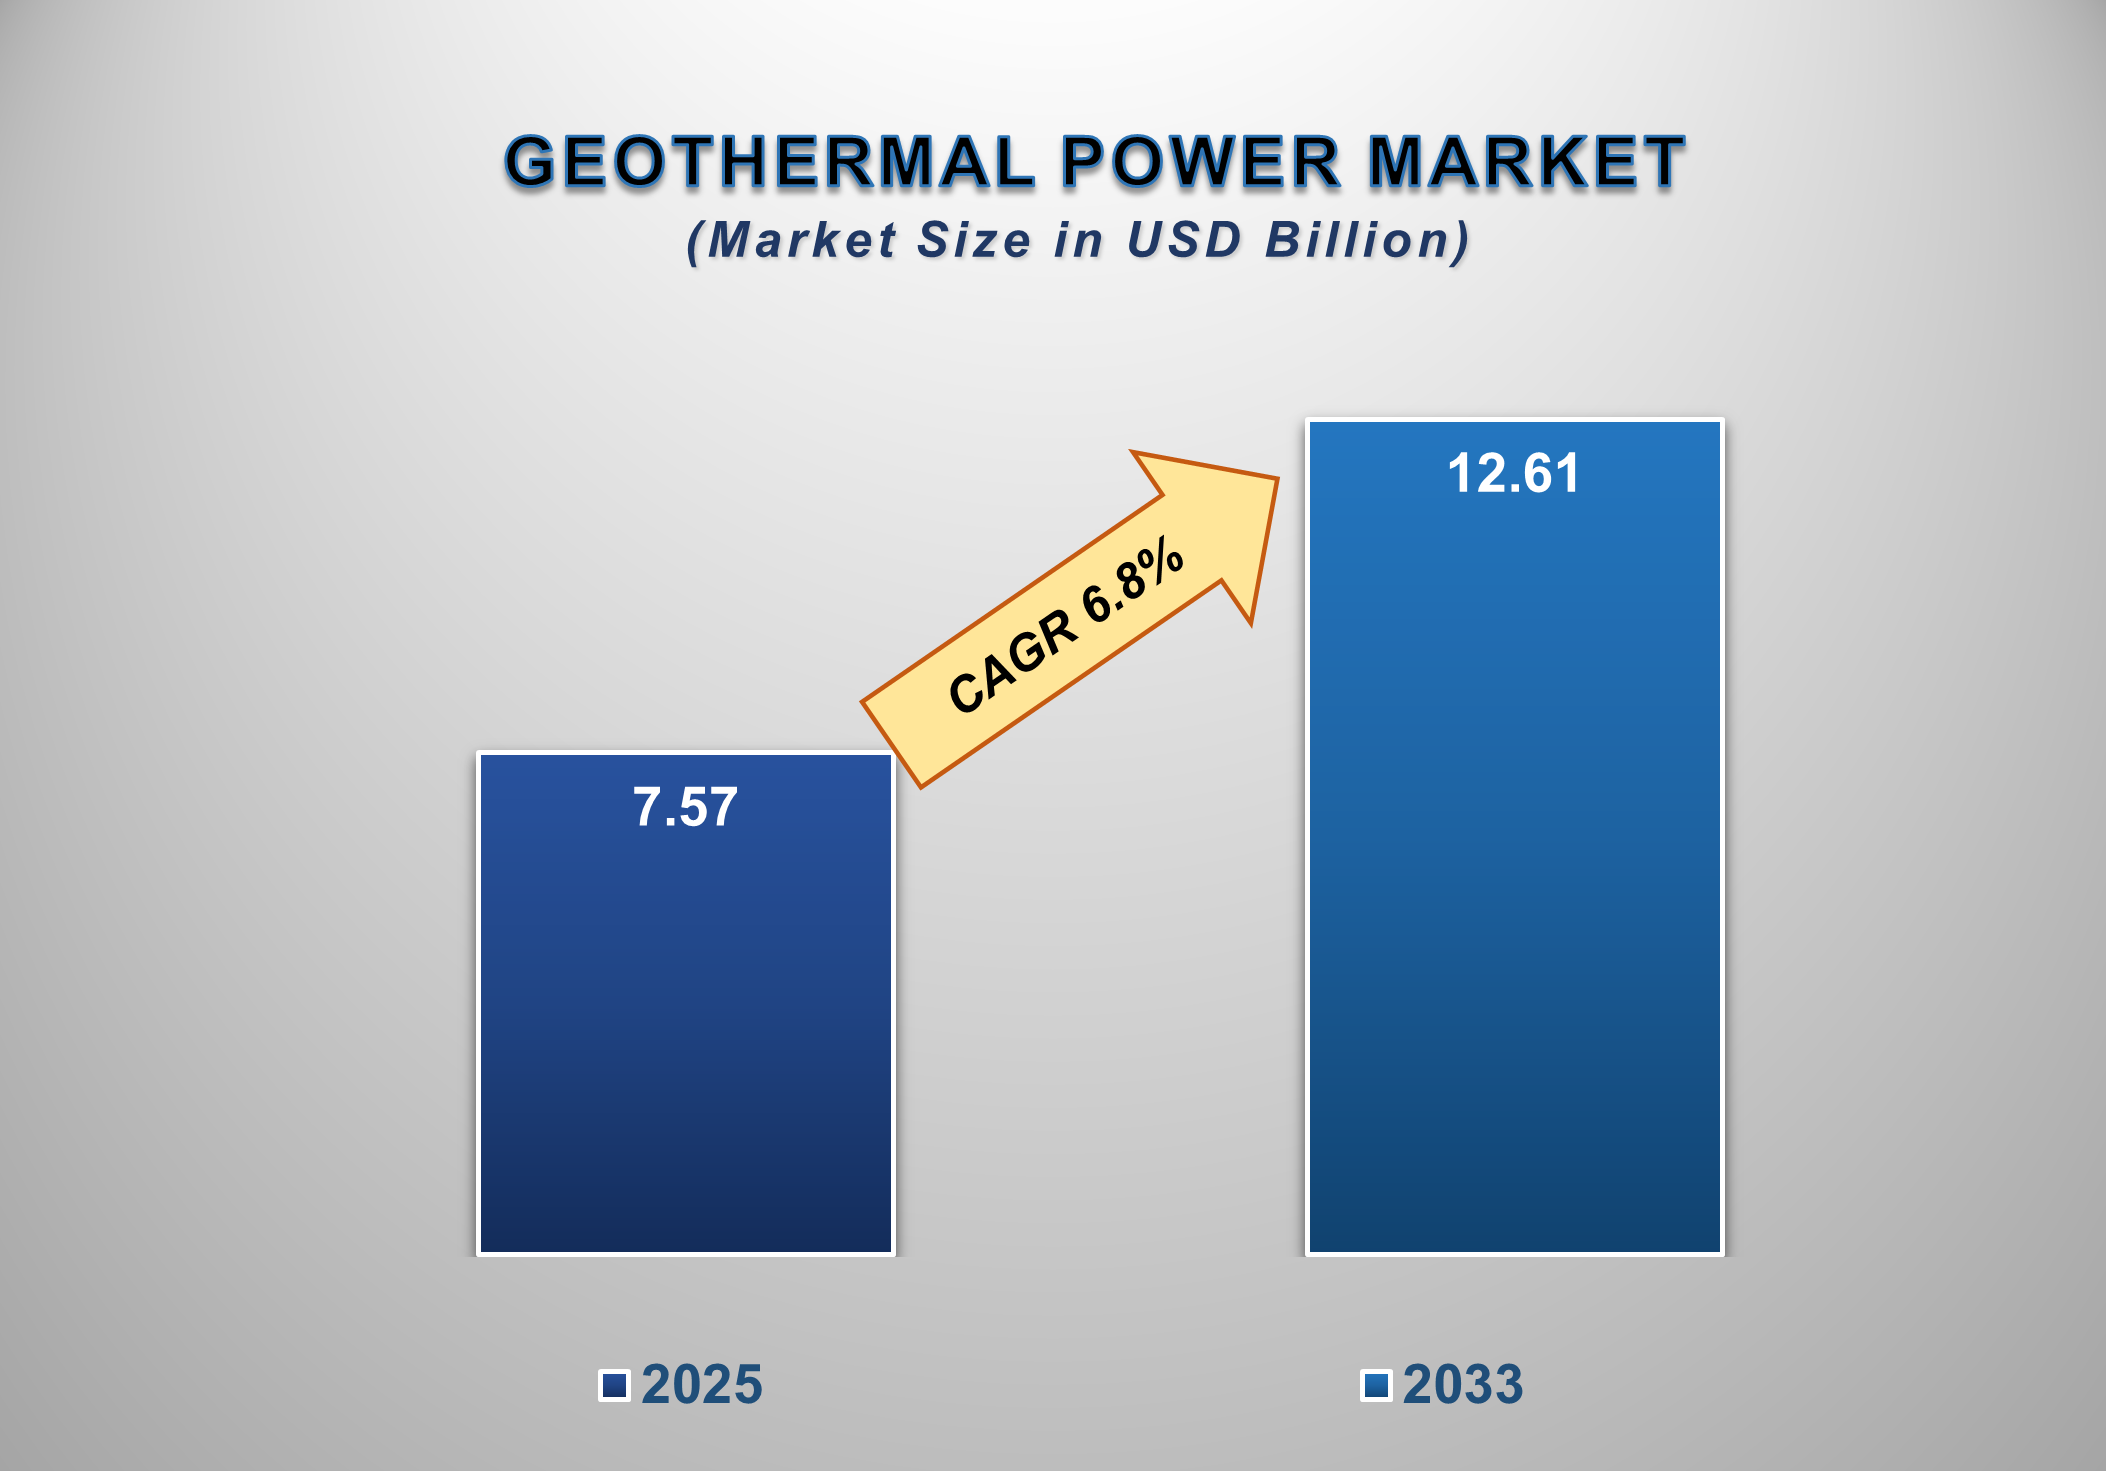
The global geothermal power market is experiencing strong growth, driven by the growing demand for clean, reliable, and low-carbon energy. Valued at USD 7.57 billion in 2025, the market is projected to reach USD 12.61 billion by 2033, growing at a CAGR of 6.8% during the forecast period.
The geothermal power market, which provides a dependable,
low-carbon, baseload source of electricity, is an important part of the world's
renewable energy landscape. Since geothermal energy is not weather-dependent
like solar and wind power, it is essential for grid stability and long-term
energy security. Dry steam, flash steam, and binary cycle power plants are some
of the technologies that use heat from the Earth's interior to create
electricity.
Growing demand for renewable energy, favorable government
regulations, and plans to reduce greenhouse gas emissions are driving the
industry globally. The majority of installed geothermal capacity is found in
countries along tectonic plate boundaries or volcanic regions, such as the
United States, Indonesia, the Philippines, Kenya, Iceland, and New Zealand,
because of the availability of suitable resources. Flash steam power plants
currently account for the majority of plant technologies, followed by binary
cycle plants, which are becoming more popular due to their ability to utilize
low-temperature geothermal resources and their low environmental impact.
Technological developments are essential to the growth of
the market. Organic Rankine Cycle (ORC) systems, reservoir management, and
drilling techniques have all enhanced efficiency and decreased costs.
Furthermore, Enhanced Geothermal Systems (EGS) are showing promise as a way to
enable geothermal development in areas without hydrothermal resources.
The geothermal power market has drawbacks despite its
benefits, such as high initial capital costs, hazards associated with
exploration, lengthy project development schedules, and site-specific
constraints. Careful management is also necessary for environmental issues,
including land use and induced seismicity. Long plant lifespans, low operating
costs, and steady power generation, however, frequently overcome these
obstacles over time.
The market for geothermal power is anticipated to increase
steadily in the future as nations promote energy resilience and diversify their
energy mix. The implementation of geothermal energy is expected to be
accelerated by increased investment, international cooperation, and favorable
regulatory frameworks, placing it as a major player in the global shift toward
dependable and sustainable power generation.
Geothermal
Power Market Drivers and Opportunities
Growing Demand for Clean
and Reliable Energy
The growing need for clean, dependable, low-carbon
electricity around the world is one of the main factors propelling the
geothermal power market. Geothermal energy offers a special benefit as a
baseload renewable resource that operates constantly regardless of weather
conditions as nations strive to meet climate targets and reduce reliance on
fossil fuels. As an example of how geothermal power can serve national
decarbonization goals while maintaining energy security, Iceland produces a
significant amount of its electricity and heating from geothermal energy.
Government Policies and Regulatory Support
The growth of the geothermal market is being accelerated by
favorable government regulations and incentives. These consist of
risk-mitigation funds, tax credits, feed-in tariffs, and concessional finance
for drilling and exploration. Federal tax incentives and Department of Energy
research and development funds are available for geothermal projects in the
United States. In a similar vein, Indonesia and Kenya have implemented
legislative frameworks that encourage private participation in geothermal exploration,
lowering project risks in the early stages and enhancing bankability.
Technological Advancements in Geothermal Systems
Geothermal technology advancements are greatly enhancing
project viability and cost-effectiveness. Power generation from low-temperature
resources that were previously thought to be unprofitable has been made
possible by advancements in drilling methods, reservoir modeling, and binary
cycle power plants. For example, binary cycle plants are frequently employed in
Nevada, USA, where geothermal resources with moderate temperatures are
abundant. Additionally, by enabling geothermal development in non-volcanic areas
through engineered reservoirs, Enhanced Geothermal Systems (EGS) offer a
significant opportunity.
Increasing Energy Security and Grid Stability Needs
By lowering dependency on imported fuels and offering
steady, long-term electricity output, geothermal power promotes energy
security. This is especially crucial for developing economies and island
states. One of the biggest geothermal producers in the world, the Philippines,
uses geothermal energy to stabilize electricity rates and reduce reliance on
fuel imports. By guaranteeing a steady supply, geothermal power performs a
complementary function as grids include larger percentages of intermittent renewable
energy sources like solar and wind.
Expanding Applications Beyond Power Generation
Geothermal energy offers prospects in direct-use
applications, industrial operations, and district heating in addition to power
generation. In an effort to decarbonize urban heat supply, European nations
like France and Germany are increasing the use of geothermal district heating
systems. Co-generation of power and heat increases market potential and
enhances project economics, particularly in colder climates.
Emerging Markets and Private Sector Participation
There is significant untapped geothermal potential in
emerging countries in Latin America, Africa, and Southeast Asia. New
opportunities are being made possible by the increased involvement of private
developers, which is being supported by international organizations like the
World Bank. The Olkaria geothermal complex in Kenya, for instance, serves as an
example of how public-private cooperation may expand geothermal capacity while
fostering economic growth.
Geothermal Power Market Scope
|
Report Attributes |
Description |
|
Market Size in 2025 |
USD 7.57 Billion |
|
Market Forecast in 2033 |
USD 12.61 Billion |
|
CAGR % 2025-2033 |
6.8% |
|
Base Year |
2024 |
|
Historic Data |
2020-2024 |
|
Forecast Period |
2025-2033 |
|
Report USP |
Comprehensive global
geothermal power market size and forecast analysis, product type and
technology assessment, distribution channel evaluation, end-user consumption
trends, power generation capacity and installation performance evaluation,
regional and country-level market insights, competitive landscape and market
share analysis, technological advancements in geothermal systems and drilling
technologies, digital transformation and data analytics impact, growth
drivers, challenges, opportunities, and strategic insights for geothermal
developers, equipment suppliers, utilities, and investors. |
|
Segments Covered |
●
By Power Station
Type ●
By End Use |
|
Regional Scope |
●
North America ●
Europe ●
APAC ●
Latin America ●
Middle East and
Africa |
|
Country Scope |
1)
U.S. 2)
Canada 3)
U.K. 4)
Germany 5)
France 6)
Italy 7)
Spain 8)
Switzerland 9)
China 10)
India 11)
Japan 12)
South Korea 13)
Australia 14)
Mexico 15)
Brazil 16)
Argentina 17)
Saudi Arabia 18)
UAE 19)
South Africa |
Geothermal Power Market
Report Segmentation Analysis
The global geothermal power
market analysis is segmented by Power Station Type, End Use, and Region.
The Binary Power Cycle
Stations segment dominated the market in 2025 and is projected to grow at the
highest CAGR during the forecast period.
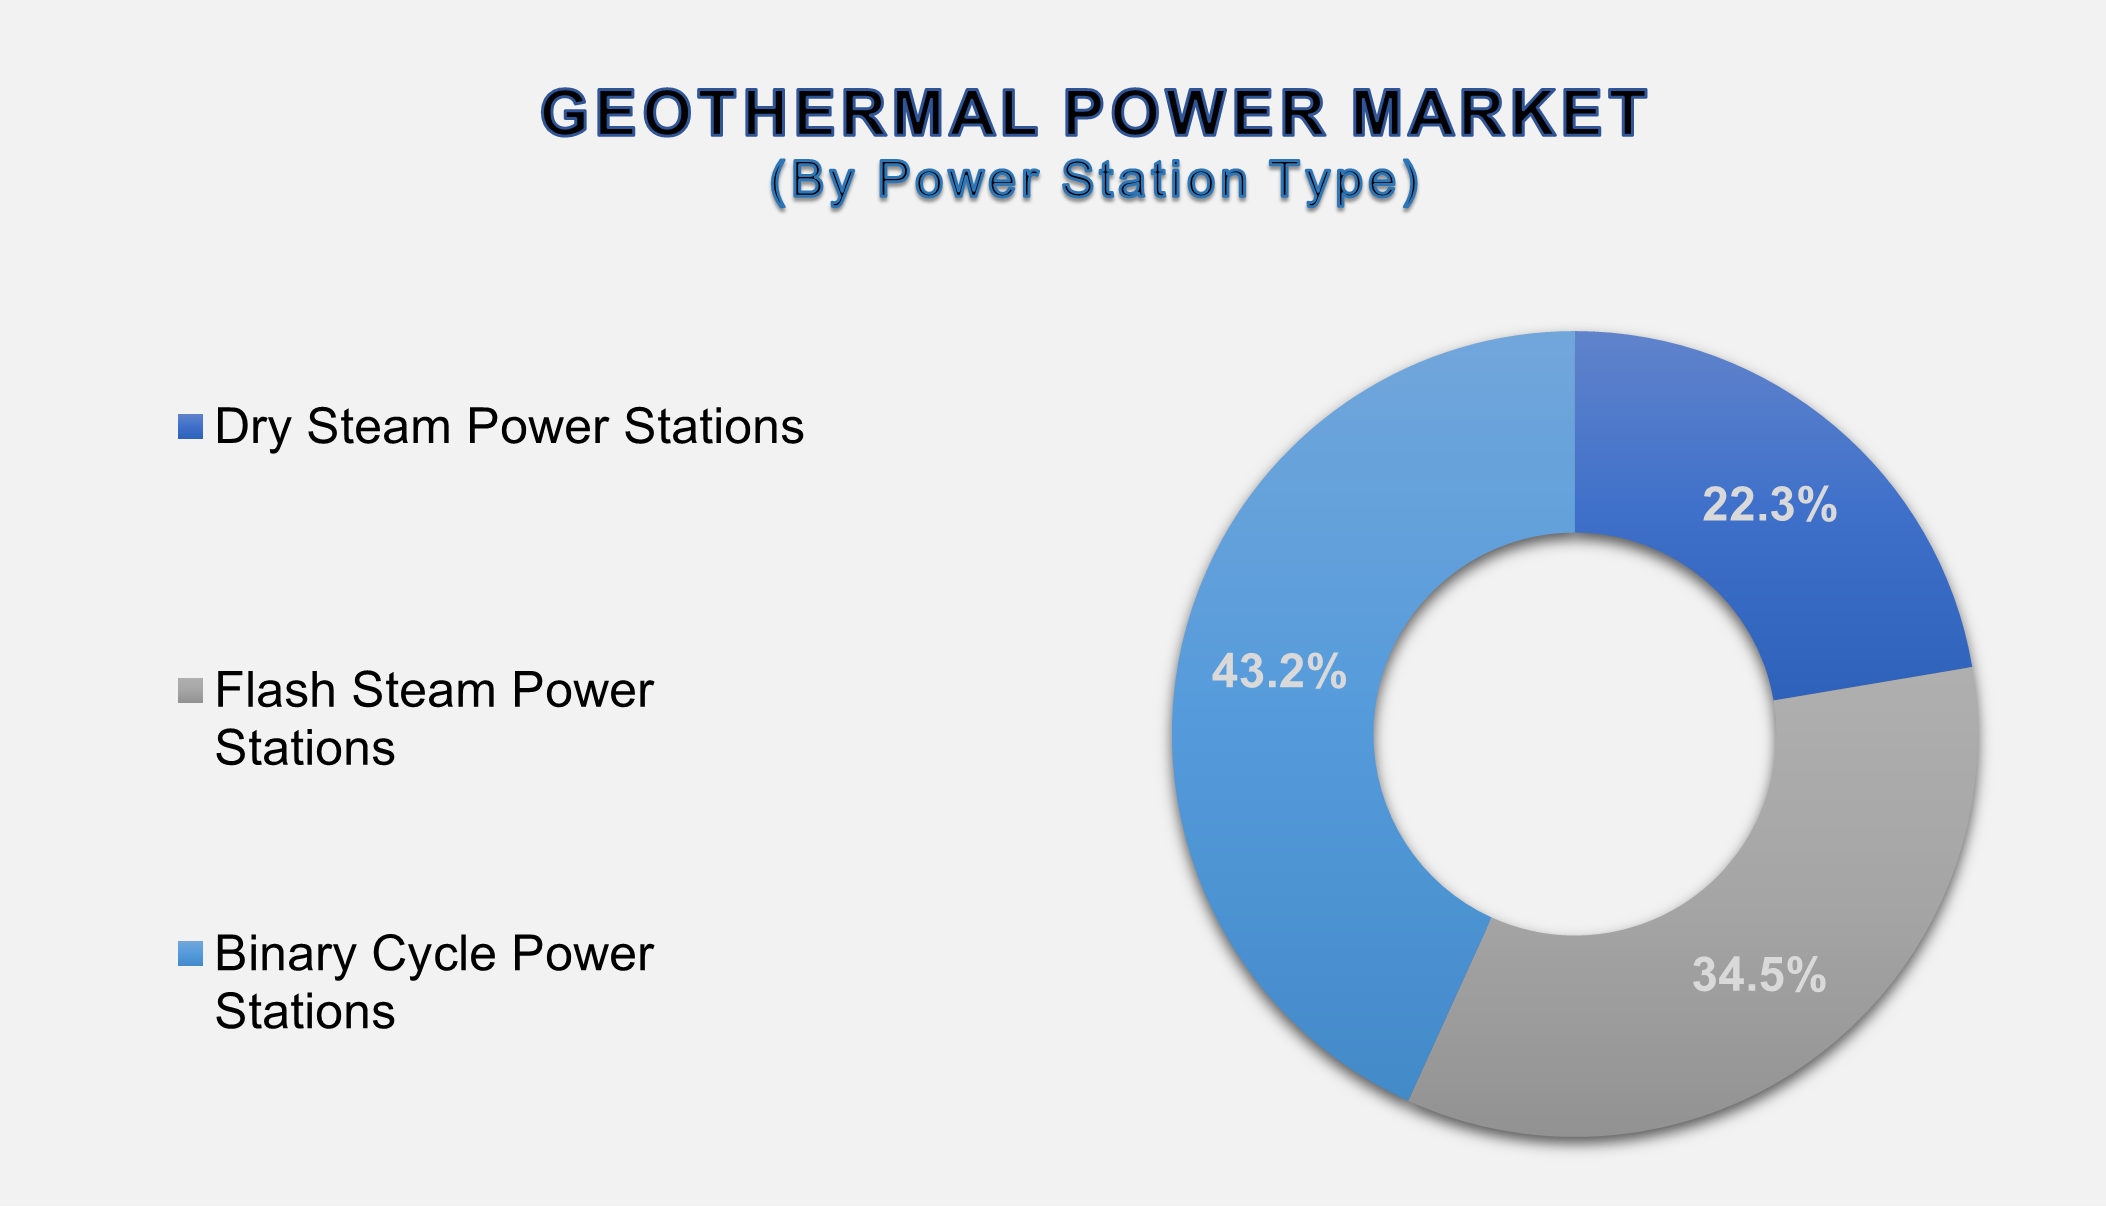
By Product Type, the geothermal
power market is segmented into dry steam power stations, flash steam power
stations, and binary cycle power stations. The binary power cycle stations
segment accounts for the largest share of the global geothermal power market. A
crucial technology in the geothermal power industry, binary power cycle
stations are especially well-suited for geothermal resources with low to medium
temperatures. Binary cycle stations, in contrast to flash or dry steam plants,
employ geothermal fluid to heat a secondary working fluid with a lower boiling
point, like pentane or isobutane. The geothermal fluid is reinjected into the
reservoir while this secondary fluid evaporates and powers a turbine. In
addition to this, binary plants function as closed-loop systems with almost no
emissions and little effect on the environment. These stations increase market
potential by enabling geothermal development in areas that were previously
thought to be unprofitable. Binary cycle stations are becoming more and more
significant in contemporary geothermal power generation due to their high
efficiency, modular design, and compatibility with Enhanced Geothermal Systems
(EGS).
The Industrial segment
holds the highest share of the End Use Segment over the forecast period
Based
on end use, the market is bifurcated into residential, commercial, industrial,
and others. The industrial segment accounts for the largest share of the
market. Geothermal energy is being utilized more and more in the industrial
sector to support combined heat and power (CHP), electricity generation, and
process heat. Since geothermal energy can produce steady, continuous heat at a
range of temperatures, it is advantageous to industries including food and
beverage processing, pulp and paper, chemical manufacturing, mining, and
textiles. Geothermal heat, for instance, is utilized for washing, drying,
pasteurization, and steam production, which lessens reliance on fossil fuels
and lowers operational expenses. In order to increase energy efficiency and dependability,
industrial enterprises close to geothermal resources can incorporate on-site
geothermal power plants. Geothermal energy offers an affordable, low-emission
option for long-term industrial energy needs as businesses look to satisfy
sustainability goals and decarbonize operations.
The following segments are
part of an in-depth analysis of the global Geothermal Power Market:
|
Market
Segments |
|
|
By Power
Station Type |
●
Dry Steam Power
Stations ●
Flash Steam Power
Stations ●
Binary Cycle Power
Stations |
|
By End Use |
●
Residential ●
Commercial ●
Industrial ●
Others |
Geothermal Power Market Share Analysis by Region
The Asia-Pacific region
is projected to hold the largest share of the global geothermal power market
over the forecast period.
The
Asia-Pacific region is projected to hold the largest share of the global
geothermal power market over the forecast period and is also expected to be the
fastest-growing region. The market for geothermal power in Asia-Pacific is
expected to increase significantly due to the region's extensive geothermal
resources, growing energy demand, and robust government backing for clean
energy. Leading nations include Japan, New Zealand, Indonesia, and the
Philippines, which are among the top producers of geothermal electricity
worldwide. Particularly in Indonesia's Java and Sumatra regions, exploration
and plant development are being made easier by strategic policies, advantageous
feed-in tariffs, and public-private partnerships. Enhanced Geothermal Systems
(EGS) and binary cycle plants are seeing an increase in investment due to
technological advancements and risk-mitigation funding. The region's growing
industrial base and emphasis on energy security encourage the use of geothermal
energy. Asia-Pacific continues to be a vital and dynamic market for geothermal
expansion as countries prioritize decarbonization and affordable electricity.
Global
Geothermal Power Market Recent Developments News:
●
In October 2023, Ormat
Technologies Inc. expanded its renewable energy asset base and portfolio by
purchasing a 150 MW portfolio of solar and geothermal assets from Enel Green
Power North America for about $271 million.
●
In June 2025, Calpine
Corporation increased its geothermal capacity at The Geysers by 7 MW in
partnership with MCE, and the new output is began supplying sustainable energy
to nearby towns.
●
In November 2025, the
Ulubelu Green Hydrogen Pilot Project, which combines geothermal energy with
green hydrogen technology, was started by PT Pertamina Geothermal Energy (PGE)
as an example of cross-sector decarbonization efforts.
The Global
Geothermal Power Market is dominated by a few large companies, such as
●
Ormat Technologies,
Inc.
●
Calpine Corporation
●
Enel Green Power
S.p.A.
●
Pertamina Geothermal
Energy
●
Kenya Electricity
Generating Company (KenGen)
●
Energy Development
Corporation (EDC)
●
Chevron Corporation
●
Contact Energy Limited
●
Mitsubishi Power
●
Toshiba Energy Systems
& Solutions
●
General Electric (GE)
●
Turboden S.p.A.
●
Ansaldo Energia S.p.A.
●
Atlas Copco Group
●
Exergy International
S.r.l.
●
Innergex Renewable
Energy Inc.
●
TAS Energy Inc.
●
Climeon AB
●
Iceland Drilling
Company Ltd.
● Reykjavik Geothermal Ltd.
Frequently Asked Questions
Ekta Chaurasia (Team Lead)
Ekta Chaurasia is a highly experienced Team Lead at M2Square Consultancy with over 7 years of expertise in market research, strategic consulting, competitive benchmarking, and business intelligence solutions. She specializes in ICT, semiconductors & electronics, automotive & transportation, and industrial machinery markets.
She leads end-to-end global research projects focused on market trends, industry analysis, growth forecasting, customer insights, and strategic decision-making. Known for her analytical leadership and industry expertise, Ekta helps businesses uncover growth opportunities, evaluate competitive landscapes, and stay ahead in rapidly evolving markets through accurate and insight-driven research.
1.
Global Geothermal Power Market Introduction and Market Overview
1.1.
Objectives of the Study
1.2.
Global Geothermal Power Market Scope and Market Estimation
1.2.1.Global Geothermal
Power Overall Market Size (US$ Bn), Market CAGR (%), Market forecast (2025 - 2033)
1.2.2.Global Geothermal
Power Market Revenue Share (%) and Growth Rate (Y-o-Y) from 2020 - 2033
1.3.
Market Segmentation
1.3.1.Power Station
Type of Global Geothermal Power Market
1.3.2.End Use of
Global Geothermal Power Market
1.3.3.Region of
Global Geothermal Power Market
2.
Executive
Summary
2.1.
Demand Side Trends
2.2.
Key Market Trends
2.3.
Market Demand (US$ Bn) Analysis 2020 – 2024 and Forecast, 2025 – 2033
2.4.
Demand and Opportunity Assessment
2.5.
Market Dynamics
2.5.1.Drivers
2.5.2.Limitations
2.5.3.Opportunities
2.5.4.Impact
Analysis of Drivers and Restraints
2.6.
Porter’s Five Forces Analysis
2.7.
PEST Analysis
2.8.
Key Regulation
2.9.
Key Developments
2.10. Value
Chain / Ecosystem Analysis
3.
Global
Geothermal Power Market Estimates & Historical Trend Analysis (2020 - 2024)
4. Global Geothermal Power Market Estimates & Forecast Trend Analysis, by Power Station Type
4.1.
Global Geothermal Power Market Revenue (US$ Bn) Estimates and
Forecasts, by Power Station Type, 2020 - 2033
4.1.1.Dry Steam
Power Stations
4.1.2.Flash Steam
Power Stations
4.1.3.Binary Cycle
Power Stations
5. Global Geothermal Power Market Estimates & Forecast Trend Analysis, by End Use
5.1.
Global Geothermal Power Market Revenue (US$ Bn) Estimates and
Forecasts, by End Use, 2020 - 2033
5.1.1.Residential
5.1.2.Commercial
5.1.3.Industrial
5.1.4.Others
6.
Global
Geothermal Power Market Estimates & Forecast Trend Analysis, by Region
6.1.
Global Geothermal Power Market Revenue (US$ Bn) Estimates and
Forecasts, by Region, 2020 - 2033
6.1.1.North America
6.1.2.Europe
6.1.3.Asia Pacific
6.1.4.Middle East
& Africa
6.1.5.Latin America
7.
North America Geothermal
Power Market: Estimates & Forecast
Trend Analysis
7.1.
North America Geothermal Power Market Assessments & Key
Findings
7.1.1.North America
Geothermal Power Market Introduction
7.1.2.North America
Geothermal Power Market Size Estimates and Forecast (US$ Billion) (2020 - 2033)
7.1.2.1. By Power Station Type
7.1.2.2. By End Use
7.1.2.3.
By Country
7.1.2.3.1.
The U.S.
7.1.2.3.2.
Canada
8.
Europe Geothermal
Power Market: Estimates & Forecast
Trend Analysis
8.1.
Europe Geothermal Power Market Assessments & Key Findings
8.1.1.Europe Geothermal
Power Market Introduction
8.1.2.Europe Geothermal
Power Market Size Estimates and Forecast (US$ Billion) (2020 - 2033)
8.1.2.1. By Power Station Type
8.1.2.2. By End Use
8.1.2.3. By
Country
8.1.2.3.1.
Germany
8.1.2.3.2.
Italy
8.1.2.3.3.
U.K.
8.1.2.3.4.
France
8.1.2.3.5.
Spain
8.1.2.3.6.
Russia
8.1.2.3.7.
Rest
of Europe
9.
Asia Pacific Geothermal
Power Market: Estimates & Forecast
Trend Analysis
9.1.
Asia Pacific Geothermal Power Market Assessments & Key
Findings
9.1.1.Asia Pacific Geothermal
Power Market Introduction
9.1.2.Asia Pacific Geothermal
Power Market Size Estimates and Forecast (US$ Billion) (2020 - 2033)
9.1.2.1. By Power Station Type
9.1.2.2. By End Use
9.1.2.3.
By Country
9.1.2.3.1.
China
9.1.2.3.2.
Japan
9.1.2.3.3.
India
9.1.2.3.4.
Australia
9.1.2.3.5.
South Korea
9.1.2.3.6.
Rest of Asia Pacific
10.
Middle East & Africa Geothermal Power Market:
Estimates & Forecast Trend Analysis
10.1. Middle
East & Africa Geothermal Power Market Assessments & Key Findings
10.1.1.
Middle East & Africa Geothermal
Power Market Introduction
10.1.2.
Middle East & Africa Geothermal
Power Market Size Estimates and Forecast (US$ Billion) (2020 - 2033)
10.1.2.1. By Power Station Type
10.1.2.2. By End Use
10.1.2.3.
By Country
10.1.2.3.1.
UAE
10.1.2.3.2.
Saudi Arabia
10.1.2.3.3.
South Africa
10.1.2.3.4. Rest of MEA
11.
Latin America Geothermal
Power Market: Estimates & Forecast
Trend Analysis
11.1. Latin
America Event Industry Assessments & Key Findings
11.1.1.
Latin America Geothermal Power Market Introduction
11.1.2.
Latin America Geothermal Power Market Size Estimates and Forecast
(US$ Billion) (2020 - 2033)
11.1.2.1. By Power Station Type
11.1.2.2. By End Use
11.1.2.3.
By Country
11.1.2.3.1.
Brazil
11.1.2.3.2.
Mexico
11.1.2.3.3.
Argentina
11.1.2.3.4. Rest of LATAM
12.
Country Wise Market: Introduction
13. Competition
Landscape
13.1. Global
Geothermal Power Market Product Mapping
13.2. Global
Geothermal Power Market Concentration Analysis, by Leading Players / Innovators
/ Emerging Players / New Entrants
13.3. Global
Geothermal Power Market Tier Structure Analysis
13.4. Global
Geothermal Power Market Concentration & Company Market Shares (%) Analysis,
2024
14. Company
Profiles
14.1.
Ormat Technologies, Inc.
14.1.1.
Company Overview & Key Stats
14.1.2.
Financial Performance & KPIs
14.1.3.
Product Portfolio
14.1.4.
SWOT Analysis
14.1.5.
Business Strategy & Recent Developments
*
Similar details would be provided for all the players mentioned below
14.2.
Calpine Corporation
14.3.
Enel Green Power S.p.A.
14.4.
Pertamina Geothermal Energy
14.5.
Kenya Electricity Generating Company (KenGen)
14.6.
Energy Development Corporation (EDC)
14.7.
Chevron Corporation
14.8.
Contact Energy Limited
14.9.
Mitsubishi Power
14.10.
Toshiba Energy Systems & Solutions
14.11.
General Electric (GE)
14.12.
Turboden S.p.A.
14.13.
Ansaldo Energia S.p.A.
14.14.
Atlas Copco Group
14.15.
Exergy International S.r.l.
14.16.
Innergex Renewable Energy Inc.
14.17.
TAS Energy Inc.
14.18.
Climeon AB
14.19.
Iceland Drilling Company Ltd.
14.20.
Other Prominent Players
15.
Research
Methodology
15.1. External
Transportations / Databases
15.2. Internal
Proprietary Database
15.3. Primary
Research
15.4. Secondary
Research
15.5. Assumptions
15.6. Limitations
15.7. Report
FAQs
16.
Research
Findings & Conclusion
Our Research Methodology
"Insight without rigor is just noise."
We follow a comprehensive, multi-phase research framework designed to deliver accurate, strategic, and decision-ready intelligence. Our process integrates primary and secondary research , both quantitative and qualitative , along with dual modeling techniques ( top-down and bottom-up) and a final layer of validation through our proprietary in-house repository.
PRIMARY RESEARCH
Primary research captures real-time, firsthand insights from the market to understand behaviors, motivations, and emerging trends.
1. Quantitative Primary Research
Objective: Generate statistically significant data directly from market participants.
Approaches:- Structured surveys with customers, distributors, and field agents
- Mobile-based data collection for point-of-sale audits and usage behavior
- Phone-based interviews (CATI) for market sizing and product feedback
- Online polling around industry events and digital campaigns
- Purchase frequency by customer type
- Channel performance across geographies
- Feature demand by application or demographic
2. Qualitative Primary Research
Objective: Explore decision-making drivers, pain points, and market readiness.
Approaches:- In-depth interviews (IDIs) with executives, product managers, and key decision-makers
- Focus groups among end users and early adopters
- Site visits and observational research for consumer products
- Informal field-level discussions for regional and cultural nuances
SECONDARY RESEARCH
This phase helps establish a macro-to-micro understanding of market trends, size, regulation, and competitive dynamics, sourced from credible and public domain information.
1. Quantitative Secondary Research
Objective: Model market value and segment-level forecasts based on published data.
Sources include:- Financial reports and investor summaries
- Government trade data, customs records, and regulatory statistics
- Industry association publications and economic databases
- Channel performance and pricing data from marketplace listings
- Revenue splits, pricing trends, and CAGR estimates
- Supply-side capacity and volume tracking
- Investment analysis and funding benchmarks
2. Qualitative Secondary Research
Objective: Capture strategic direction, innovation signals, and behavioral trends.
Sources include:- Company announcements, roadmaps, and product pipelines
- Publicly available whitepapers, conference abstracts, and academic research
- Regulatory body publications and policy briefs
- Social and media sentiment scanning for early-stage shifts
- Strategic shifts in market positioning
- Unmet needs and white spaces
- Regulatory triggers and compliance impact

DUAL MODELING: TOP-DOWN + BOTTOM-UP
To ensure robust market estimation, we apply two complementary sizing approaches:
Top-Down Modeling:- Start with broader industry value (e.g., global or regional TAM)
- Apply filters by segment, geography, end-user, or use case
- Adjust with primary insights and validation benchmarks
- Ideal for investor-grade market scans and opportunity mapping
- Aggregate from the ground up using sales volumes, pricing, and unit economics
- Use internal modeling templates aligned with stakeholder data
- Incorporate distributor-level or region-specific inputs
- Most accurate for emerging segments and granular sub-markets
DATA VALIDATION: IN-HOUSE REPOSITORY
We close the loop with proprietary data intelligence built from ongoing projects, industry monitoring, and historical benchmarking. This repository includes:
- Multi-sector market and pricing models
- Key trendlines from past interviews and forecasts
- Benchmarked adoption rates, churn patterns, and ROI indicators
- Industry-specific deviation flags and cross-check logic
- Catches inconsistencies early
- Aligns projections across studies
- Enables consistent, high-trust deliverables