
HD Maps for Autonomous Driving Market Size and Forecast (2025-2033), Global and Regional Growth, Trend, Share and Industry Analysis Report Coverage: By Vehicle Type (Passenger Vehicle, Commercial Vehicle), By Solution (Cloud-Based, Embedded), By Level of Automation (Semi-Autonomous, Fully Autonomous), and Geography
2025-12-18
Automotive & Transportation (Mobility)
Ekta Chaurasia (Team Lead)
Description
HD Maps
for Autonomous Driving Market Overview
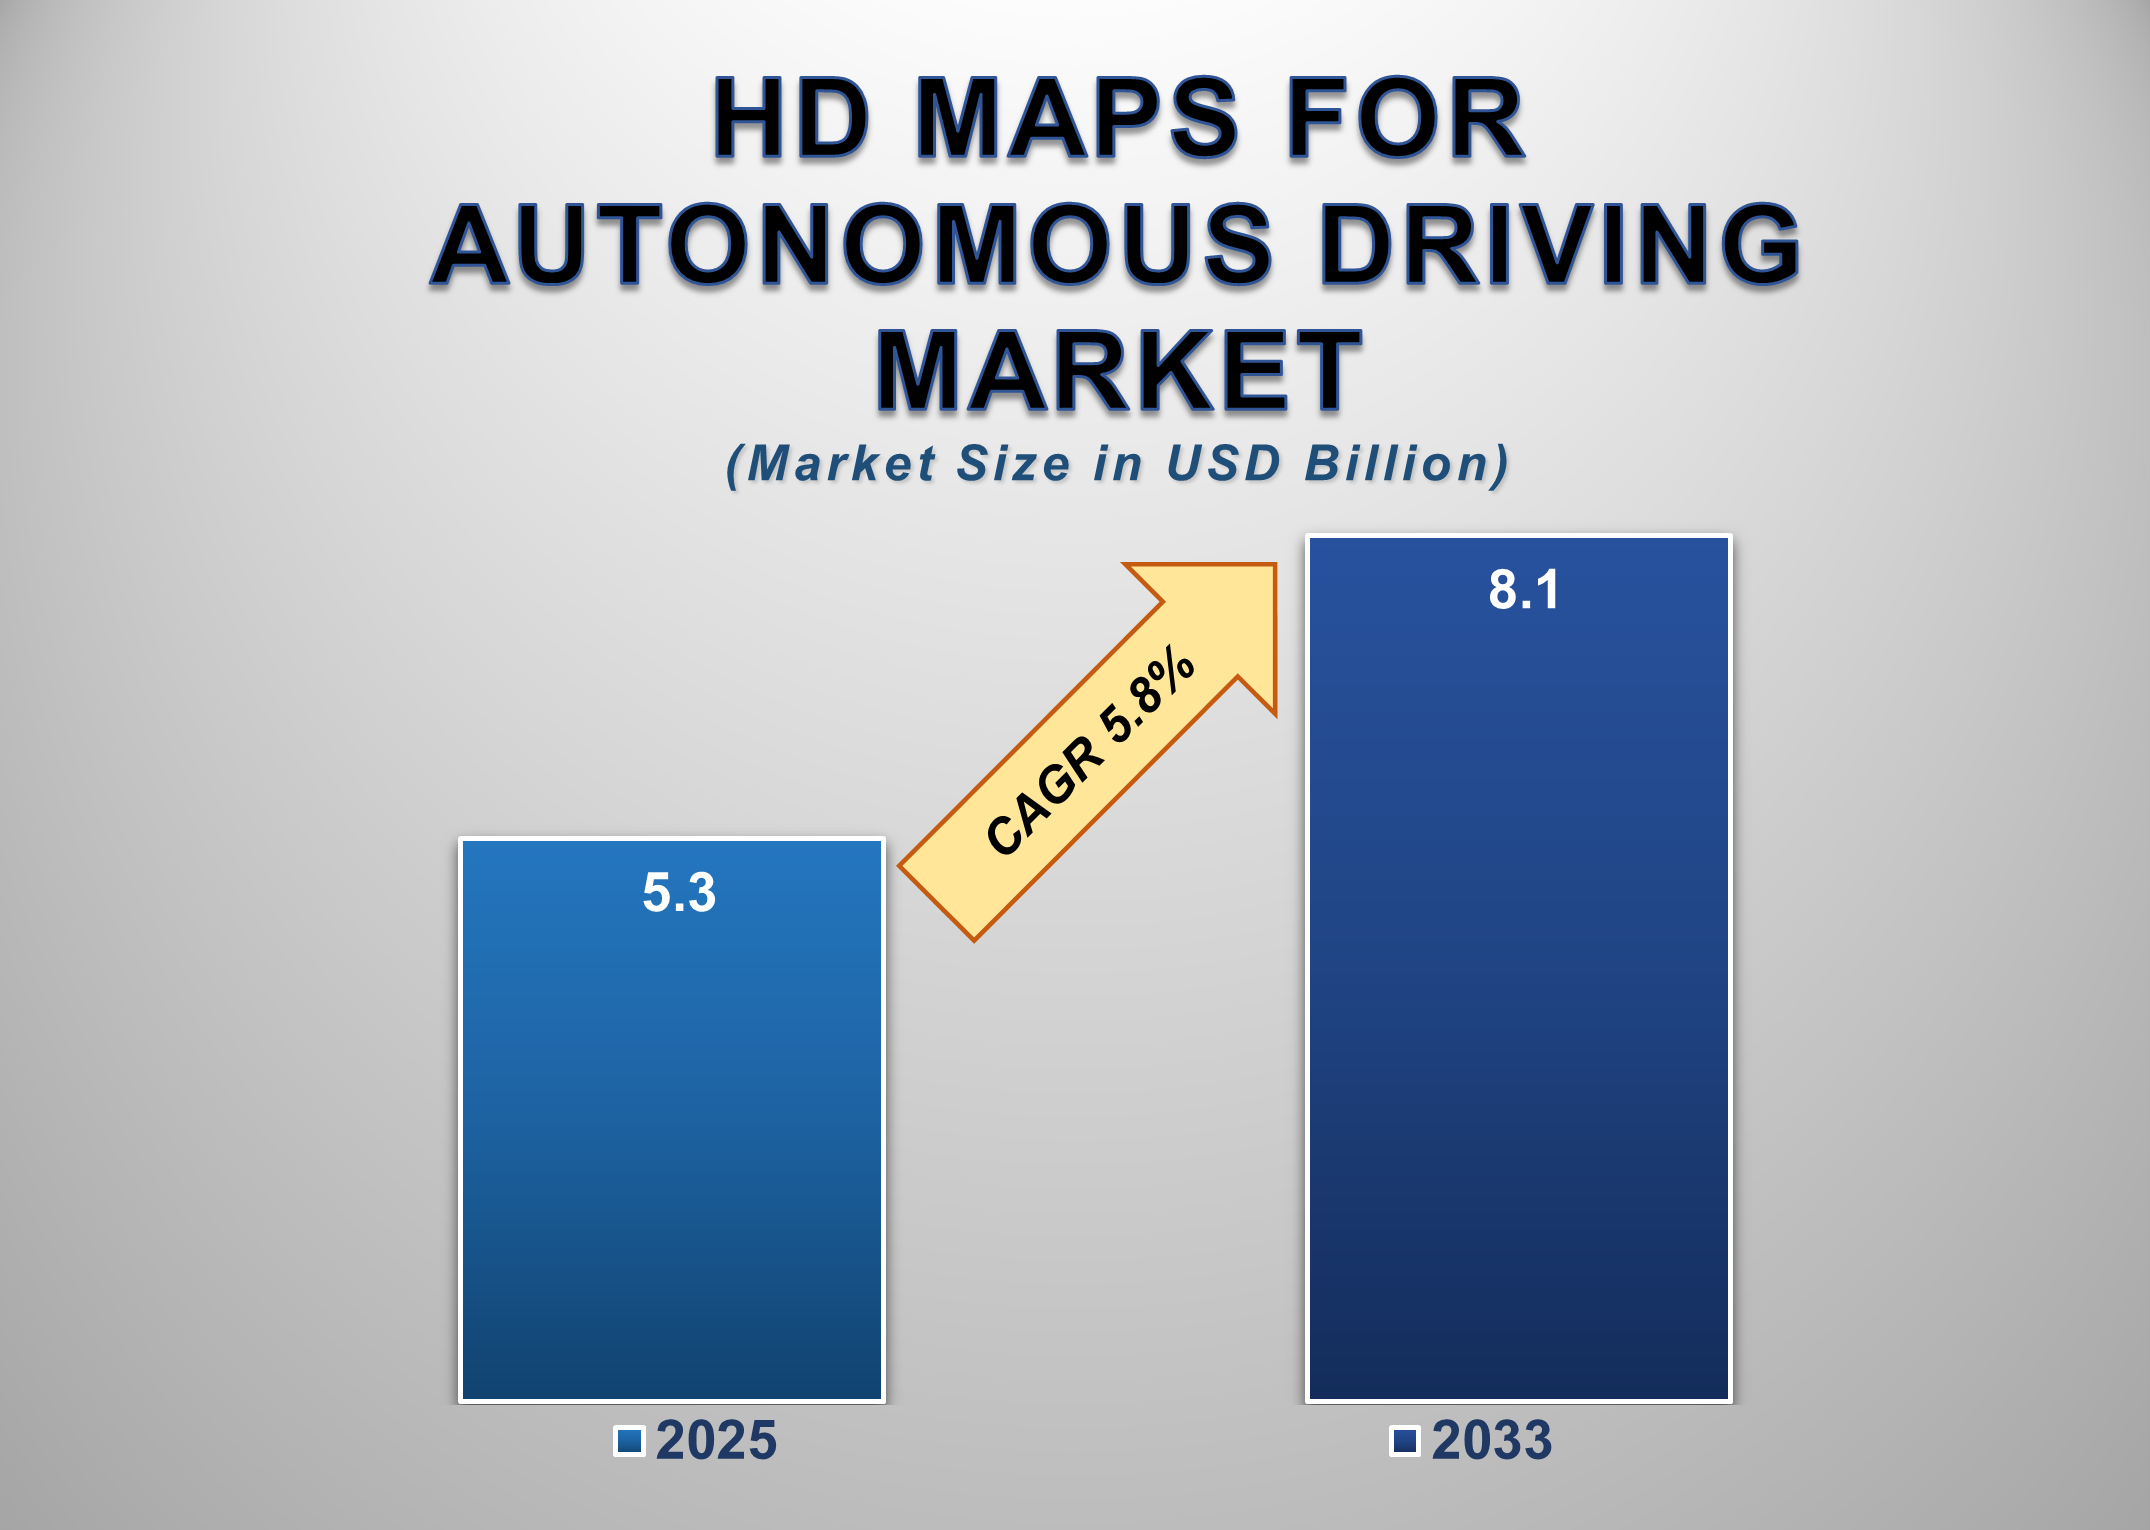
The Global HD Maps for Autonomous Driving Market is projected to reach USD 8.1 billion by 2033 from USD 5.3 billion in 2025, registering a CAGR of 5.8% during the forecast period (2025–2033). The growing demand for high-precision mapping solutions in autonomous and semi-autonomous vehicles is a primary driver of market growth. HD maps provide centimeter-level accuracy and real-time updates crucial for vehicle localization, navigation, and decision-making in dynamic driving environments.
The market expansion is further
fueled by advancements in LiDAR, artificial intelligence (AI), and cloud
computing technologies that enable continuous map updates and seamless
integration with advanced driver assistance systems (ADAS). Passenger vehicles
dominate the global market due to the growing integration of semi-autonomous
driving features in premium and mid-segment cars. With major automotive
manufacturers collaborating with mapping technology firms, the HD maps
ecosystem is poised for steady growth over the coming decade.
HD Maps
for Autonomous Driving Market Drivers and Opportunities
Growing Adoption of
Semi-Autonomous Vehicles Is Driving Market Growth
The increasing penetration of
semi-autonomous vehicles equipped with advanced driver assistance systems
(ADAS) is a key driver propelling the demand for HD maps. These vehicles rely
heavily on high-resolution, 3D mapping data for lane-level accuracy and predictive
route planning. HD maps enhance vehicle safety by providing real-time insights
into road curvature, elevation, and traffic conditions, enabling smoother and
safer driving experiences. Manufacturers are increasingly integrating HD
mapping capabilities into Level 2 and Level 3 autonomous vehicles to improve
reliability in complex traffic conditions. The adoption of technologies such as
LiDAR, radar, and machine vision systems has further strengthened the accuracy
and efficiency of HD maps. As consumer demand for connected and autonomous
vehicles rises, the role of HD maps as a foundational component of intelligent
mobility solutions continues to expand significantly.
Cloud-Based Mapping Platforms
Accelerate Data Integration and Scalability
The transition from traditional
embedded systems to cloud-based HD mapping solutions is revolutionizing the
autonomous driving landscape. Cloud platforms allow for real-time data
aggregation, storage, and dissemination across vehicles, infrastructure, and
road networks, ensuring that maps remain accurate and continuously updated.
This capability is critical for supporting semi-autonomous and fully autonomous
driving operations, particularly in dynamic urban environments.
Cloud-based solutions also enable
over-the-air updates, reducing maintenance costs and improving operational
efficiency for automakers and fleet operators. As connectivity standards such
as 5G evolve, cloud integration enhances data transmission speed and
reliability, facilitating collaborative mapping and improved situational
awareness. Consequently, the scalability and adaptability offered by
cloud-based systems are positioning them as the preferred solution in
next-generation autonomous driving ecosystems.
Rapid Advancements in
Autonomous Driving Technologies Create Growth Opportunities
Ongoing advancements in AI, edge
computing, and sensor fusion technologies are creating significant
opportunities for the HD maps market. As automakers and technology providers
race to achieve higher levels of vehicle autonomy, the demand for precise and
real-time mapping data is intensifying. Integration of HD maps with
vehicle-to-everything (V2X) communication networks and AI-driven predictive
algorithms enables vehicles to anticipate road hazards and make proactive
decisions.
Moreover, the growing number of
pilot programs for fully autonomous vehicles in regions such as North America
and Asia-Pacific is accelerating R&D investments in HD mapping
technologies. Partnerships among automotive OEMs, mapping firms, and software
developers are facilitating breakthroughs in real-time 3D mapping and dynamic
route optimization. These innovations are expected to open lucrative avenues
for market players throughout the forecast period.
HD Maps for Autonomous Driving Market Scope
|
Report Attributes |
Description |
|
Market Size in 2025 |
USD 5.3 Billion |
|
Market Forecast in 2033 |
USD 8.1 Billion |
|
CAGR % 2025-2033 |
5.8% |
|
Base Year |
2024 |
|
Historic Data |
2020-2024 |
|
Forecast Period |
2025-2033 |
|
Report USP |
Production, Consumption, Company
Share, Company Heatmap, Company Production Capacity, Growth Factors and more |
|
Segments Covered |
●
by Vehicle
Type, by Solution, by Level of Automation, |
|
Regional Scope |
●
North America ●
Europe ●
APAC ●
Latin America ●
Middle East and
Africa |
|
Country Scope |
1)
U.S. 2)
Canada 3)
Germany 4)
UK 5)
France 6)
Spain 7)
Italy 8)
Switzerland 9)
China 10)
Japan 11)
India 12)
Australia 13)
South Korea 14)
Brazil 15)
Mexico 16)
Argentina 17)
South Africa 18)
Saudi Arabia 19)
UAE |
HD Maps for Autonomous Driving Market Report Segmentation
Analysis
The global HD Maps for Autonomous
Driving Market is segmented into Vehicle Type, Solution, Level of Automation,
and Geography.
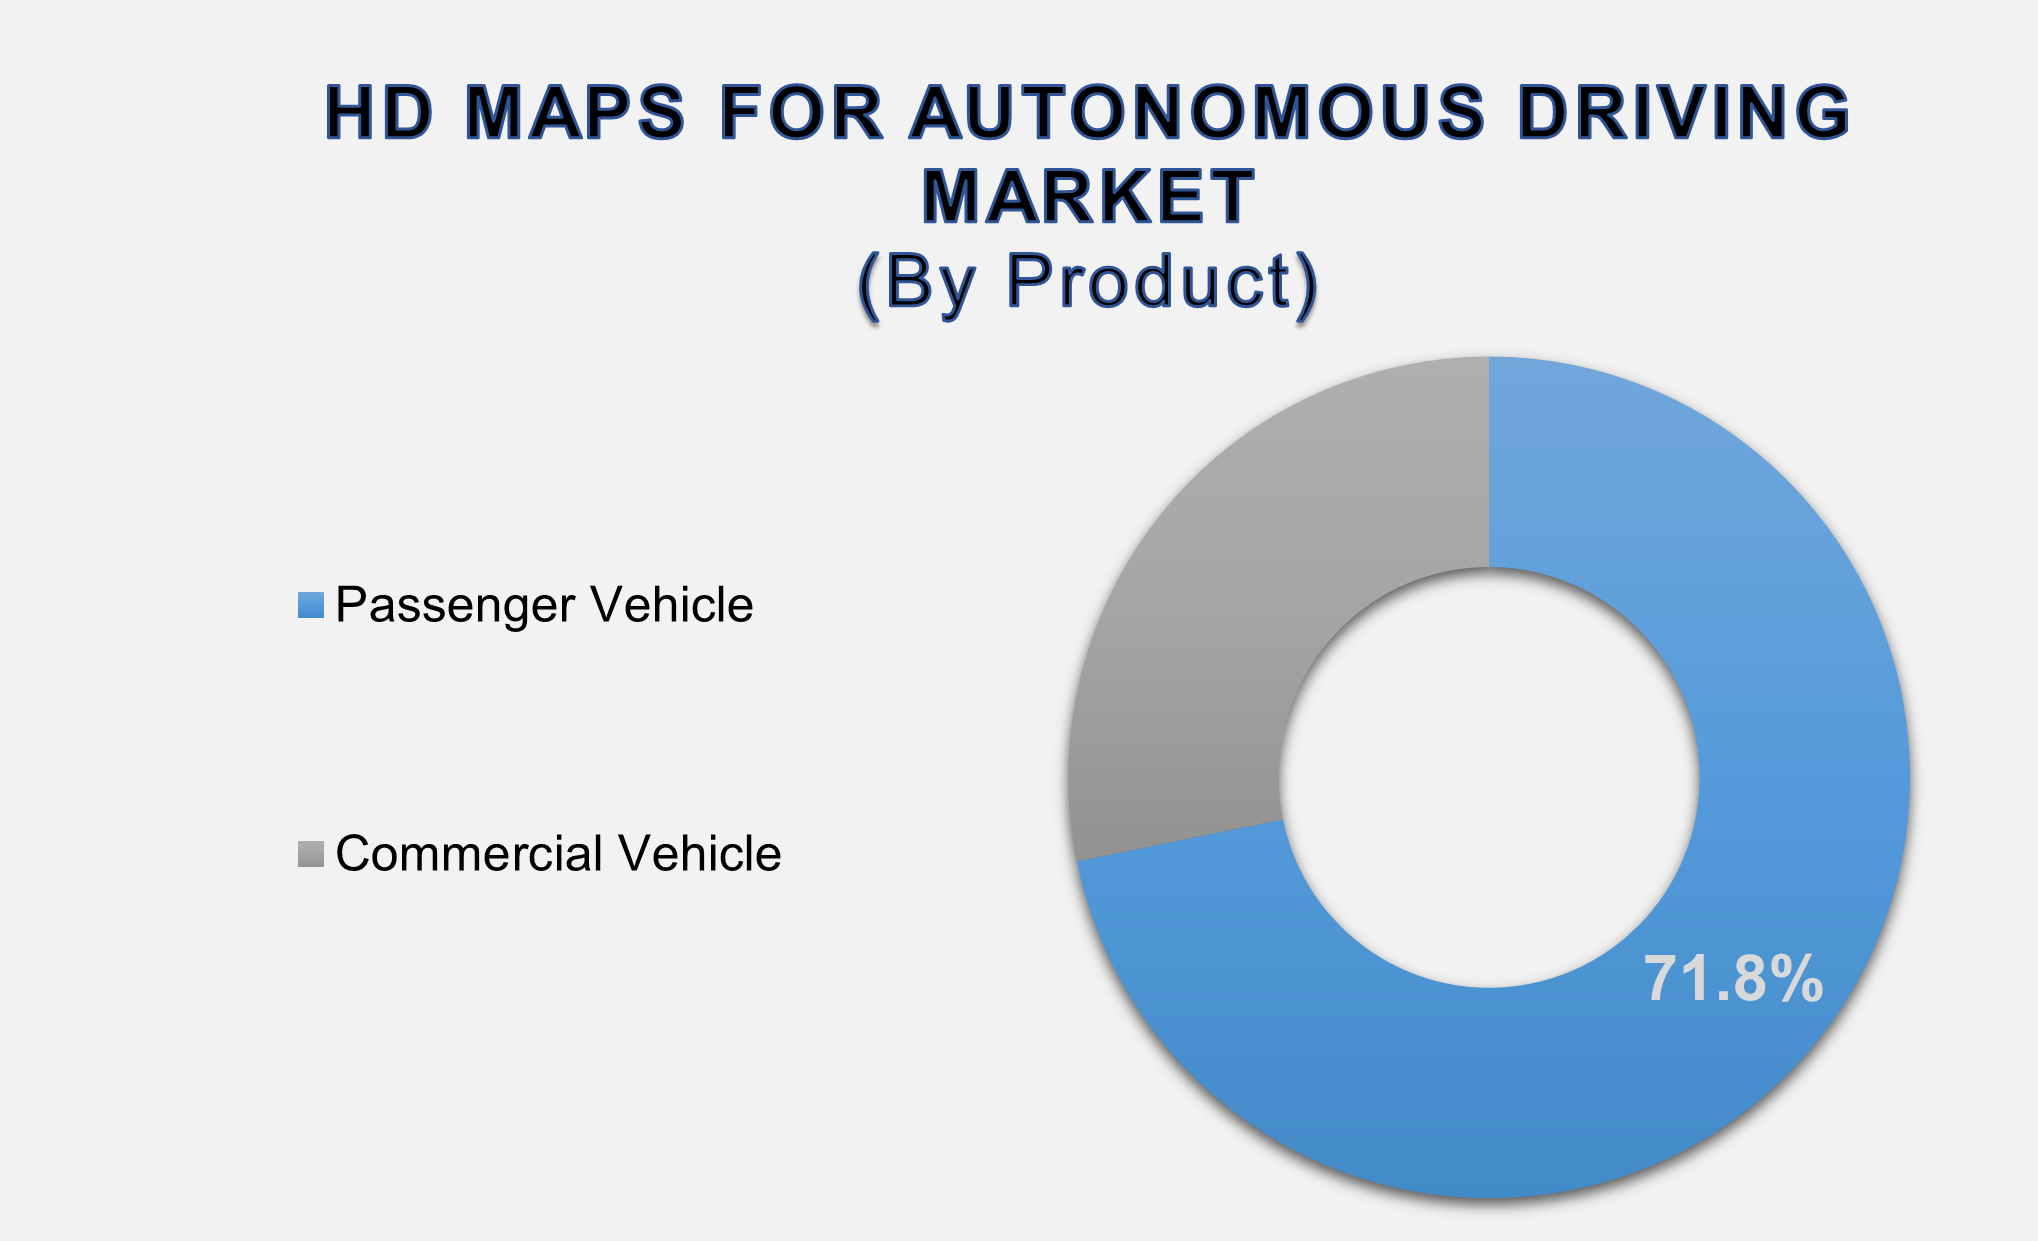
The Passenger Vehicle Segment
Accounted for the Largest Market Share in the Global HD Maps for Autonomous
Driving Market
By Vehicle Type, the market is
segmented into Passenger Vehicle and Commercial Vehicle.
The Passenger Vehicle segment accounted for the largest share of the global HD
maps for autonomous driving market in 2025. This dominance is driven by the
rapid integration of ADAS and semi-autonomous driving features in passenger
cars by leading OEMs such as Tesla, BMW, and Mercedes-Benz. HD maps play a
vital role in enabling accurate localization and route planning, improving
vehicle safety and driving comfort.
The increasing consumer
inclination toward intelligent driving features and connected mobility
solutions further accelerates the adoption of HD mapping technologies in
passenger vehicles. Moreover, collaborations between automotive manufacturers
and mapping technology firms such as HERE Technologies and TomTom are
reinforcing this segment’s strong market position, ensuring consistent
innovation and commercial scalability.
Cloud-Based Segment Accounted
for the Largest Market Share in the Global HD Maps for Autonomous Driving
Market
By Solution, the market is
segmented into Cloud-Based and Embedded.
The Cloud-Based segment accounted for the largest share of the global HD maps
for autonomous driving market in 2025. This growth is fueled by the increasing
demand for real-time map updates and scalable data-sharing capabilities among
autonomous vehicles. Cloud-based HD mapping platforms allow vehicles to
exchange and process high-volume data efficiently, ensuring precise navigation
and environment perception. Additionally, the widespread adoption of 5G and
edge computing technologies enhances data transmission speeds, enabling faster
decision-making for self-driving systems. Cloud-based infrastructure also
reduces operational costs and simplifies updates, making it the preferred
choice among automakers and fleet managers aiming for large-scale deployment of
autonomous driving solutions.
Semi-Autonomous Segment
Accounted for the Largest Market Share in the Global HD Maps for Autonomous
Driving Market
By Level of Automation, the
market is segmented into Semi-Autonomous and Fully Autonomous.
The Semi-Autonomous segment accounted for the largest share of the global HD
maps for autonomous driving market in 2025. Vehicles at this level of
automation utilize HD maps to support advanced driving assistance features such
as adaptive cruise control, lane keeping, and automated parking. These features
enhance driver safety and convenience while maintaining a level of manual
control, making semi-autonomous vehicles the dominant category in current
automotive markets.
Automotive manufacturers continue
to enhance semi-autonomous capabilities with precise HD mapping, enabling
vehicles to adapt dynamically to road conditions and traffic changes. As the
industry transitions toward higher automation levels, the semi-autonomous
segment remains a crucial stepping stone, ensuring gradual consumer acceptance
and regulatory adaptation.
The following segments are
part of an in-depth analysis of the global HD Maps for Autonomous Driving
Market:
|
Market
Segments |
|
|
By Vehicle
Type |
●
Passenger Vehicle ●
Commercial Vehicle |
|
By Solution |
●
Cloud-Based ●
Embedded |
|
By Level Of
Automation |
●
Semi-Autonomous ●
Fully Autonomous |
HD Maps
for Autonomous Driving Market Share Analysis by Region
The North America region is
projected to hold the largest share of the global HD Maps for Autonomous
Driving Market over the forecast period.
North America accounted for the
largest share of the global HD maps for the autonomous driving market in 2025,
holding 40.1% of total revenue. The region’s dominance is attributed to the
strong presence of autonomous vehicle developers, technological innovation, and
government support for connected mobility infrastructure. The U.S. leads in HD
map adoption due to large-scale testing of autonomous fleets by companies like
Waymo, Cruise, and Apple.
Meanwhile, the Asia-Pacific
(APAC) region is expected to grow at the highest CAGR during the forecast
period. Rapid technological advancements in countries like China, Japan, and
South Korea, combined with rising investments in smart transportation infrastructure,
are driving regional growth. The increasing production of semi-autonomous
vehicles and government initiatives to promote intelligent transport systems
further enhance APAC’s market potential.
HD Maps for Autonomous Driving Market Competition
Landscape Analysis
The global HD
maps for the autonomous driving market are moderately consolidated, with
leading players focusing on partnerships, mergers, and technology-driven
innovation. Companies are investing heavily in AI-powered 3D mapping,
crowd-sourced data collection, and real-time updating systems to enhance
accuracy and scalability. Key players include HERE Technologies, TomTom,
Google, Apple, DeepMap (Nvidia), Civil Maps, Mapbox, Carmera, Lvl5, Sanborn Map
Company, Mobileye, Dynamic Map Platform, Zenrin, NavInfo, AutoNavi (Amap),
Baidu, Increment P (Toyota), Intermap Technologies, Topcon, and Trimble.
Global HD Maps for Autonomous Driving Market Recent
Developments News:
- In January 2024,
TomTom and Mitsubishi Electric partnered to develop integrated solutions
for automated driving, combining TomTom’s High Definition Map with
Mitsubishi Electric’s High-Definition Locator. The collaboration aims to
deliver precise, hardware-enabled navigation data to automakers for
next-generation autonomous vehicles.
- In January 2024,
HERE Technologies collaborated with Bosch and Daimler Truck AG to create
an advanced driver assistance system (ADAS) for commercial vehicles. The
system automatically calculates the most efficient driving style to lower
stress, reduce energy consumption, and cut CO₂ emissions.
- In December 2023, BMW
integrated HERE Technologies’ HD mapping service into its 7 Series
vehicles equipped with Personal Pilot Level 3 automation. The
high-definition maps support hands-off, eyes-off driving under specific
conditions, enhancing both safety and convenience in advanced
driver-assistance systems.
The Global HD Maps for Autonomous Driving Market is
dominated by a few large companies, such as
●
HERE Technologies
●
TomTom
●
Google
●
Apple
●
DeepMap (Nvidia)
●
Civil Maps
●
Mapbox
●
Carmera
●
Lvl5
●
Sanborn Map Company
●
Mobileye
●
Dynamic Map Platform
●
Zenrin
●
NavInfo
●
AutoNavi (Amap)
●
Baidu
●
Increment P (Toyota)
●
Intermap Technologies
●
Topcon
●
Trimble
● Other Prominent Players
Frequently Asked Questions
Ekta Chaurasia (Team Lead)
Ekta Chaurasia is a highly experienced Team Lead at M2Square Consultancy with over 7 years of expertise in market research, strategic consulting, competitive benchmarking, and business intelligence solutions. She specializes in ICT, semiconductors & electronics, automotive & transportation, and industrial machinery markets.
She leads end-to-end global research projects focused on market trends, industry analysis, growth forecasting, customer insights, and strategic decision-making. Known for her analytical leadership and industry expertise, Ekta helps businesses uncover growth opportunities, evaluate competitive landscapes, and stay ahead in rapidly evolving markets through accurate and insight-driven research.
1. Global HD Maps for
Autonomous Driving Market Introduction and Market Overview
1.1.
Objectives
of the Study
1.2.
Global
HD Maps for Autonomous Driving Market Scope and Market Estimation
1.2.1.Global HD Maps for
Autonomous Driving Market Overall Market Size (US$ Bn), Market CAGR (%), Market
forecast (2025 - 2033)
1.2.2.Global HD Maps for
Autonomous Driving Market Revenue Share (%) and Growth Rate (Y-o-Y) from 2020 -
2033
1.3.
Market
Segmentation
1.3.1.Vehicle Type of Global HD
Maps for Autonomous Driving Market
1.3.2.Solution of Global HD Maps
for Autonomous Driving Market
1.3.3.Level of Automation of
Global HD Maps for Autonomous Driving Market
1.3.4.Region of Global HD Maps
for Autonomous Driving Market
2. Executive
Summary
2.1.
Demand
Side Trends
2.2.
Key
Market Trends
2.3.
Market
Demand (US$ Bn) Analysis 2020 – 2024 and Forecast, 2025 – 2033
2.4.
Demand
and Opportunity Assessment
2.5.
Demand
Supply Scenario
2.6.
Market
Dynamics
2.6.1.Drivers
2.6.2.Limitations
2.6.3.Opportunities
2.6.4.Impact Analysis of Drivers
and Restraints
2.7.
Emerging
Trends for HD Maps for Autonomous Driving Market
2.8.
Porter’s
Five Forces Analysis
2.9.
PEST
Analysis
2.10.
Key
Regulation
3. Global
HD Maps for Autonomous Driving Market
Estimates & Historical Trend Analysis (2020 - 2024)
4.
Global HD Maps for
Autonomous Driving Market Estimates
& Forecast Trend Analysis, by Vehicle Type
4.1.
Global
HD Maps for Autonomous Driving Market Revenue (US$ Bn) Estimates and Forecasts,
by Vehicle Type, 2020 - 2033
4.1.1.Passenger Vehicle
4.1.2.Commercial Vehicle
5.
Global HD Maps for
Autonomous Driving Market Estimates
& Forecast Trend Analysis, by Solution
5.1.
Global
HD Maps for Autonomous Driving Market Revenue (US$ Bn) Estimates and Forecasts,
by Solution, 2020 - 2033
5.1.1.Cloud-Based
5.1.2.Embedded
6.
Global HD Maps for
Autonomous Driving Market Estimates
& Forecast Trend Analysis, by Level of Automation
6.1.
Global
HD Maps for Autonomous Driving Market Revenue (US$ Bn) Estimates and Forecasts,
by Level of Automation, 2020 - 2033
6.1.1.Semi-Autonomous
6.1.2.Fully Autonomous
7. Global
HD Maps for Autonomous Driving Market
Estimates & Forecast Trend Analysis, by region
1.1.
Global
HD Maps for Autonomous Driving Market Revenue (US$ Bn) Estimates and Forecasts,
by region, 2020 - 2033
1.1.1.North America
1.1.2.Europe
1.1.3.Asia Pacific
1.1.4.Middle East & Africa
1.1.5.Latin America
8. North America HD
Maps for Autonomous Driving Market:
Estimates & Forecast Trend Analysis
8.1.
North
America HD Maps for Autonomous Driving Market Assessments & Key Findings
8.1.1.North America HD Maps for
Autonomous Driving Market Introduction
8.1.2.North America HD Maps for
Autonomous Driving Market Size Estimates and Forecast (US$ Billion) (2020 - 2033)
8.1.2.1. By Vehicle
Type
8.1.2.2. By Solution
8.1.2.3. By Level of
Automation
8.1.2.4.
By
Country
8.1.2.4.1.
The
U.S.
8.1.2.4.2.
Canada
9. Europe HD
Maps for Autonomous Driving Market:
Estimates & Forecast Trend Analysis
9.1.
Europe
HD Maps for Autonomous Driving Market Assessments & Key Findings
9.1.1.Europe HD Maps for
Autonomous Driving Market Introduction
9.1.2.Europe HD Maps for
Autonomous Driving Market Size Estimates and Forecast (US$ Billion) (2020 - 2033)
9.1.2.1. By Vehicle
Type
9.1.2.2. By Solution
9.1.2.3. By Level of
Automation
9.1.2.4.
By
Country
9.1.2.4.1. Germany
9.1.2.4.2. Italy
9.1.2.4.3. U.K.
9.1.2.4.4. France
9.1.2.4.5. Spain
9.1.2.4.6. Switzerland
9.1.2.4.7.
Rest of Europe
10. Asia Pacific HD
Maps for Autonomous Driving Market:
Estimates & Forecast Trend Analysis
10.1.
Asia
Pacific Market Assessments & Key Findings
10.1.1.
Asia
Pacific HD Maps for Autonomous Driving Market Introduction
10.1.2.
Asia
Pacific HD Maps for Autonomous Driving Market Size Estimates and Forecast (US$ Billion)
(2020 - 2033)
10.1.2.1. By Vehicle
Type
10.1.2.2. By Solution
10.1.2.3. By Level of
Automation
10.1.2.4.
By
Country
10.1.2.4.1. China
10.1.2.4.2. Japan
10.1.2.4.3. India
10.1.2.4.4. Australia
10.1.2.4.5. South Korea
10.1.2.4.6.
Rest
of Asia Pacific
11. Middle East & Africa HD
Maps for Autonomous Driving Market:
Estimates & Forecast Trend Analysis
11.1.
Middle
East & Africa Market Assessments & Key Findings
11.1.1.
Middle East & Africa HD Maps for Autonomous Driving
Market Introduction
11.1.2.
Middle East & Africa HD Maps for Autonomous Driving
Market Size Estimates and Forecast (US$ Billion) (2020 - 2033)
11.1.2.1. By Vehicle
Type
11.1.2.2. By Solution
11.1.2.3. By Level of
Automation
11.1.2.4.
By
Country
11.1.2.4.1. South
Africa
11.1.2.4.2. UAE
11.1.2.4.3. Saudi
Arabia
11.1.2.4.4.
Rest of MEA
12. Latin America
HD Maps for Autonomous Driving Market:
Estimates & Forecast Trend Analysis
12.1.
Latin
America Market Assessments & Key Findings
12.1.1.
Latin
America HD Maps for Autonomous Driving Market Introduction
12.1.2.
Latin
America HD Maps for Autonomous Driving Market Size Estimates and Forecast (US$ Billion)
(2020 - 2033)
12.1.2.1. By Vehicle
Type
12.1.2.2. By Solution
12.1.2.3. By Level of
Automation
12.1.2.4.
By
Country
12.1.2.4.1. Brazil
12.1.2.4.2. Mexico
12.1.2.4.3. Argentina
12.1.2.4.4.
Rest of LATAM
13. Country Wise Market:
Introduction
14.
Competition
Landscape
14.1.
Global
HD Maps for Autonomous Driving Market Product Mapping
14.2.
Global
HD Maps for Autonomous Driving Market Concentration Analysis, by Leading
Players / Innovators / Emerging Players / New Entrants
14.3.
Global
HD Maps for Autonomous Driving Market Tier Structure Analysis
14.4.
Global
HD Maps for Autonomous Driving Market Concentration & Company Market Shares
(%) Analysis, 2023
15.
Company
Profiles
15.1. HERE
Technologies
15.1.1.
Company
Overview & Key Stats
15.1.2.
Financial
Performance & KPIs
15.1.3.
Product
Portfolio
15.1.4.
SWOT
Analysis
15.1.5.
Business
Strategy & Recent Developments
* Similar details would be provided for all
the players mentioned below
15.2. TomTom
15.3. Google
15.4. Apple
15.5. DeepMap
(Nvidia)
15.6. Civil Maps
15.7. Mapbox
15.8. Carmera
15.9. Lvl5
15.10. Sanborn Map
Company
15.11. Mobileye
15.12. Dynamic Map
Platform
15.13. Zenrin
15.14. NavInfo
15.15. AutoNavi
(Amap)
15.16. Baidu
15.17. Increment P
(Toyota)
15.18. Intermap
Technologies
15.19. Topcon
15.20. Trimble
15.21. Other
Prominent Players
16. Research
Methodology
16.1.
External
Transportations / Databases
16.2.
Internal
Proprietary Database
16.3.
Primary
Research
16.4.
Secondary
Research
16.5.
Assumptions
16.6.
Limitations
16.7.
Report
FAQs
17. Research
Findings & Conclusion
Our Research Methodology
"Insight without rigor is just noise."
We follow a comprehensive, multi-phase research framework designed to deliver accurate, strategic, and decision-ready intelligence. Our process integrates primary and secondary research , both quantitative and qualitative , along with dual modeling techniques ( top-down and bottom-up) and a final layer of validation through our proprietary in-house repository.
PRIMARY RESEARCH
Primary research captures real-time, firsthand insights from the market to understand behaviors, motivations, and emerging trends.
1. Quantitative Primary Research
Objective: Generate statistically significant data directly from market participants.
Approaches:- Structured surveys with customers, distributors, and field agents
- Mobile-based data collection for point-of-sale audits and usage behavior
- Phone-based interviews (CATI) for market sizing and product feedback
- Online polling around industry events and digital campaigns
- Purchase frequency by customer type
- Channel performance across geographies
- Feature demand by application or demographic
2. Qualitative Primary Research
Objective: Explore decision-making drivers, pain points, and market readiness.
Approaches:- In-depth interviews (IDIs) with executives, product managers, and key decision-makers
- Focus groups among end users and early adopters
- Site visits and observational research for consumer products
- Informal field-level discussions for regional and cultural nuances
SECONDARY RESEARCH
This phase helps establish a macro-to-micro understanding of market trends, size, regulation, and competitive dynamics, sourced from credible and public domain information.
1. Quantitative Secondary Research
Objective: Model market value and segment-level forecasts based on published data.
Sources include:- Financial reports and investor summaries
- Government trade data, customs records, and regulatory statistics
- Industry association publications and economic databases
- Channel performance and pricing data from marketplace listings
- Revenue splits, pricing trends, and CAGR estimates
- Supply-side capacity and volume tracking
- Investment analysis and funding benchmarks
2. Qualitative Secondary Research
Objective: Capture strategic direction, innovation signals, and behavioral trends.
Sources include:- Company announcements, roadmaps, and product pipelines
- Publicly available whitepapers, conference abstracts, and academic research
- Regulatory body publications and policy briefs
- Social and media sentiment scanning for early-stage shifts
- Strategic shifts in market positioning
- Unmet needs and white spaces
- Regulatory triggers and compliance impact

DUAL MODELING: TOP-DOWN + BOTTOM-UP
To ensure robust market estimation, we apply two complementary sizing approaches:
Top-Down Modeling:- Start with broader industry value (e.g., global or regional TAM)
- Apply filters by segment, geography, end-user, or use case
- Adjust with primary insights and validation benchmarks
- Ideal for investor-grade market scans and opportunity mapping
- Aggregate from the ground up using sales volumes, pricing, and unit economics
- Use internal modeling templates aligned with stakeholder data
- Incorporate distributor-level or region-specific inputs
- Most accurate for emerging segments and granular sub-markets
DATA VALIDATION: IN-HOUSE REPOSITORY
We close the loop with proprietary data intelligence built from ongoing projects, industry monitoring, and historical benchmarking. This repository includes:
- Multi-sector market and pricing models
- Key trendlines from past interviews and forecasts
- Benchmarked adoption rates, churn patterns, and ROI indicators
- Industry-specific deviation flags and cross-check logic
- Catches inconsistencies early
- Aligns projections across studies
- Enables consistent, high-trust deliverables