
Home Energy Management Market Size and Forecast (2020 - 2033), Global and Regional Growth, Trend, Share and Industry Analysis Report Coverage; By Component (Hardware, Software, Services); By Technology (Z-Wave, Zigbee, Wi-Fi, Thread, Others); By Application (Lighting Controls, HVAC Controls, Smart Plugs, Smart Thermostats, Energy Management Systems, Others); By End-User (Residential, Commercial) and Geography
2025-10-28
Energy & Power
Ekta Chaurasia (Team Lead)
Description
Home Energy Management Market Overview
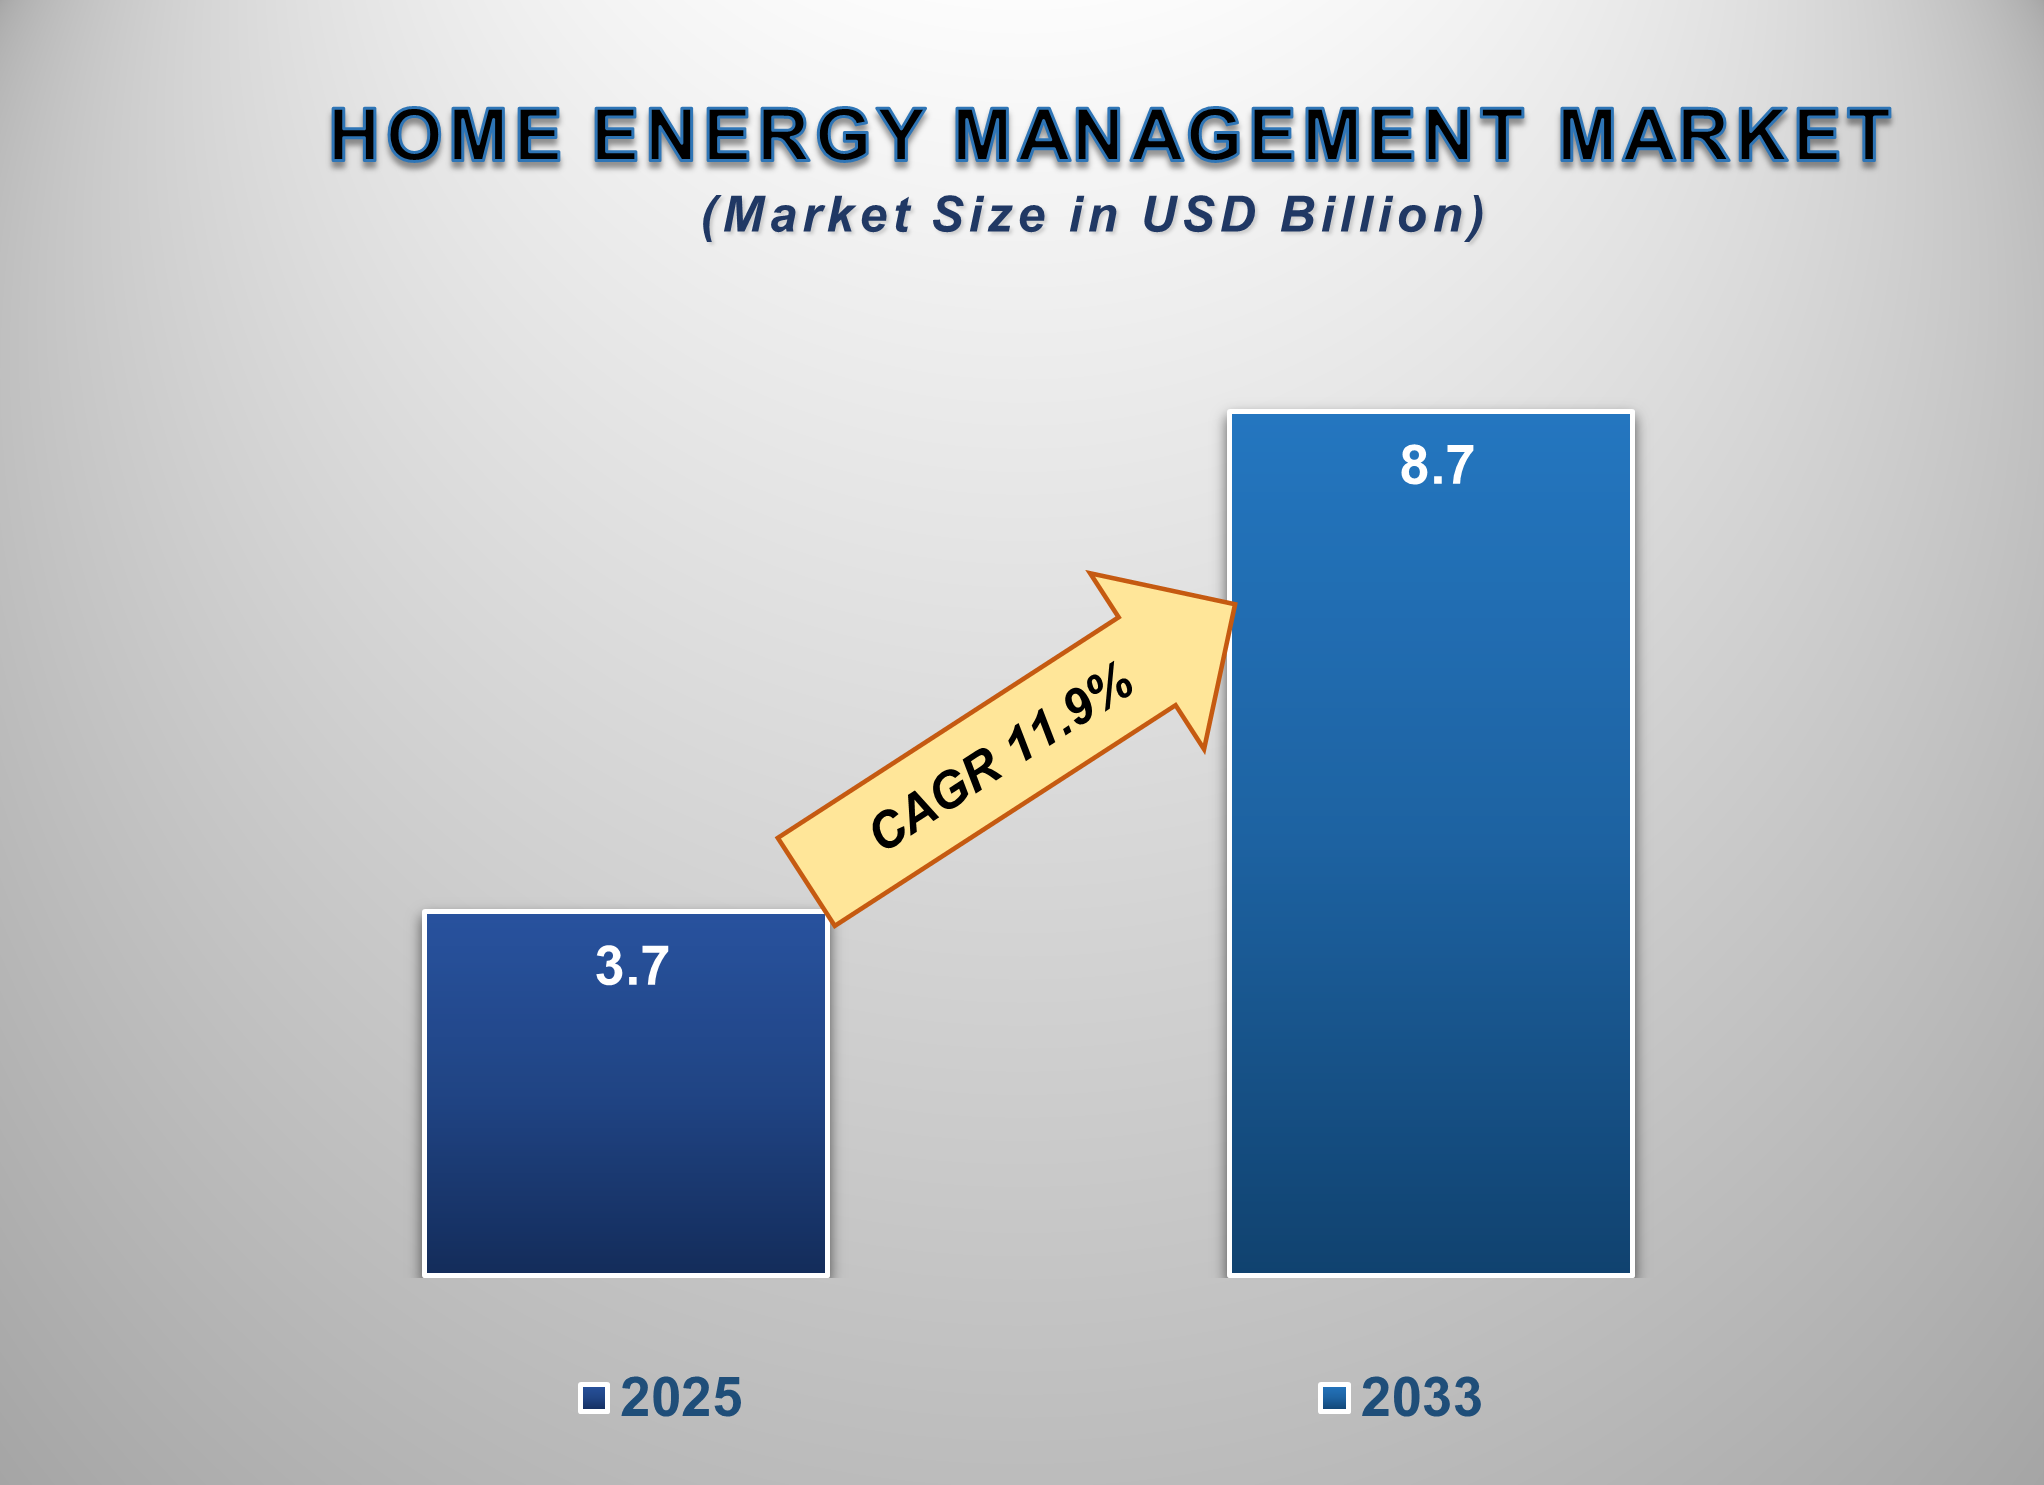
The home energy management market
size is projected to witness substantial growth from 2025 to 2033, fueled by
rising electricity costs, growing consumer awareness of energy conservation,
supportive government policies, and the rapid integration of smart home
devices. Valued at approximately USD 3.7 billion in 2025, the market is
expected to surge to USD 8.7 billion by 2033, reflecting a strong compound
annual growth rate (CAGR) of 11.9% over the forecast period.
The home energy management market is undergoing a significant expansion, driven by the global push for energy efficiency and grid modernization. HEM systems provide homeowners with real-time insights into their energy consumption, enabling automated control of appliances, lighting, and HVAC systems to optimize usage and reduce costs. The proliferation of smart devices like thermostats, plugs, and smart meters is creating a connected ecosystem that HEM platforms can leverage.
Furthermore, the increasing
adoption of renewable energy sources, such as rooftop solar panels, and the
growing interest in residential energy storage systems are creating a more
complex home energy environment, necessitating sophisticated management solutions.
The market is also benefiting from advancements in AI and machine learning,
which allow for predictive analytics and fully automated energy savings. North
America and Europe are currently the leading markets, but the Asia-Pacific
region is expected to exhibit the highest growth rate due to rapid urbanization
and smart city initiatives.
Home Energy Management
Market Drivers and Opportunities
Rising Energy Prices and Consumer Demand for Cost Savings
The
persistent increase in global electricity prices is a primary driver for the
adoption of HEM systems. Homeowners are increasingly seeking ways to reduce
their utility bills, and HEM solutions provide a direct path to achieving these
savings. By offering detailed breakdowns of energy usage by appliance and
enabling automated schedules or rules (e.g., turning off non-essential devices
during peak rate hours), these systems empower consumers to take control of
their energy consumption, leading to significant cost reductions.
Integration with Renewable Energy and Electric Vehicles (EVs)
The
global shift towards sustainability is a major growth driver. Homes equipped
with solar panels use HEM systems to maximize self-consumption of solar energy
and optimize the charging/discharging cycles of home battery storage.
Similarly, the surge in EV adoption creates a new, substantial load on home
energy systems. Smart HEM systems can manage EV charging during off-peak hours
when electricity is cheapest or when solar generation is highest, preventing
grid overload and saving money. This synergy with clean technologies is a key
factor propelling the market forward.
Opportunity for the Home
Energy Management Market
Expansion through Utility-Driven Programs and Virtual Power
Plants (VPPs)
A
significant opportunity lies in collaboration with utility companies. Utilities
are increasingly rolling out Demand Response (DR) programs, where they
incentivize homeowners to reduce energy consumption during periods of high grid
demand. HEM systems are the ideal gateway for consumers to participate in these
programs automatically. This evolution is leading to the creation of Virtual
Power Plants (VPPs), where utilities aggregate the distributed energy resources
(solar, batteries, flexible loads) of thousands of homes to act as a single,
controllable power plant. Companies that can seamlessly integrate their HEM
solutions with utility DR and VPP programs will unlock a new, recurring revenue
stream and accelerate market penetration.
Home Energy Management
Market Scope
|
Report Attributes |
Description |
|
Market Size in 2025 |
USD 3.7 Billion |
|
Market Forecast in 2033 |
USD 8.7 Billion |
|
CAGR % 2025-2033 |
11.8% |
|
Base Year |
2024 |
|
Historic Data |
2020-2024 |
|
Forecast Period |
2025-2033 |
|
Report USP |
Production, Consumption, company share, company heatmap, company
production, growth factors, and more |
|
Segments Covered |
●
By Component ●
By Technology ●
By Application ●
By End-user |
|
Regional Scope |
●
North America ●
Europe ●
APAC ●
Latin America ●
Middle East and Africa |
|
Country Scope |
1)
U.S. 2)
Canada 3)
U.K. 4)
Germany 5)
France 6)
Italy 7)
Spain 8)
Netherlands 9)
China 10)
India 11)
Japan 12)
South Korea 13)
Australia 14)
Mexico 15)
Brazil 16)
Argentina 17)
Saudi Arabia 18)
UAE 19)
Egypt 20) South Africa |
Home Energy Management Market Report Segmentation Analysis
The global home energy management
market industry analysis is segmented by component, by technology, by
application, and by end-user.
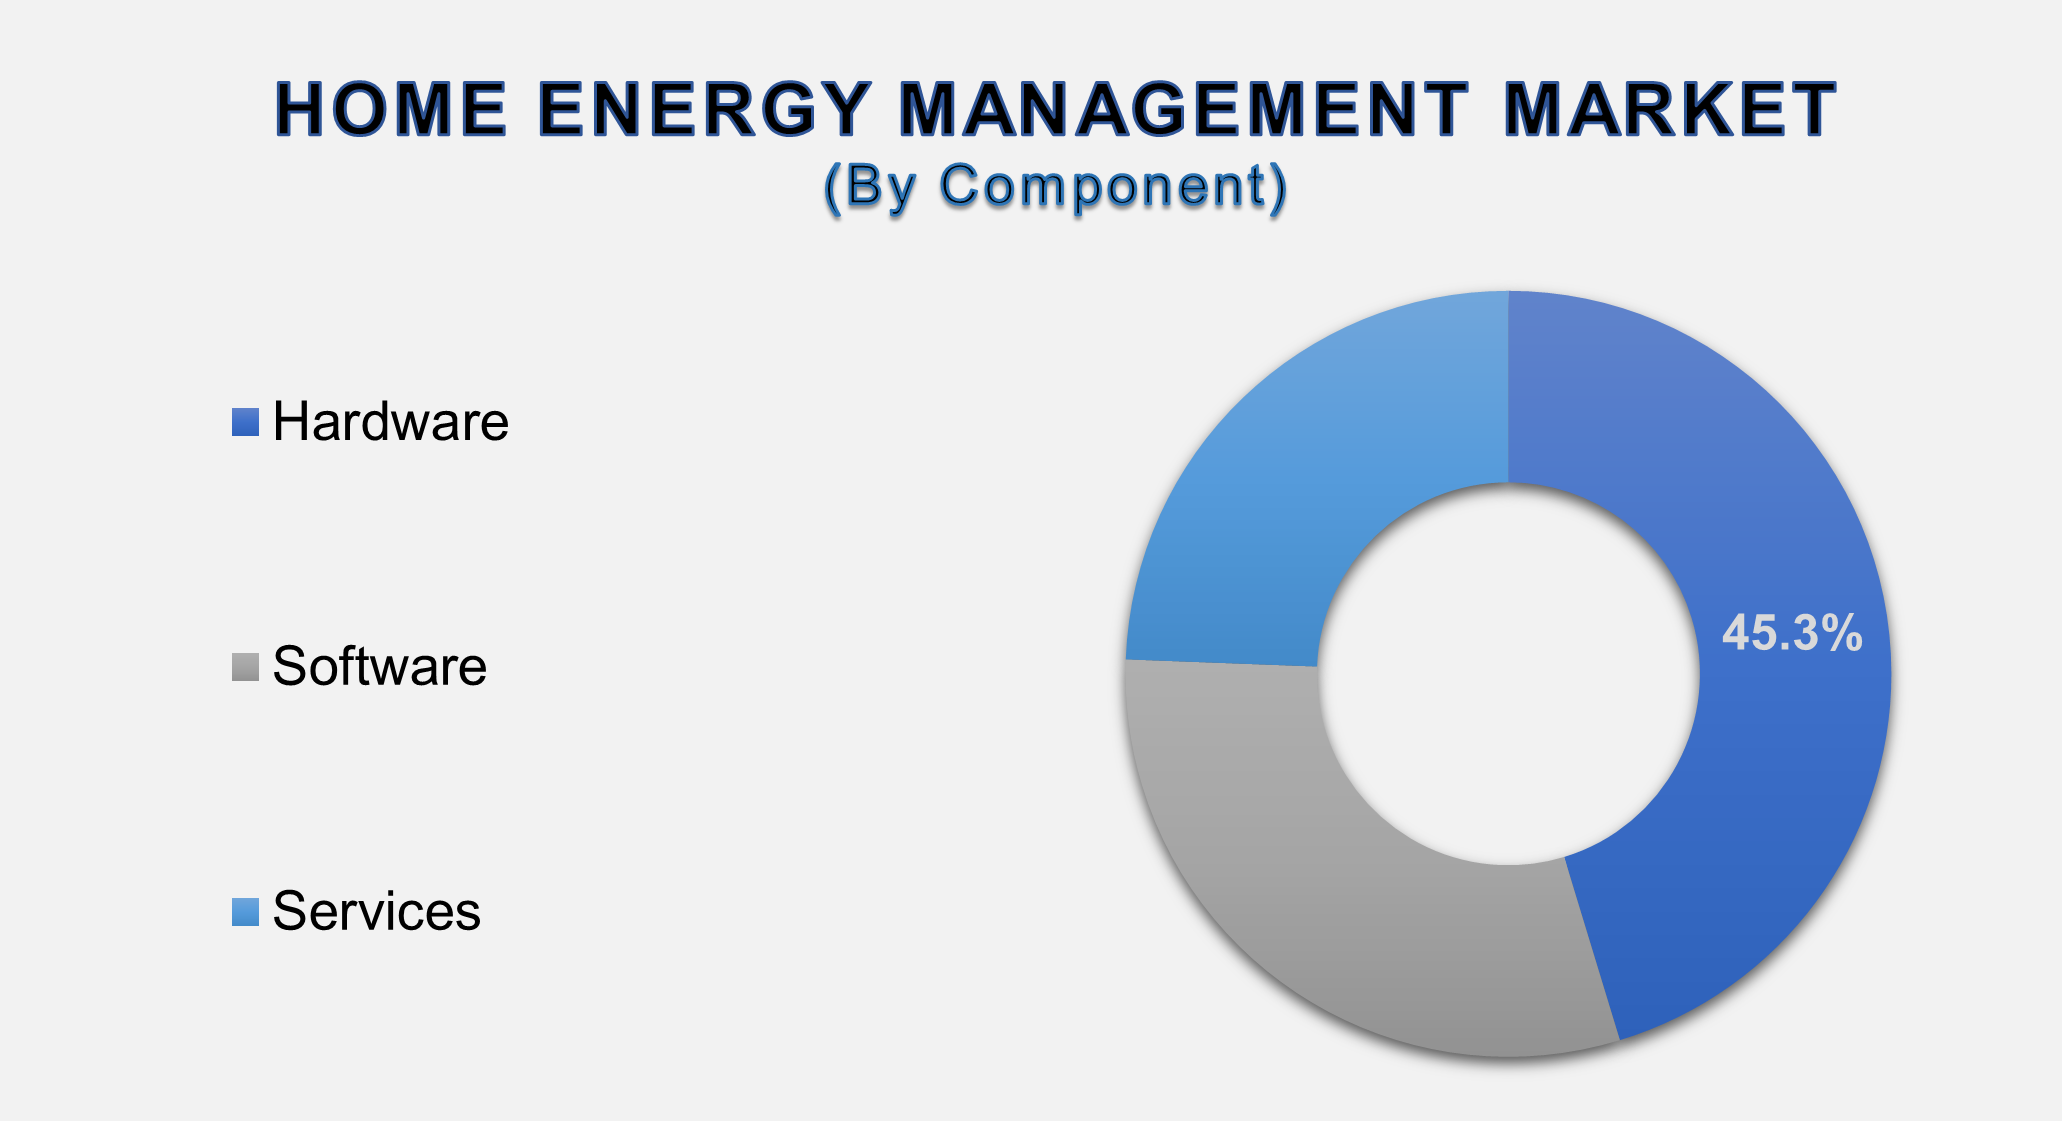
The Dominance of the Hardware Component Segment
The
hardware segment is the cornerstone and revenue leader of the HEM market, as it
comprises the physical devices necessary for system operation. This includes
smart thermostats, smart plugs, in-home displays, gateway controllers, and
smart sensors. Hardware's dominance is secured because it represents the
essential, tangible entry point for consumers into energy management. While
software provides the intelligence, it relies on hardware to collect data and
execute commands. The high unit cost of these devices, coupled with their
necessity for any functional HEM system, ensures this segment's major share.
Furthermore, as the market expands, the initial focus is on hardware
acquisition, with many consumers starting with a single device like a smart
thermostat before expanding into a full ecosystem.
The Commanding Share of the Smart Thermostats Application Segment
The
Smart Thermostats application segment commands a major market share because
heating, ventilation, and air conditioning (HVAC) typically account for the
largest portion of a household's energy bill (often 40-50%). Smart thermostats
address this single biggest cost center directly. They are highly effective,
user-friendly, and offer immediate, noticeable savings by learning user habits
and automatically adjusting temperatures for efficiency. Their widespread
adoption by utilities in rebate programs and their position as a flagship
product in the smart home industry have made them the most recognized and
deployed HEM device. This focus on optimizing the most significant energy load
in the home cements the segment's leadership.
The Leadership of the Residential End-User Segment
The
Residential end-user segment is the largest and core market for HEM systems.
The growth is driven by direct consumer benefits: reduced energy bills,
increased convenience, and enhanced control over the home environment. The
proliferation of single-family homes and high-density apartments, combined with
the rising penetration of smart devices, creates a massive addressable market.
While the commercial sector also uses energy management, the solutions are
often more complex and customized. In contrast, the residential market benefits
from scalable, off-the-shelf products that are easy to install and use, leading
to rapid mass-market adoption and establishing its dominance.
The following segments are part of an in-depth analysis of the global
Home Energy Management Market:
|
Market Segments |
|
|
By Component |
●
Hardware ●
Software ●
Services |
|
By Technology |
●
Z-Wave ●
Zigbee ●
Wi-Fi ●
Thread ●
Others |
|
By Application
|
●
Lighting Controls ●
HVAC Controls ●
Smart Plugs ●
Thermostats ●
Energy Management
Systems ●
Others |
|
By End-user |
●
Residential ●
Commercial |
Home Energy Management
Market Share Analysis by Region
North America is Expected to Dominate the
Home Energy Management Market During the Forecast Period
North America is anticipated to be the leading region in the global Home Energy Management Market. This dominance is attributed to high consumer disposable income, strong awareness of energy efficiency, well-established smart home market penetration, and proactive utility-led demand response programs. The region has a high concentration of key market players and early adopters of technology. Supportive government initiatives and standards further encourage the adoption of energy-efficient solutions, securing North America's leading position. However, the Asia-Pacific region is expected to witness the highest CAGR due to growing urban populations and increasing government investments in smart grid infrastructure.
Global Home Energy Management Market Recent Developments News:
- In January 2025, Google Nest launched a new feature
for its thermostats that automatically optimizes home energy usage to
maximize savings from time-of-use electricity rates without user input.
- In February 2025, Schneider Electric partnered with
a major North American utility to deploy a large-scale Virtual Power Plant
(VPP) program, aggregating thousands of home batteries and smart panels to
provide grid stability.
- In March 2025, Tesla announced the integration of
its Powerwall home battery with a broader range of third-party HEM
software, allowing for more sophisticated energy arbitrage and backup
power management.
- In April 2025, Sense Labs Inc. unveiled a new
sensor technology that uses machine learning to provide even more granular
device-level energy monitoring, identifying specific appliances and their
real-time consumption.
The Global Home Energy
Management Market is dominated by a few large companies, such as
●
Google LLC (Nest)
●
Samsung Electronics
Co., Ltd. (SmartThings)
●
Honeywell
International Inc.
●
Schneider Electric SE
●
Siemens AG
●
Johnson Controls
International plc
●
General Electric
Company
●
LG Electronics Inc.
●
Emerson Electric Co.
●
Alarm.com Incorporated
●
Panasonic Holdings
Corporation
●
Comcast Corporation
(Xfinity)
●
Centrica Hive Ltd.
●
Sense Labs Inc.
● Other Prominent Players
Frequently Asked Questions
Ekta Chaurasia (Team Lead)
Ekta Chaurasia is a highly experienced Team Lead at M2Square Consultancy with over 7 years of expertise in market research, strategic consulting, competitive benchmarking, and business intelligence solutions. She specializes in ICT, semiconductors & electronics, automotive & transportation, and industrial machinery markets.
She leads end-to-end global research projects focused on market trends, industry analysis, growth forecasting, customer insights, and strategic decision-making. Known for her analytical leadership and industry expertise, Ekta helps businesses uncover growth opportunities, evaluate competitive landscapes, and stay ahead in rapidly evolving markets through accurate and insight-driven research.
1. Global Home Energy
Management Market Introduction and Market Overview
1.1.
Objectives
of the Study
1.2.
Global
Home Energy Management Market Scope and Market Estimation
1.2.1.Global Home Energy
Management Market Overall Market Size (US$ Bn), Market CAGR (%), Market
forecast (2025 - 2033)
1.2.2.Global Home Energy
Management Market Revenue Share (%) and Growth Rate (Y-o-Y) from 2020 - 2033
1.3.
Market
Segmentation
1.3.1.Component of Global Home
Energy Management Market
1.3.2.Technology of Global Home
Energy Management Market
1.3.3.Application of Global Home
Energy Management Market
1.3.4.End-user of Global Home
Energy Management Market
1.3.5.Region of Global Home
Energy Management Market
2. Executive
Summary
2.1.
Demand
Side Trends
2.2.
Key
Market Trends
2.3.
Market
Demand (US$ Bn) Analysis 2020 – 2024 and Forecast, 2025 – 2033
2.4.
Demand
and Opportunity Assessment
2.5.
Demand
Supply Scenario
2.6.
Market
Dynamics
2.6.1.Drivers
2.6.2.Limitations
2.6.3.Opportunities
2.6.4.Impact Analysis of Drivers
and Restraints
2.7.
Emerging
Trends for Home Energy Management Market
2.8.
Key
Product/Brand Analysis
2.9.
Pricing
Analysis
2.10.
Porter’s
Five Forces Analysis
2.11.
PEST
Analysis
2.12.
Key
Regulation
3. Global
Home Energy Management Market Estimates
& Historical Trend Analysis (2020 - 2024)
4.
Global Home Energy
Management Market Estimates
& Forecast Trend Analysis, by Component
4.1.
Global
Home Energy Management Market Revenue (US$ Bn) Estimates and Forecasts, by Component,
2020 - 2033
4.1.1.Hardware
4.1.2.Software
4.1.3.Services
5.
Global Home Energy
Management Market Estimates
& Forecast Trend Analysis, by Application
5.1.
Global
Home Energy Management Market Revenue (US$ Bn) Estimates and Forecasts, by Application,
2020 - 2033
5.1.1.Lighting Controls
5.1.2.HVAC Controls
5.1.3.Smart Plugs
5.1.4.Thermostats
5.1.5.Energy Management Systems
5.1.6.Others
6.
Global Home Energy
Management Market Estimates
& Forecast Trend Analysis, by Technology
6.1.
Global
Home Energy Management Market Revenue (US$ Bn) Estimates and Forecasts, by Technology,
2020 - 2033
6.1.1.Z-Wave
6.1.2.Zigbee
6.1.3.Wi-Fi
6.1.4.Thread
6.1.5.Others
7.
Global Home Energy
Management Market Estimates
& Forecast Trend Analysis, by End-user
7.1.
Global
Home Energy Management Market Revenue (US$ Bn) Estimates and Forecasts, by End-user,
2020 - 2033
7.1.1.Residential
7.1.2.Commercial
8. Global
Home Energy Management Market Estimates
& Forecast Trend Analysis, by region
1.1.
Global
Home Energy Management Market Revenue (US$ Bn) Estimates and Forecasts, by
region, 2020 - 2033
1.1.1.North America
1.1.2.Europe
1.1.3.Asia Pacific
1.1.4.Middle East & Africa
1.1.5.Latin America
9. North America Home
Energy Management Market: Estimates
& Forecast Trend Analysis
9.1. North America Home Energy
Management Market Assessments & Key Findings
9.1.1.North America Home Energy
Management Market Introduction
9.1.2.North America Home Energy
Management Market Size Estimates and Forecast (US$ Billion) (2020 - 2033)
9.1.2.1. By Component
9.1.2.2. By Technology
9.1.2.3. By Application
9.1.2.4. By End-user
9.1.2.5.
By
Country
9.1.2.5.1.
The
U.S.
9.1.2.5.2.
Canada
10. Europe Home
Energy Management Market: Estimates
& Forecast Trend Analysis
10.1.
Europe
Home Energy Management Market Assessments & Key Findings
10.1.1.
Europe
Home Energy Management Market Introduction
10.1.2.
Europe
Home Energy Management Market Size Estimates and Forecast (US$ Billion) (2020 -
2033)
10.1.2.1. By Component
10.1.2.2. By Technology
10.1.2.3. By Application
10.1.2.4. By End-user
10.1.2.5.
By
Country
10.1.2.5.1. Germany
10.1.2.5.2. Italy
10.1.2.5.3. U.K.
10.1.2.5.4. France
10.1.2.5.5. Spain
10.1.2.5.6. Netherland
10.1.2.5.7.
Rest of Europe
11. Asia Pacific Home
Energy Management Market: Estimates
& Forecast Trend Analysis
11.1.
Asia
Pacific Market Assessments & Key Findings
11.1.1.
Asia
Pacific Home Energy Management Market Introduction
11.1.2.
Asia
Pacific Home Energy Management Market Size Estimates and Forecast (US$ Billion)
(2020 - 2033)
11.1.2.1. By Component
11.1.2.2. By Technology
11.1.2.3. By Application
11.1.2.4. By End-user
11.1.2.5.
By
Country
11.1.2.5.1. China
11.1.2.5.2. Japan
11.1.2.5.3. India
11.1.2.5.4. Australia
11.1.2.5.5. South Korea
11.1.2.5.6.
Rest
of Asia Pacific
12. Middle East & Africa Home
Energy Management Market: Estimates
& Forecast Trend Analysis
12.1.
Middle
East & Africa Market Assessments & Key Findings
12.1.1.
Middle East & Africa Home Energy Management Market
Introduction
12.1.2.
Middle East & Africa Home Energy Management Market Size Estimates
and Forecast (US$ Billion) (2020 - 2033)
12.1.2.1. By Component
12.1.2.2. By Technology
12.1.2.3. By Application
12.1.2.4. By End-user
12.1.2.5.
By
Country
12.1.2.5.1. UAE
12.1.2.5.2. Saudi
Arabia
12.1.2.5.3. South
Africa
12.1.2.5.4.
Rest of MEA
13. Latin America
Home Energy Management Market:
Estimates & Forecast Trend Analysis
13.1.
Latin
America Market Assessments & Key Findings
13.1.1.
Latin
America Home Energy Management Market Introduction
13.1.2.
Latin
America Home Energy Management Market Size Estimates and Forecast (US$ Billion)
(2020 - 2033)
13.1.2.1. By Component
13.1.2.2. By Technology
13.1.2.3. By Application
13.1.2.4. By End-user
13.1.2.5.
By
Country
13.1.2.5.1. Brazil
13.1.2.5.2. Mexico
13.1.2.5.3. Argentina
13.1.2.5.4.
Rest of LATAM
14. Country Wise Market:
Introduction
15.
Competition
Landscape
15.1.
Global
Home Energy Management Market Product Mapping
15.2.
Global
Home Energy Management Market Concentration Analysis, by Leading Players /
Innovators / Emerging Players / New Entrants
15.3.
Global
Home Energy Management Market Tier Structure Analysis
15.4.
Global
Home Energy Management Market Concentration & Company Market Shares (%)
Analysis, 2024
16.
Company
Profiles
16.1. Google LLC
(Nest)
16.1.1.
Company
Overview & Key Stats
16.1.2.
Financial
Performance & KPIs
16.1.3.
Material
Portfolio
16.1.4.
SWOT
Analysis
16.1.5.
Business
Strategy & Recent Developments
* Similar details would be provided for all
the players mentioned below
16.2. Samsung
Electronics Co., Ltd. (SmartThings)
16.3. Honeywell
International Inc.
16.4. Schneider
Electric SE
16.5. Siemens AG
16.6. Johnson
Controls International plc
16.7. General
Electric Company
16.8. LG
Electronics Inc.
16.9. Emerson
Electric Co.
16.10. Alarm.com Incorporated
16.11. Panasonic
Holdings Corporation
16.12. Comcast
Corporation (Xfinity)
16.13. Centrica Hive
Ltd.
16.14. Sense Labs
Inc.
16.15. Other
Prominent Players
17. Research
Methodology
17.1.
External
Databases
17.2.
Internal
Proprietary Database
17.3.
Primary
Research
17.4.
Secondary
Research
17.5.
Assumptions
17.6.
Limitations
17.7.
Report
FAQs
18. Research
Findings & Conclusion
Our Research Methodology
"Insight without rigor is just noise."
We follow a comprehensive, multi-phase research framework designed to deliver accurate, strategic, and decision-ready intelligence. Our process integrates primary and secondary research , both quantitative and qualitative , along with dual modeling techniques ( top-down and bottom-up) and a final layer of validation through our proprietary in-house repository.
PRIMARY RESEARCH
Primary research captures real-time, firsthand insights from the market to understand behaviors, motivations, and emerging trends.
1. Quantitative Primary Research
Objective: Generate statistically significant data directly from market participants.
Approaches:- Structured surveys with customers, distributors, and field agents
- Mobile-based data collection for point-of-sale audits and usage behavior
- Phone-based interviews (CATI) for market sizing and product feedback
- Online polling around industry events and digital campaigns
- Purchase frequency by customer type
- Channel performance across geographies
- Feature demand by application or demographic
2. Qualitative Primary Research
Objective: Explore decision-making drivers, pain points, and market readiness.
Approaches:- In-depth interviews (IDIs) with executives, product managers, and key decision-makers
- Focus groups among end users and early adopters
- Site visits and observational research for consumer products
- Informal field-level discussions for regional and cultural nuances
SECONDARY RESEARCH
This phase helps establish a macro-to-micro understanding of market trends, size, regulation, and competitive dynamics, sourced from credible and public domain information.
1. Quantitative Secondary Research
Objective: Model market value and segment-level forecasts based on published data.
Sources include:- Financial reports and investor summaries
- Government trade data, customs records, and regulatory statistics
- Industry association publications and economic databases
- Channel performance and pricing data from marketplace listings
- Revenue splits, pricing trends, and CAGR estimates
- Supply-side capacity and volume tracking
- Investment analysis and funding benchmarks
2. Qualitative Secondary Research
Objective: Capture strategic direction, innovation signals, and behavioral trends.
Sources include:- Company announcements, roadmaps, and product pipelines
- Publicly available whitepapers, conference abstracts, and academic research
- Regulatory body publications and policy briefs
- Social and media sentiment scanning for early-stage shifts
- Strategic shifts in market positioning
- Unmet needs and white spaces
- Regulatory triggers and compliance impact

DUAL MODELING: TOP-DOWN + BOTTOM-UP
To ensure robust market estimation, we apply two complementary sizing approaches:
Top-Down Modeling:- Start with broader industry value (e.g., global or regional TAM)
- Apply filters by segment, geography, end-user, or use case
- Adjust with primary insights and validation benchmarks
- Ideal for investor-grade market scans and opportunity mapping
- Aggregate from the ground up using sales volumes, pricing, and unit economics
- Use internal modeling templates aligned with stakeholder data
- Incorporate distributor-level or region-specific inputs
- Most accurate for emerging segments and granular sub-markets
DATA VALIDATION: IN-HOUSE REPOSITORY
We close the loop with proprietary data intelligence built from ongoing projects, industry monitoring, and historical benchmarking. This repository includes:
- Multi-sector market and pricing models
- Key trendlines from past interviews and forecasts
- Benchmarked adoption rates, churn patterns, and ROI indicators
- Industry-specific deviation flags and cross-check logic
- Catches inconsistencies early
- Aligns projections across studies
- Enables consistent, high-trust deliverables