
Incentive Tourism Market Size and Forecast (2020-2033), Global and Regional Growth, Trend, Share, and Industry Analysis Report Coverage: By Incentive Type (Monetary Incentives, Experience-Based Incentives, Recognition-Based Incentives), By Business Size (Large Enterprises, SMEs, Startups), By End User (Corporate Employees, Channel Partners, Sales Teams, Distributors) And Geography
2025-12-12
Travel & Hospitality
Ekta Chaurasia (Team Lead)
Description
Incentive Tourism Market Overview
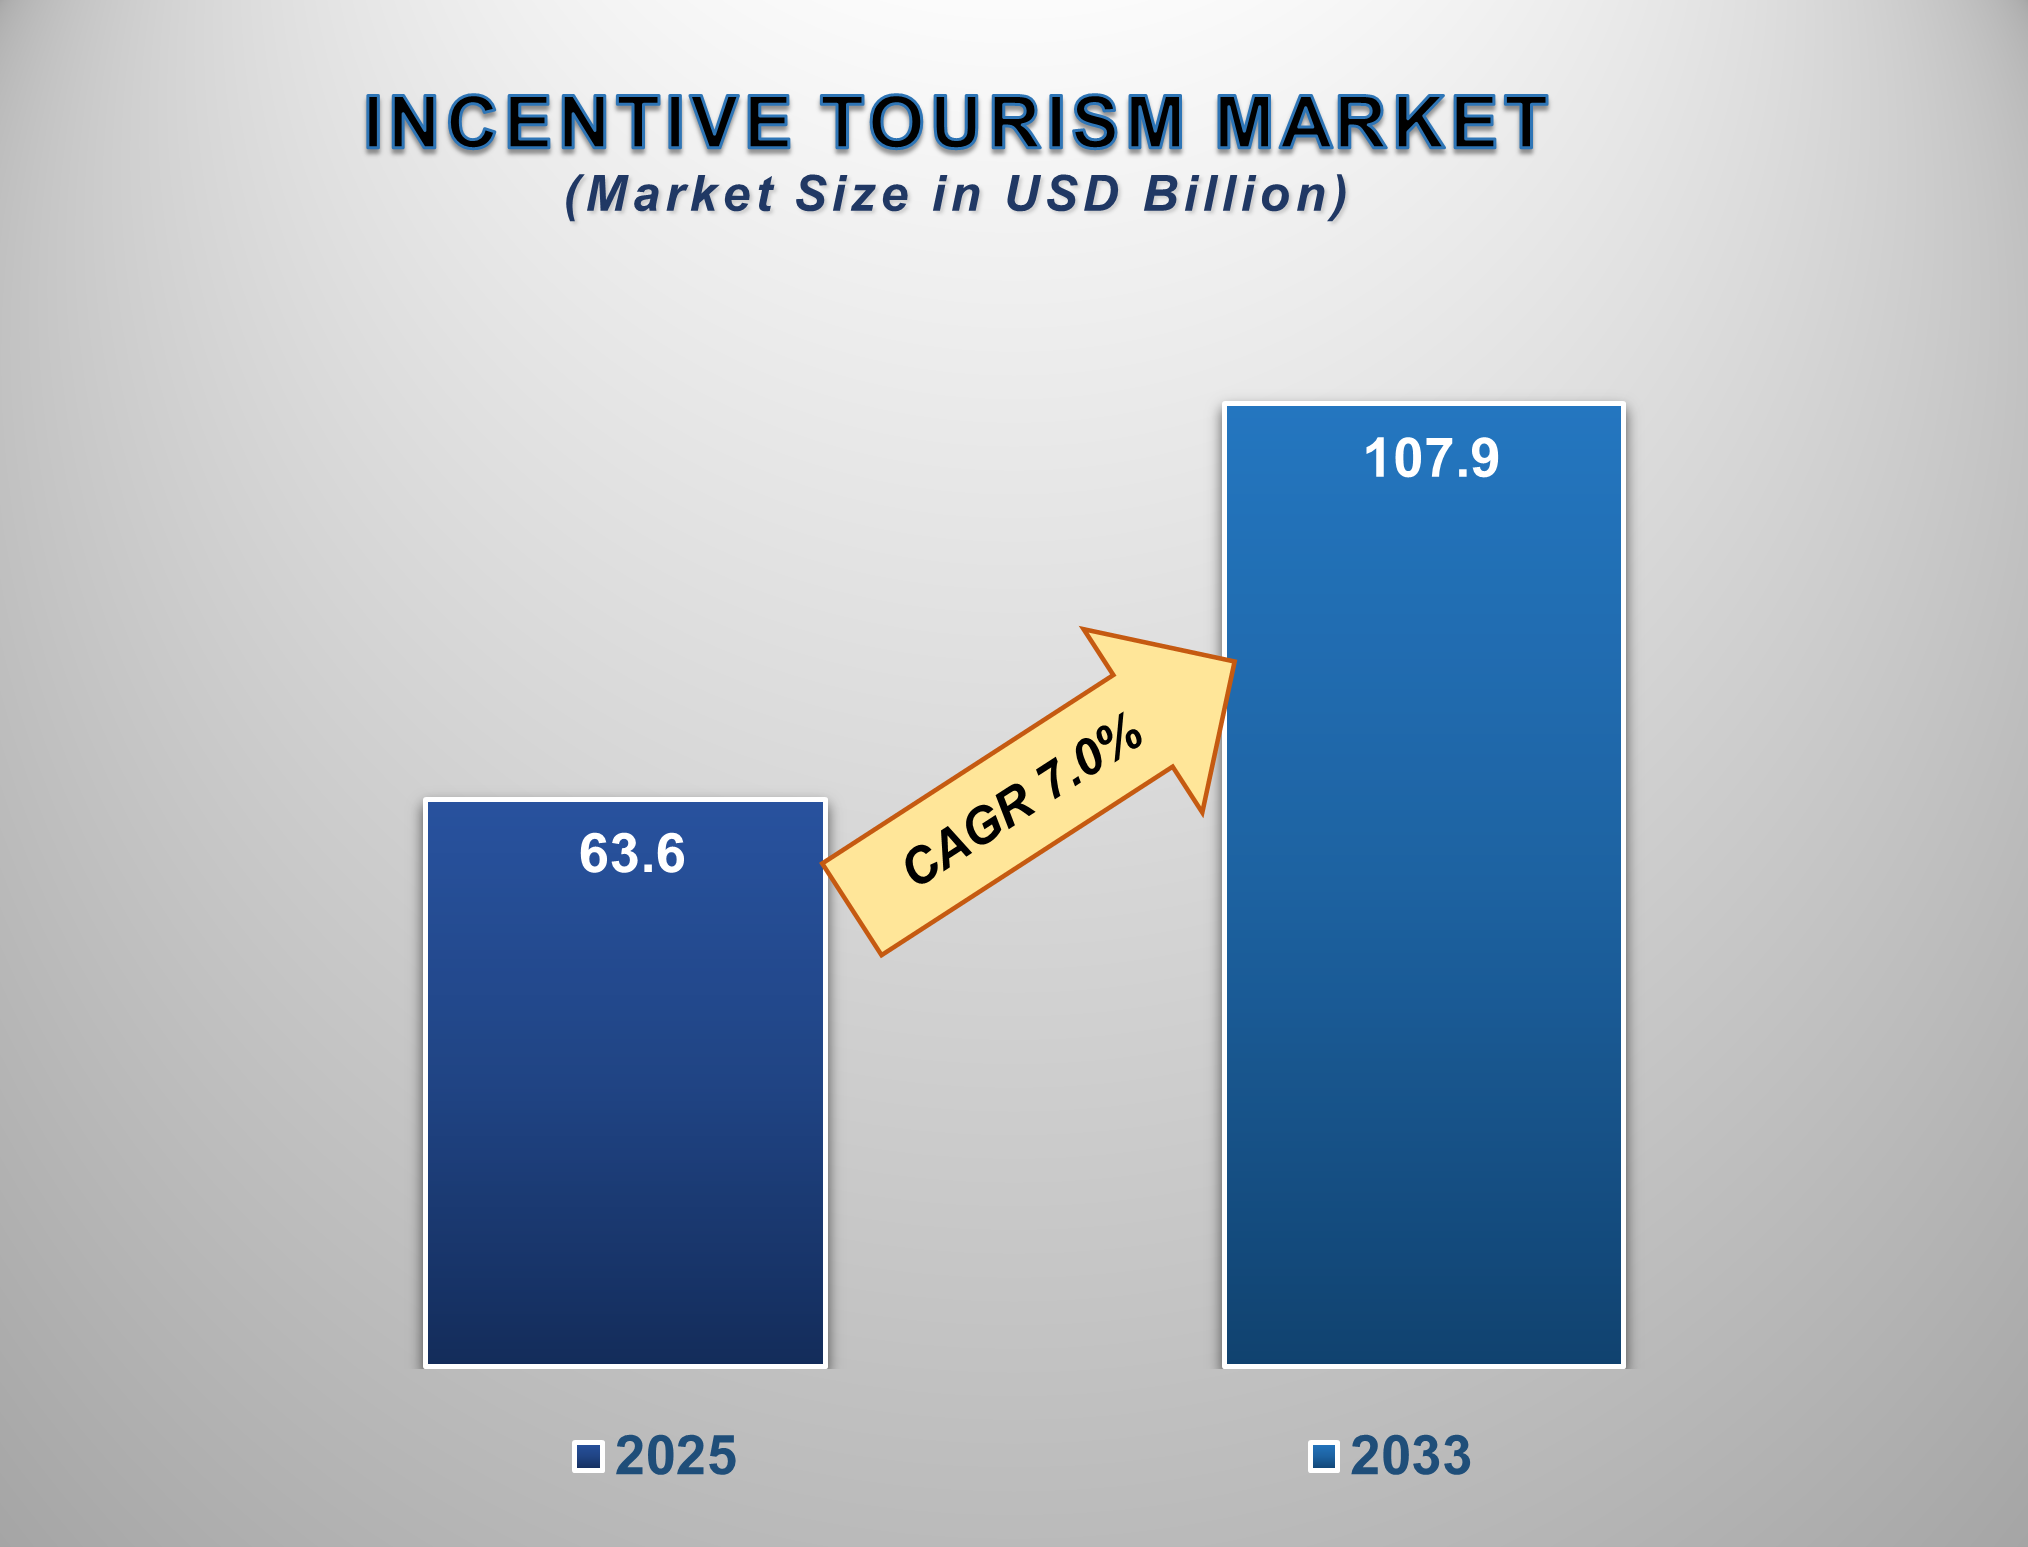
The Incentive Tourism Market is poised for robust and sustained growth from 2025 to 2033, fuelled by the corporate sector's increasing focus on employee motivation, talent retention, and performance enhancement. The market is projected to be valued at approximately USD 63.6 billion in 2025 and is forecasted to reach nearly USD 107.9 billion by 2033, exhibiting a compound annual growth rate (CAGR) of 7.0% during this period.
Incentive tourism is a strategic management tool
used by organizations to reward and recognize high-performing employees, sales
teams, channel partners, and clients through curated travel experiences. Unlike
standard vacations, these trips are all-expenses-paid, high-quality experiences
designed to foster loyalty, boost morale, and encourage future performance. The
market's expansion is underpinned by the post-pandemic shift towards
experiential rewards over material goods, the global expansion of businesses
requiring sophisticated engagement strategies, and the proven return on
investment (ROI) of such programs in driving sales and productivity.
Factors such as the growing competition for top
talent, the rise of hybrid work models necessitating stronger team cohesion,
and the increasing demand for personalized and unique experiences are key
contributors to market growth. North America currently holds the largest market
share due to a mature corporate culture of incentives, while the Asia-Pacific
region is expected to be the fastest-growing market, driven by its rapidly
expanding corporate sector and growing MICE (Meetings, Incentives, Conferences,
and Exhibitions) industry.
Incentive Tourism Market Drivers and
Opportunities
Corporate Focus on Employee Engagement and Talent Retention
is the Primary Market Driver
The most significant driver for the incentive
tourism market is the intensifying corporate war for talent. Companies across
sectors are leveraging high-value travel experiences as a powerful
differentiator to attract, motivate, and retain top performers. In an era of
high employee turnover, incentive trips serve as a tangible and memorable
reward that boosts morale, fosters a sense of belonging, and strengthens
company culture. The proven correlation between well-structured incentive
programs and increased sales performance, productivity, and employee loyalty
provides a clear business case for continued and increased investment in this
area.
Post-Pandemic Shift Towards Experiential Rewards and
"Bleisure" is Driving Market Evolution
The COVID-19 pandemic catalyzed a shift in
employee preferences, with a greater emphasis on meaningful experiences and
work-life integration. This has directly benefited the incentive tourism
market, as travel is perceived as a more valuable and aspirational reward than
cash bonuses or gifts. Furthermore, the rise of "bleisure" (blending
business with leisure) has become a standard expectation. Incentive trips are
increasingly designed with ample free time, unique local cultural immersions,
and wellness activities, making them more appealing and effective. This trend
encourages companies to invest in high-quality, experience-driven itineraries.
Digitalization and Personalization Present Significant
Opportunities
The integration of advanced technology is
creating substantial growth opportunities within the market. The use of data
analytics allows for the personalization of travel rewards, tailoring
destinations and activities to the preferences of the winner, thereby
increasing the perceived value. Furthermore, digital platforms for tracking
performance, managing program logistics, and creating pre- and post-trip
engagement are becoming essential. For market players, significant
opportunities lie in developing tech-enabled, turnkey solutions for
corporations of all sizes, offering sustainable and socially responsible travel
options, and creating unique, "Instagrammable" experiences in emerging destinations that cater to the
desire for exclusivity and novelty.
Incentive Tourism Market
Scope
|
Report Attributes |
Description |
|
Market Size in 2025 |
USD 63.6 Billion |
|
Market Forecast in 2033 |
USD 107.9 Billion |
|
CAGR % 2025-2033 |
7.0% |
|
Base Year |
2024 |
|
Historic Data |
2020-2024 |
|
Forecast Period |
2025-2033 |
|
Report USP |
Product Portfolio,
Technological Analysis, Company Market Share, Company Heatmap, Pricing
Analysis, Growth Factors and more |
|
Segments Covered |
●
By Incentive Type
●
By Business Size ●
By End-user |
|
Regional Scope |
●
North America, ●
Europe, ●
APAC, ●
Latin America ●
Middle East and
Africa |
|
Country Scope |
1)
U.S. 2)
Canada 3)
Germany 4)
UK 5)
France 6)
Spain 7)
Italy 8)
Switzerland 9)
China 10)
Japan 11)
India 12)
Australia 13)
South Korea 14)
Brazil 15)
Mexico 16)
Argentina 17)
South Africa 18)
Saudi Arabia 19)
UAE |
Incentive Tourism Market Report Segmentation
Analysis
The global Incentive Tourism
Market industry analysis is segmented by Incentive Type, by Business Size, by
End User, and by region.
The Experience-Based
Incentives segment is anticipated to command a significant market share in
2025.
The Incentive Type segment is categorized into
Monetary Incentives, Experience-Based Incentives, and Recognition-Based
Incentives. The Experience-Based Incentives segment, which includes
all-inclusive travel packages, adventure trips, and luxury retreats, is the
largest and fastest-growing. This dominance is driven by the "experience
economy," where memories are valued over material goods. A well-curated
trip offers emotional resonance and shared experiences that cash bonuses cannot
match, leading to higher perceived value and longer-lasting motivation among
recipients.
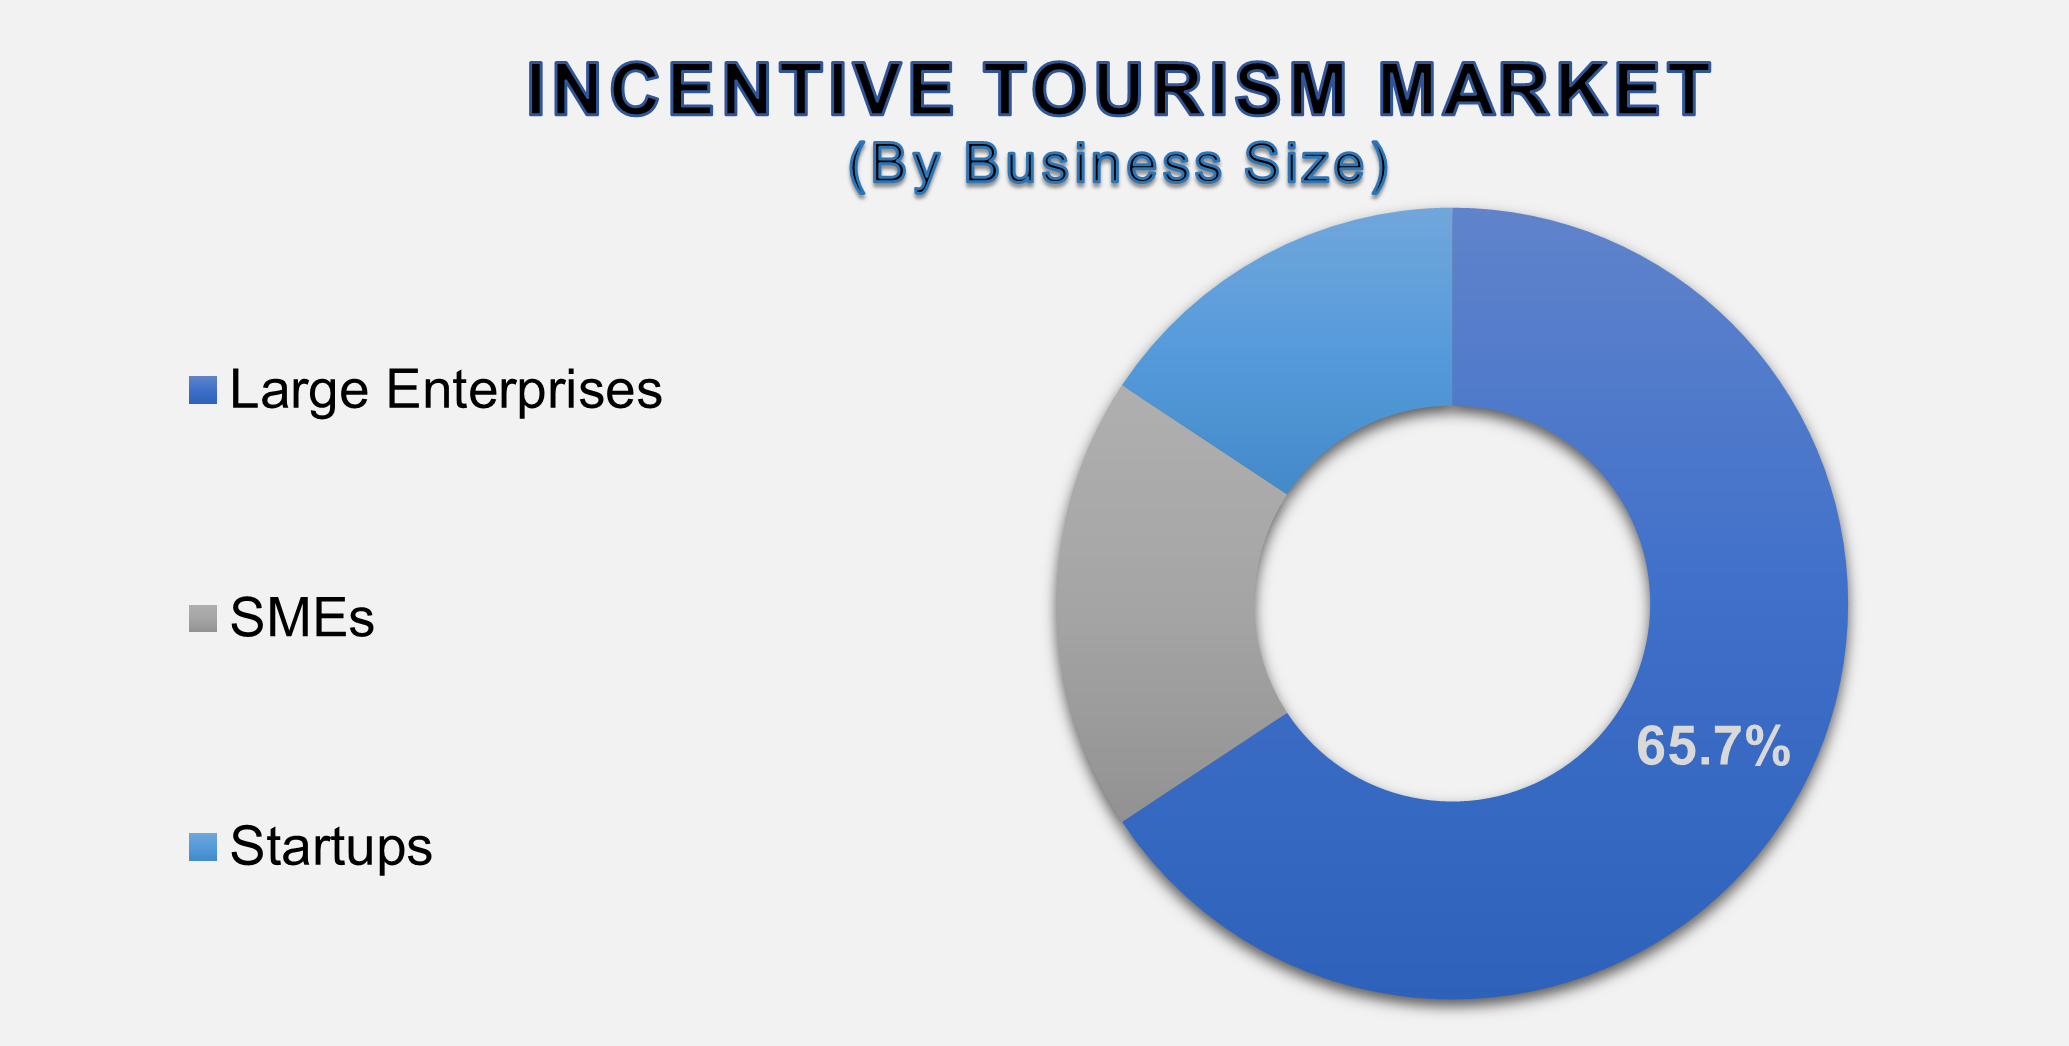
The Large Enterprises
segment is projected to be a cornerstone of the market.
The Business Size segment is divided into Large
Enterprises, SMEs, and Startups. Large Enterprises hold the dominant market
share due to their substantial budgets, established HR and sales incentive
structures, and global footprint. These corporations have the resources to
execute large-scale, high-value incentive trips for hundreds of qualifiers
simultaneously, often negotiating premium rates with travel providers. Their
long-standing use of incentive travel as a strategic tool consolidates their
position as the primary revenue generator for the market.
The Sales Teams segment
holds the largest market share.
The End User segment includes Corporate
Employees, Channel Partners, Sales Teams, and Distributors. The Sales Teams
segment is the traditional and most significant end-user. Incentive travel is a
cornerstone of sales motivation strategies, directly linking exceptional
performance to an aspirational reward. These programs are designed to drive
revenue growth, increase market share, and foster healthy competition. While
programs for other end-users are growing, the direct and measurable impact on
sales performance ensures this segment's leading position.
The following segments are part of an in-depth analysis of
the global Incentive Tourism Market:
|
Market
Segments |
|
|
By Incentive
Type |
●
Monetary Incentives ●
Experience-Based
Incentives ●
Recognition-Based
Incentives |
|
By Business
Size |
●
Large Enterprises ●
SMEs ●
Startups |
|
By End-user |
●
Corporate Employees ●
Channel Partners ●
Sales Teams ●
Distributors |
Incentive Tourism Market Share Analysis by Region
The North America region
is anticipated to hold the largest portion of the Incentive Tourism Market
globally throughout the forecast period
North America's dominance is attributed to its
mature corporate culture that has long recognized the value of non-cash
incentives. The region is home to a high concentration of multinational
corporations, particularly in the BFSI, IT, and pharmaceutical sectors, which
have well-established, large-budget incentive programs. The presence of a
highly developed travel and hospitality infrastructure, including world-class
resorts and destination management companies, further consolidates North
America's position as the leading market.
The Asia-Pacific incentive tourism market is
poised to be the fastest-growing, driven by rapid economic expansion and the
corporate sector's increasing globalization. Countries like China, India, and
Singapore are emerging as major hubs for both outbound and inbound incentive
travel. As companies in this region compete for talent on a global scale, they
are increasingly adopting sophisticated Western-style incentive strategies. The
growing middle class and rising disposable incomes are also making travel a more
aspirational reward, fueling demand for these programs.
Incentive Tourism Market
Competition Landscape Analysis
The global incentive tourism
market is fragmented, with a mix of large global travel conglomerates,
specialized Destination Management Companies (DMCs), and corporate travel
agencies. Competition is based on destination expertise, creativity in program
design, logistical execution, global reach, and the ability to demonstrate ROI
to corporate clients. Key strategies include forming strategic alliances with
hotel chains and airlines, investing in technology platforms for seamless
program management, specializing in niche segments like sustainable tourism or
adventure travel, and expanding service networks in high-growth emerging
markets.
Global Incentive Tourism
Market Recent Developments News:
- In January 2025, Marriott International launched a new dedicated
division, "Marriott Incentive Excellence," offering end-to-end
program management and exclusive property buyouts for large corporate
incentive groups.
- In November 2024, American Express Global Business Travel (Amex GBT)
acquired a leading European DMC to strengthen its on-the-ground expertise
and curated experience offerings for its incentive clients.
- In September 2024, the
Incentive Research Foundation (IRF) published a landmark study confirming
a direct 35% average sales lift for companies implementing well-structured
travel incentive programs, boosting corporate investment.
- In July 2024, several top-tier cruise lines, including Royal
Caribbean and Celebrity Cruises, introduced new, fully customizable
"Incentive at Sea" packages, targeting the mid-market corporate
segment with all-inclusive pricing.
The Global Incentive
Tourism Market Is Dominated by a Few Large Companies, such as
●
Marriott
International, Inc.
●
Hilton Worldwide
Holdings Inc.
●
American Express
Global Business Travel (Amex GBT)
●
CWT (Carlson Wagonlit
Travel)
●
BCD Travel
●
ITA Group
●
BI Worldwide
●
Maritz Holdings Inc.
●
Creative Group, Inc.
●
One10, LLC
●
Omega World Travel
●
FCM Travel Solutions
● Other Prominent Players
Frequently Asked Questions
Ekta Chaurasia (Team Lead)
Ekta Chaurasia is a highly experienced Team Lead at M2Square Consultancy with over 7 years of expertise in market research, strategic consulting, competitive benchmarking, and business intelligence solutions. She specializes in ICT, semiconductors & electronics, automotive & transportation, and industrial machinery markets.
She leads end-to-end global research projects focused on market trends, industry analysis, growth forecasting, customer insights, and strategic decision-making. Known for her analytical leadership and industry expertise, Ekta helps businesses uncover growth opportunities, evaluate competitive landscapes, and stay ahead in rapidly evolving markets through accurate and insight-driven research.
1. Global Incentive Tourism
Market Introduction and Market Overview
1.1.
Objectives
of the Study
1.2.
Global
Incentive Tourism Market Scope and Market Estimation
1.2.1.Global Electronic Toll
Collection Overall Market Size (US$ Bn), Market CAGR (%), Market forecast (2025
- 2033)
1.2.2.Global Incentive Tourism
Market Revenue Share (%) and Growth Rate (Y-o-Y) from 2020 - 2033
1.3.
Market
Segmentation
1.3.1.Incentive Type of Global Incentive
Tourism Market
1.3.2.Business Size of Global Incentive
Tourism Market
1.3.3.End-user of Global Incentive
Tourism Market
1.3.4.Region of Global Incentive
Tourism Market
2. Executive
Summary
2.1.
Demand
Side Trends
2.2.
Key
Market Trends
2.3.
Market
Demand (US$ Bn) Analysis 2020 – 2024 and forecast, 2025 – 2033
2.4.
Demand
and Opportunity Assessment
2.5.
Technological
Advancements
2.6.
Key
Developments
2.7.
Market
Entry Strategies
2.8.
Market
Dynamics
2.8.1.Drivers
2.8.2.Limitations
2.8.3.Opportunities
2.8.4.Impact Analysis of Drivers
and Restraints
2.9.
Porter’s
Five Forces Analysis
2.10.
PEST
Analysis
3. Global
Incentive Tourism Market Estimates
& Historical Trend Analysis (2020 - 2024)
4. Global
Incentive Tourism Market Estimates
& Forecast Trend Analysis, by Incentive Type
4.1.
Global
Incentive Tourism Market Revenue (US$ Bn) Estimates and Forecasts, by Incentive
Type, 2020 - 2033
4.1.1.Monetary Incentives
4.1.2.Experience-Based
Incentives
4.1.3.Recognition-Based
Incentives
5. Global
Incentive Tourism Market Estimates
& Forecast Trend Analysis, by Business Size
5.1.
Global
Incentive Tourism Market Revenue (US$ Bn) Estimates and Forecasts, by Business
Size, 2020 - 2033
5.1.1.Large Enterprises
5.1.2.SMEs
5.1.3.Startups
6. Global
Incentive Tourism Market Estimates
& Forecast Trend Analysis, by End-user
6.1.
Global
Incentive Tourism Market Revenue (US$ Bn) Estimates and Forecasts, by End-user
2020 - 2033
6.1.1.Corporate Employees
6.1.2.Channel Partners
6.1.3.Sales Teams
6.1.4.Distributors
7. Global
Incentive Tourism Market Estimates
& Forecast Trend Analysis, by region
7.1.
Global
Incentive Tourism Market Revenue (US$ Bn) Estimates and Forecasts, by region, 2020
- 2033
7.1.1.North America
7.1.2.Europe
7.1.3.Asia Pacific
7.1.4.Middle East & Africa
7.1.5.Latin America
8. North America Incentive
Tourism Market: Estimates &
Forecast Trend Analysis
8.1.
North
America Incentive Tourism Market Assessments & Key Findings
8.1.1.North America Incentive
Tourism Market Introduction
8.1.2.North America Incentive
Tourism Market Size Estimates and Forecast (US$ Billion) (2020 - 2033)
8.1.2.1. By Incentive
Type
8.1.2.2. By Business
Size
8.1.2.3. By End-user
8.1.2.4.
By
Country
8.1.2.4.1. The U.S.
8.1.2.4.2. Canada
9. Europe Incentive
Tourism Market: Estimates &
Forecast Trend Analysis
9.1.
Europe
Incentive Tourism Market Assessments & Key Findings
9.1.1.Europe Incentive Tourism
Market Introduction
9.1.2.Europe Incentive Tourism
Market Size Estimates and Forecast (US$ Billion) (2020 - 2033)
9.1.2.1. By Incentive
Type
9.1.2.2. By Business
Size
9.1.2.3. By End-user
9.1.2.4.
By
Country
9.1.2.4.1.
Germany
9.1.2.4.2.
Italy
9.1.2.4.3.
U.K.
9.1.2.4.4.
France
9.1.2.4.5.
Spain
9.1.2.4.6.
Switzerland
9.1.2.4.7. Rest
of Europe
10. Asia Pacific Incentive
Tourism Market: Estimates &
Forecast Trend Analysis
10.1.
Asia
Pacific Market Assessments & Key Findings
10.1.1.
Asia
Pacific Incentive Tourism Market Introduction
10.1.2.
Asia
Pacific Incentive Tourism Market Size Estimates and Forecast (US$ Billion) (2020
- 2033)
10.1.2.1. By Incentive
Type
10.1.2.2. By Business
Size
10.1.2.3. By End-user
10.1.2.4.
By
Country
10.1.2.4.1. China
10.1.2.4.2. Japan
10.1.2.4.3. India
10.1.2.4.4. Australia
10.1.2.4.5. South Korea
10.1.2.4.6. Rest of Asia Pacific
11. Middle East & Africa Incentive
Tourism Market: Estimates &
Forecast Trend Analysis
11.1.
Middle
East & Africa Market Assessments & Key Findings
11.1.1.
Middle East & Africa Incentive Tourism Market
Introduction
11.1.2.
Middle East & Africa Incentive Tourism Market Size Estimates
and Forecast (US$ Billion) (2020 - 2033)
11.1.2.1. By Incentive
Type
11.1.2.2. By Business
Size
11.1.2.3. By End-user
11.1.2.4.
By
Country
11.1.2.4.1. UAE
11.1.2.4.2. Saudi
Arabia
11.1.2.4.3. South
Africa
11.1.2.4.4. Rest
of MEA
12. Latin America
Incentive Tourism Market: Estimates
& Forecast Trend Analysis
12.1.
Latin
America Market Assessments & Key Findings
12.1.1.
Latin
America Incentive Tourism Market Introduction
12.1.2.
Latin
America Incentive Tourism Market Size Estimates and Forecast (US$ Billion) (2020
- 2033)
12.1.2.1. By Incentive
Type
12.1.2.2. By Business
Size
12.1.2.3. By End-user
12.1.2.4.
By
Country
12.1.2.4.1. Brazil
12.1.2.4.2. Argentina
12.1.2.4.3. Mexico
12.1.2.4.4. Rest
of LATAM
13. Country Wise Market:
Introduction
14.
Competition
Landscape
14.1.
Global
Incentive Tourism Market Product Mapping
14.2.
Global
Incentive Tourism Market Concentration Analysis, by Leading Players /
Innovators / Emerging Players / New Entrants
14.3.
Global
Incentive Tourism Market Tier Structure Analysis
14.4.
Global
Incentive Tourism Market Concentration & Company Market Shares (%)
Analysis, 2024
15.
Company
Profiles
15.1.
Marriott International, Inc.
15.1.1.
Company
Overview & Key Stats
15.1.2.
Financial
Performance & KPIs
15.1.3.
Product
Portfolio
15.1.4.
SWOT
Analysis
15.1.5.
Business
Strategy & Recent Developments
* Similar details would be provided for all the players
mentioned below
15.2. Hilton
Worldwide Holdings Inc.
15.3. American
Express Global Business Travel (Amex GBT)
15.4. CWT (Carlson
Wagonlit Travel)
15.5. BCD Travel
15.6. ITA Group
15.7. BI Worldwide
15.8. Maritz
Holdings Inc.
15.9. Creative
Group, Inc.
15.10. One10, LLC
15.11. Omega World
Travel
15.12. FCM Travel
Solutions
15.13. Other
Prominent Players
16. Research
Methodology
16.1.
External
Transportations / Databases
16.2.
Internal
Proprietary Database
16.3.
Primary
Research
16.4.
Secondary
Research
16.5.
Assumptions
16.6.
Limitations
16.7.
Report
FAQs
17. Research
Findings & Conclusion
Our Research Methodology
"Insight without rigor is just noise."
We follow a comprehensive, multi-phase research framework designed to deliver accurate, strategic, and decision-ready intelligence. Our process integrates primary and secondary research , both quantitative and qualitative , along with dual modeling techniques ( top-down and bottom-up) and a final layer of validation through our proprietary in-house repository.
PRIMARY RESEARCH
Primary research captures real-time, firsthand insights from the market to understand behaviors, motivations, and emerging trends.
1. Quantitative Primary Research
Objective: Generate statistically significant data directly from market participants.
Approaches:- Structured surveys with customers, distributors, and field agents
- Mobile-based data collection for point-of-sale audits and usage behavior
- Phone-based interviews (CATI) for market sizing and product feedback
- Online polling around industry events and digital campaigns
- Purchase frequency by customer type
- Channel performance across geographies
- Feature demand by application or demographic
2. Qualitative Primary Research
Objective: Explore decision-making drivers, pain points, and market readiness.
Approaches:- In-depth interviews (IDIs) with executives, product managers, and key decision-makers
- Focus groups among end users and early adopters
- Site visits and observational research for consumer products
- Informal field-level discussions for regional and cultural nuances
SECONDARY RESEARCH
This phase helps establish a macro-to-micro understanding of market trends, size, regulation, and competitive dynamics, sourced from credible and public domain information.
1. Quantitative Secondary Research
Objective: Model market value and segment-level forecasts based on published data.
Sources include:- Financial reports and investor summaries
- Government trade data, customs records, and regulatory statistics
- Industry association publications and economic databases
- Channel performance and pricing data from marketplace listings
- Revenue splits, pricing trends, and CAGR estimates
- Supply-side capacity and volume tracking
- Investment analysis and funding benchmarks
2. Qualitative Secondary Research
Objective: Capture strategic direction, innovation signals, and behavioral trends.
Sources include:- Company announcements, roadmaps, and product pipelines
- Publicly available whitepapers, conference abstracts, and academic research
- Regulatory body publications and policy briefs
- Social and media sentiment scanning for early-stage shifts
- Strategic shifts in market positioning
- Unmet needs and white spaces
- Regulatory triggers and compliance impact

DUAL MODELING: TOP-DOWN + BOTTOM-UP
To ensure robust market estimation, we apply two complementary sizing approaches:
Top-Down Modeling:- Start with broader industry value (e.g., global or regional TAM)
- Apply filters by segment, geography, end-user, or use case
- Adjust with primary insights and validation benchmarks
- Ideal for investor-grade market scans and opportunity mapping
- Aggregate from the ground up using sales volumes, pricing, and unit economics
- Use internal modeling templates aligned with stakeholder data
- Incorporate distributor-level or region-specific inputs
- Most accurate for emerging segments and granular sub-markets
DATA VALIDATION: IN-HOUSE REPOSITORY
We close the loop with proprietary data intelligence built from ongoing projects, industry monitoring, and historical benchmarking. This repository includes:
- Multi-sector market and pricing models
- Key trendlines from past interviews and forecasts
- Benchmarked adoption rates, churn patterns, and ROI indicators
- Industry-specific deviation flags and cross-check logic
- Catches inconsistencies early
- Aligns projections across studies
- Enables consistent, high-trust deliverables