
Inorganic Salts Market Size and Forecast (2025–2033), Global and Regional Growth, Trend, Share and Industry Analysis Report Coverage: By Application (Agriculture, Pharmaceuticals, Cement, Rubber Processing, Food, Others), By Type (Sodium Salts, Magnesium Salts, Calcium Salts, Potassium Salts, Ammonium Salts), and Geography
2026-02-02
Chemicals & Materials
Jaya Bundele (Research Analyst)
Description
Inorganic Salts Market Overview
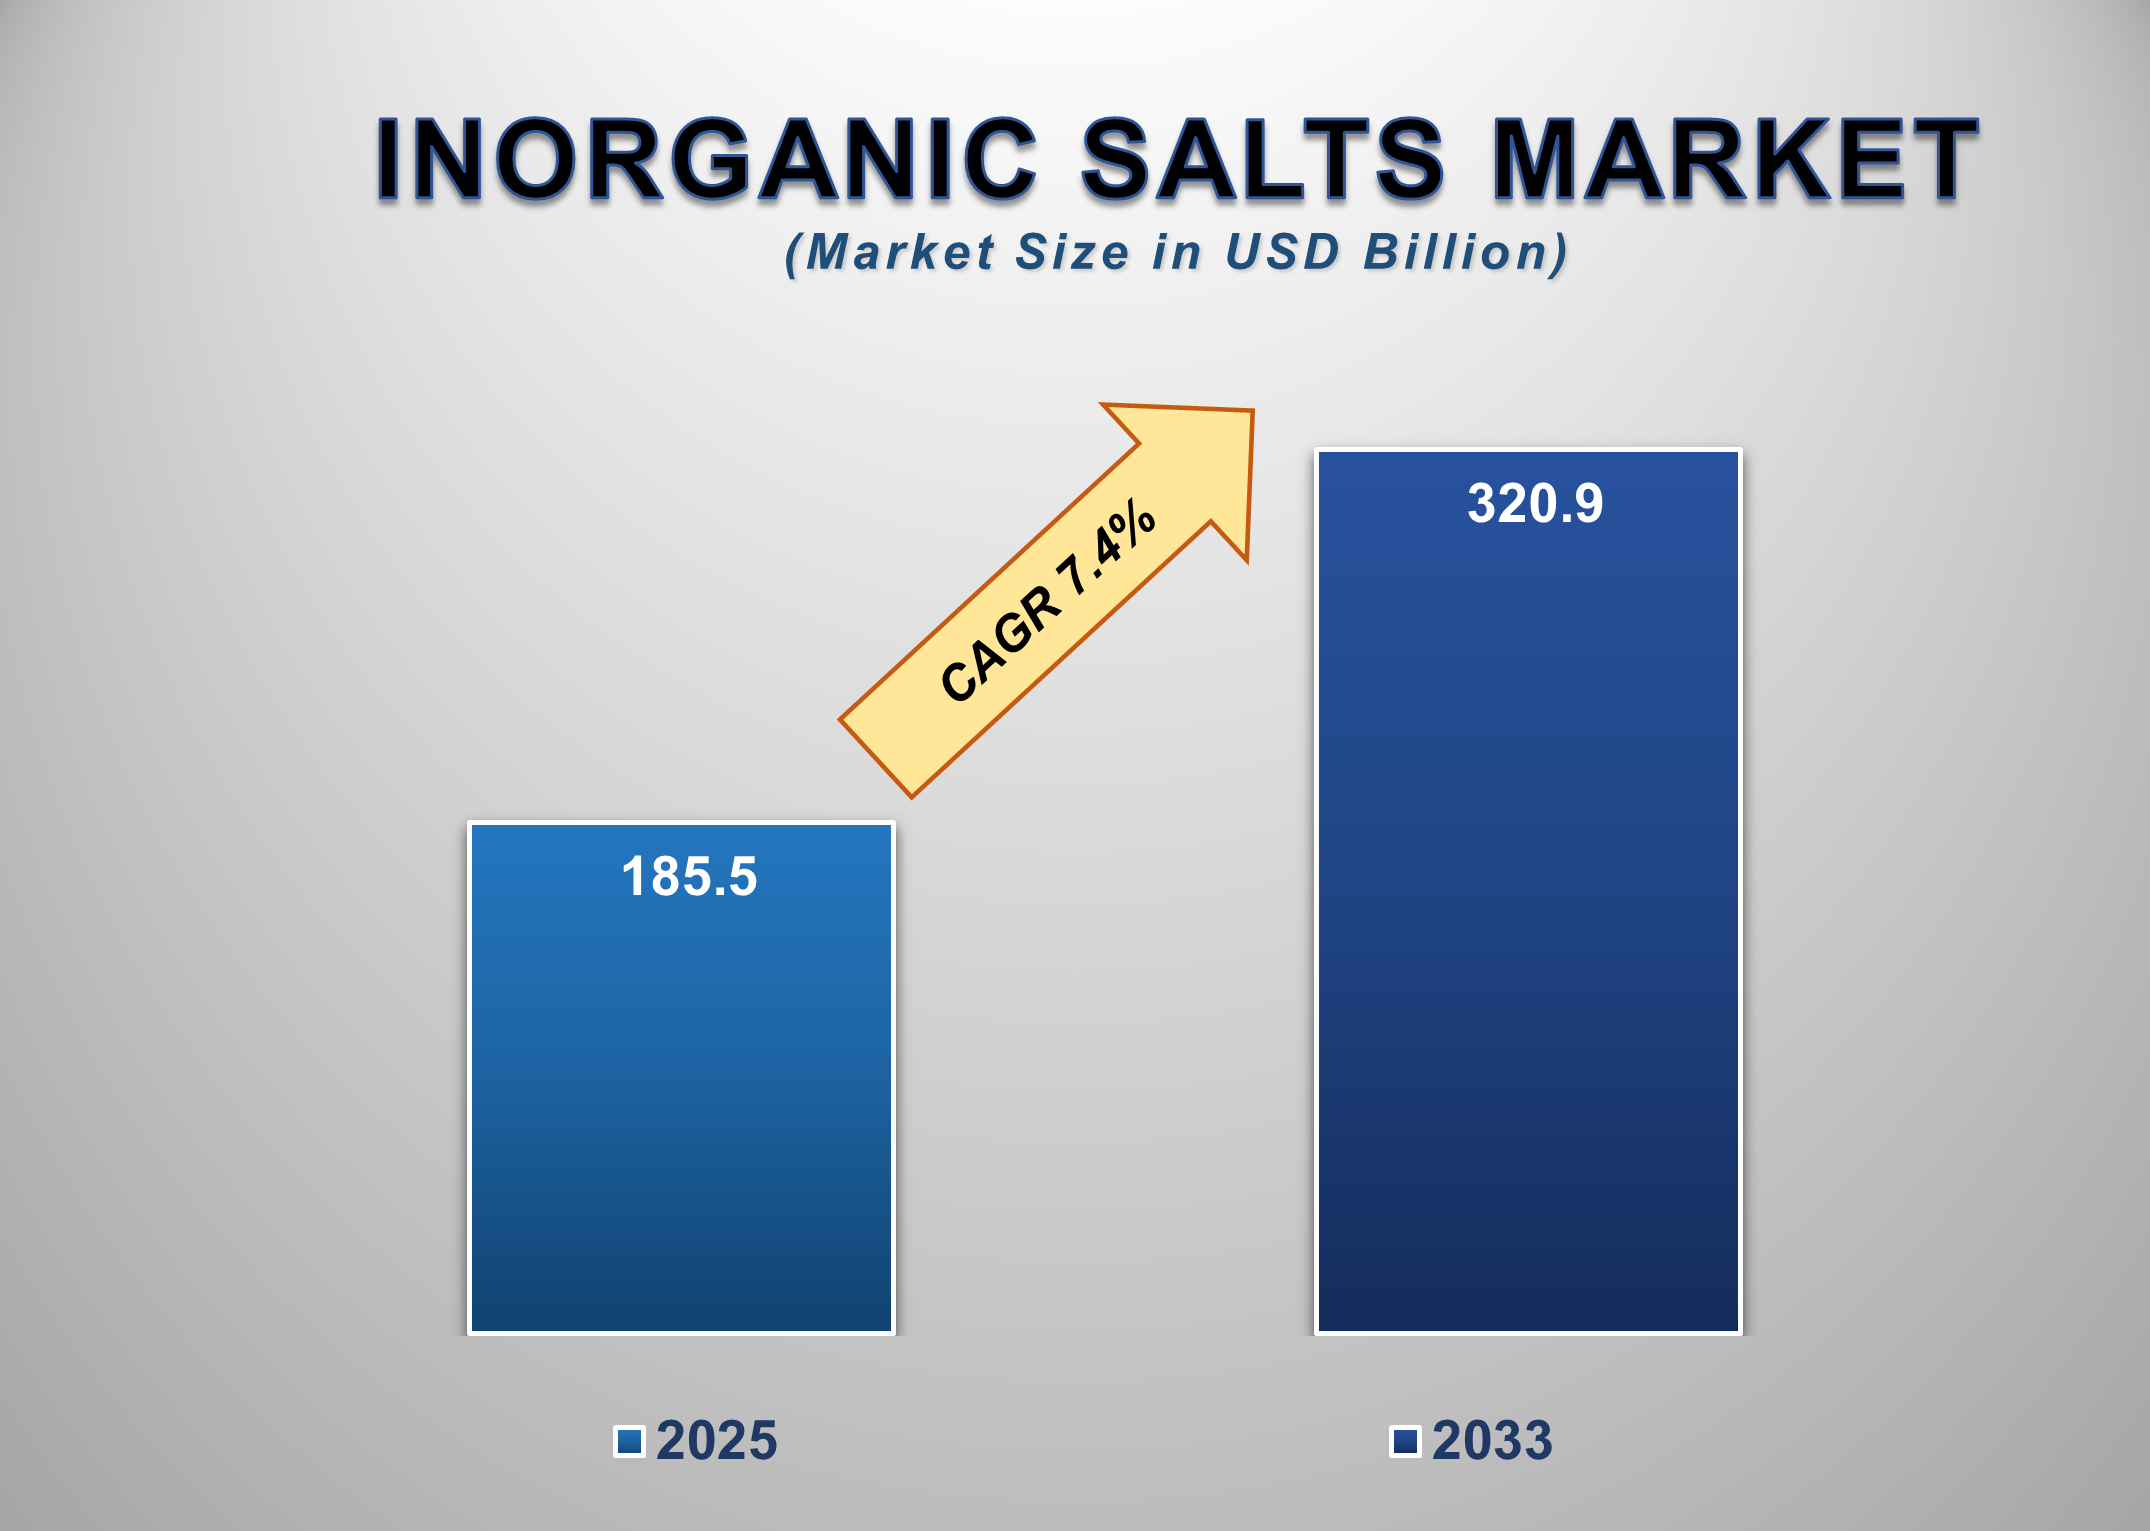
The global inorganic salts market represents a foundational segment of the chemical industry, supporting a wide spectrum of downstream applications ranging from agriculture and food processing to pharmaceuticals, construction, and rubber manufacturing. In 2025, the market is valued at USD 185.5 billion and is projected to reach USD 320.9 billion by 2033, expanding at a CAGR of 7.4% over the forecast period. This growth reflects the essential and non-substitutable role of inorganic salts across both industrial and consumer-facing value chains.
Inorganic salts such as sodium,
calcium, potassium, magnesium, and ammonium compounds are integral to nutrient
delivery, pH regulation, preservation, catalysis, and material strengthening.
Their demand remains resilient even during economic slowdowns due to their
widespread use in staple industries such as food production, fertilizers,
cement, and pharmaceuticals. Sodium salts, in particular, form the backbone of
the market owing to their extensive application across food, agriculture, and
industrial processing.
Inorganic Salts Market
Drivers and Opportunities
Expanding Agricultural and Food Production Is Driving Global
Demand for Inorganic Salts
Agriculture remains one of the most significant demand centers for
inorganic salts, particularly sodium, potassium, calcium, and ammonium
compounds used in fertilizers, soil conditioning, and crop nutrition. Rising
global population levels and increasing food security concerns are pushing
governments and agribusinesses to improve crop yields and farming efficiency,
directly boosting the consumption of inorganic salts. These compounds play a
critical role in nutrient replenishment, pH stabilization, and pest management,
making them indispensable in modern agriculture. Parallel to this, the food
processing industry relies heavily on inorganic salts for preservation, flavor
enhancement, texture control, and shelf-life extension. Sodium salts, in
particular, are extensively used across packaged foods, beverages, dairy
products, and meat processing. As urbanization accelerates and consumption of
processed and convenience foods rises, especially in the Asia Pacific, demand
for food-grade inorganic salts continues to grow steadily. This dual demand
from the agriculture and food sectors provides a strong and recurring growth
base for the market.
Growth of Construction, Cement, and Rubber Processing
Industries Is Supporting Market Expansion
The building and construction industry is another key driver of
inorganic salt demand, especially calcium and sodium-based compounds used in
cement manufacturing, concrete acceleration, and corrosion inhibition. Rapid
urban development, infrastructure investments, and housing projects across
emerging economies are significantly increasing cement production, thereby
driving the consumption of inorganic salts as essential input materials. In
addition, the rubber processing industry relies on inorganic salts for
vulcanization, stabilization, and performance enhancement of rubber products.
Applications span automotive tires, industrial belts, hoses, and seals. With
automotive production and industrial manufacturing expanding in the Asia
Pacific and North America, the use of inorganic salts in rubber processing is
gaining momentum. The non-discretionary nature of these applications ensures
consistent volume demand, reinforcing the market’s growth trajectory over the
forecast period.
Pharmaceutical and Specialty Applications Present High-Value
Growth Opportunities
While traditional applications dominate volume consumption, pharmaceuticals and specialty chemical applications represent a significant value-based growth opportunity for the inorganic salts market. Magnesium, calcium, and sodium salts are widely used in drug formulations, excipients, electrolyte solutions, and diagnostic agents. The global expansion of healthcare access, aging populations, and rising prevalence of chronic diseases are fueling demand for pharmaceutical-grade inorganic salts. Moreover, increasing regulatory emphasis on product purity and traceability is encouraging manufacturers to invest in high-quality and specialty-grade salt production. These premium segments offer higher margins compared to bulk industrial salts and are particularly prominent in North America and developed Asia Pacific markets. As pharmaceutical manufacturing scales up globally, inorganic salt suppliers with strong quality control and regulatory compliance capabilities are well-positioned to capture long-term growth opportunities
Inorganic Salts Market
Scope
|
Report Attributes |
Description |
|
Market Size in 2025 |
USD 185.5 Billion |
|
Market Forecast in 2033 |
USD 320.9 Billion |
|
CAGR % 2025-2033 |
7.4% |
|
Base Year |
2024 |
|
Historic Data |
2020-2024 |
|
Forecast Period |
2025-2033 |
|
Report USP |
Production, Consumption,
Company Share, Company Heatmap, Company Production Capacity, Growth Factors
and more |
|
Segments Covered |
●
By Application,
By Type |
|
Regional Scope |
●
North America, ●
Europe, ●
APAC, ●
Latin America ●
Middle East and
Africa |
|
Country Scope |
1)
U.S. 2)
Canada 3)
Germany 4)
UK 5)
France 6)
Spain 7)
Italy 8)
Switzerland 9)
China 10)
Japan 11)
India 12)
Australia 13)
South Korea 14)
Brazil 15)
Mexico 16)
Argentina 17)
South Africa 18)
Saudi Arabia 19)
UAE |
Inorganic Salts Market
Report Segmentation Analysis
The Global Inorganic Salts Market
Industry Analysis is segmented by Application and Type, and by Region.
Sodium Salts Segment Dominates Due to Broad Industrial and
Food Applications
The
sodium salts segment accounts for 30.8% of the global inorganic salts market,
making it the largest type segment. Sodium-based compounds are extensively used
across food processing, agriculture, pharmaceuticals, and industrial
manufacturing due to their chemical stability, cost-effectiveness, and
versatility. In the food industry, sodium salts are critical for preservation,
flavor enhancement, and texture modification, ensuring consistent demand from
packaged and processed food manufacturers.
Beyond food, sodium salts are widely used in agriculture for soil conditioning and nutrient delivery, as well as in chemical processing and water treatment. Their large-scale production capabilities and established supply chains further strengthen their market dominance. As food consumption and industrial output continue to rise globally, particularly in the Asia Pacific, sodium salts are expected to maintain their leading position throughout the forecast period.
Agriculture
Application Segment Benefits from Rising Global Food Demand
Agriculture
represents one of the most important application segments within the inorganic
salts market. Inorganic salts are essential components of fertilizers,
micronutrient blends, and soil enhancers that improve crop yield and quality.
Growing global food demand, coupled with shrinking arable land, has intensified
the need for efficient agricultural inputs, directly boosting inorganic salt
consumption. Emerging economies in the Asia
Pacific heavily rely on inorganic salts to support intensive farming practices
and enhance food self-sufficiency. Additionally,
government-backed agricultural productivity programs and fertilizer subsidies
further support market growth. The consistent requirement for crop nutrients
across multiple growing cycles ensures stable, recurring demand for inorganic
salts in this segment.
The following segments are
part of an in-depth analysis of the global Inorganic Salts market:
|
Market Segments |
|
|
By Application |
●
Sodium salts ●
Magnesium salts ●
Calcium salts ●
Potassium salts ●
Ammonium Salts |
|
By Type |
●
Agriculture ●
Pharmaceuticals ●
Cement ●
Rubber processing ●
Food ●
Others |
Inorganic Salts Market
Share Analysis by Region
Asia Pacific is
anticipated to hold the biggest portion of the Inorganic Salts Market globally
throughout the forecast period.
The Asia Pacific dominates the
global inorganic salts market, accounting for a 41.8% share, driven by its
massive agricultural base, rapidly expanding food processing industry, and
growing construction activity. Countries across the region rely heavily on
inorganic salts to support fertilizer production, cement manufacturing, and
large-scale industrial processing. The presence of cost-efficient manufacturing
facilities and abundant raw material availability further strengthens the
region’s leadership position.
North America is expected to
witness the fastest CAGR over the forecast period, supported by strong demand
from the pharmaceutical, food, and specialty chemical industries. The region’s
focus on high-purity, regulated-grade inorganic salts for healthcare and food
safety applications is driving value-based growth. Additionally, ongoing
investments in infrastructure and industrial modernization are contributing to
rising demand for calcium and sodium salts.
Inorganic Salts Market
Competition Landscape Analysis
The inorganic salts market is
moderately consolidated, with global chemical majors and regional producers
competing on scale, product quality, and application-specific expertise.
Leading companies focus on expanding production capacities, enhancing product
purity, and strengthening supply chains to serve diverse end-use industries.
Strategic investments in agriculture, food-grade, and pharmaceutical-grade
salts are key competitive priorities, particularly in high-growth regions such
as the Asia Pacific and North America.
Global Inorganic Salts
Market Recent Developments News:
- In September 2021 – Arkema announced a 15% price
increase for its hydrogen peroxide and sodium chlorate products, with the
new pricing becoming effective on October 1, 2021.
- In April 2021 – The K+S Group completed the
divestment of its Americas salts business (part of the Operating Unit
Americas) to a consortium comprising Stone Canyon Industries Holdings LLC
and Mark Demetree and Partners for a total price of USD 2.93 billion.
- In April 2020 – GFS Chemicals Inc. launched a new
corporate profile page and a redesigned e-commerce website to enhance its
digital presence and customer interface.
The Global Inorganic Salts Market
Is Dominated by a Few Large Companies, such as
●
BASF SE
●
Evonik Industries
●
AkzoNobel
●
Tata Chemicals
●
Solvay
●
Dow Chemical Company
●
Honeywell
●
Lanxess
●
Eastman Chemical
Company
●
Clariant
●
Celanese Corporation
●
Nouryon
●
K+S
●
ICL Group
●
Innophos Holdings
●
Tosoh Corporation
●
Sumitomo Chemical
●
Arkema
●
Gujarat Heavy
Chemicals
●
Chemours
● Others
Frequently Asked Questions
Jaya Bundele (Research Analyst)
Jaya Bundele is a skilled Research Analyst with 4+ years of experience in market intelligence, consumer insights, competitive analysis, and industry forecasting across the consumer goods, agriculture, and food & beverage sectors. She specializes in market sizing, trend analysis, growth opportunity mapping, and strategic secondary research for global and regional markets.
Her expertise lies in transforming complex industry data into actionable business strategies that help organizations identify emerging trends, understand customer behavior, and gain a competitive edge. With a strong focus on data-driven insights, business intelligence, and future market trends, Jaya delivers high-quality research solutions aligned with evolving industry demands and market dynamics.
1. Global Inorganic Salts
Market Introduction and Market Overview
1.1.
Objectives
of the Study
1.2.
Global
Inorganic Salts Market Scope and Market Estimation
1.2.1.Global Inorganic Salts Overall
Market Size (US$ Bn), Market CAGR (%), Market forecast (2025 - 2033)
1.2.2.Global Inorganic Salts
Market Revenue Share (%) and Growth Rate (Y-o-Y) from 2020 - 2033
1.3.
Market
Segmentation
1.3.1.Application of Global Inorganic
Salts Market
1.3.2.Type of Global Inorganic
Salts Market
1.3.3.Region of Global Inorganic
Salts Market
2. Executive
Summary
2.1.
Demand
Side Trends
2.2.
Key
Market Trends
2.3.
Market
Demand (US$ Bn) Analysis 2020 – 2024 and Forecast, 2025 – 2033
2.4.
Demand
and Opportunity Assessment
2.5.
Demand
Supply Scenario
2.6.
Market
Dynamics
2.6.1.Drivers
2.6.2.Limitations
2.6.3.Opportunities
2.6.4.Impact Analysis of Drivers
and Restraints
2.7.
Emerging
Trends for Inorganic Salts Market
2.8.
Porter’s
Five Forces Analysis
2.9.
PEST
Analysis
2.10.
Key
Regulation
3. Global
Inorganic Salts Market Estimates
& Historical Trend Analysis (2020 - 2024)
4. Global
Inorganic Salts Market Estimates
& Forecast Trend Analysis, by Application
4.1.
Global
Inorganic Salts Market Revenue (US$ Bn) Estimates and Forecasts, by Application,
2020 - 2033
4.1.1.Sodium salts
4.1.2.Magnesium salts
4.1.3.Calcium salts
4.1.4.Potassium salts
4.1.5.Ammonium Salts
5. Global
Inorganic Salts Market Estimates
& Forecast Trend Analysis, by Type
5.1.
Global
Inorganic Salts Market Revenue (US$ Bn) Estimates and Forecasts, by Type, 2020
- 2033
5.1.1.Agriculture
5.1.2.Pharmaceuticals
5.1.3.Cement
5.1.4.Rubber processing
5.1.5.Food
5.1.6.Others
6. Global
Inorganic Salts Market Estimates
& Forecast Trend Analysis, by Region
6.1.
Global
Inorganic Salts Market Revenue (US$ Bn) Estimates and Forecasts, by Region, 2020
- 2033
6.1.1.North America
6.1.2.Europe
6.1.3.Asia Pacific
6.1.4.Middle East & Africa
6.1.5.Latin America
7. North America Inorganic
Salts Market: Estimates & Forecast
Trend Analysis
7.1.
North
America Inorganic Salts Market Assessments & Key Findings
7.1.1.North America Inorganic
Salts Market Introduction
7.1.2.North America Inorganic
Salts Market Size Estimates and Forecast (US$ Billion) (2020 - 2033)
7.1.2.1. By Application
7.1.2.2. By Type
7.1.2.3.
By
Country
7.1.2.3.1. The U.S.
7.1.2.3.2. Canada
8. Europe Inorganic
Salts Market: Estimates & Forecast
Trend Analysis
8.1.
Europe
Inorganic Salts Market Assessments & Key Findings
8.1.1.Europe Inorganic Salts
Market Introduction
8.1.2.Europe Inorganic Salts
Market Size Estimates and Forecast (US$ Billion) (2020 - 2033)
8.1.2.1. By Application
8.1.2.2. By Type
8.1.2.3.
By
Country
8.1.2.3.1.
Germany
8.1.2.3.2.
Italy
8.1.2.3.3.
U.K.
8.1.2.3.4.
France
8.1.2.3.5.
Spain
8.1.2.3.6.
Switzerland
8.1.2.3.7. Rest
of Europe
9. Asia Pacific Inorganic
Salts Market: Estimates & Forecast
Trend Analysis
9.1.
Asia
Pacific Market Assessments & Key Findings
9.1.1.Asia Pacific Inorganic
Salts Market Introduction
9.1.2.Asia Pacific Inorganic
Salts Market Size Estimates and Forecast (US$ Billion) (2020 - 2033)
9.1.2.1. By Application
9.1.2.2. By Type
9.1.2.3.
By
Country
9.1.2.3.1.
China
9.1.2.3.2.
Japan
9.1.2.3.3.
India
9.1.2.3.4.
Australia
9.1.2.3.5.
South
Korea
9.1.2.3.6. Rest of Asia Pacific
10. Middle East & Africa Inorganic
Salts Market: Estimates & Forecast
Trend Analysis
10.1.
Middle
East & Africa Market Assessments & Key Findings
10.1.1.
Middle East & Africa Inorganic Salts Market Introduction
10.1.2.
Middle East & Africa Inorganic Salts Market Size Estimates
and Forecast (US$ Billion) (2020 - 2033)
10.1.2.1. By Application
10.1.2.2. By Type
10.1.2.3.
By
Country
10.1.2.3.1. UAE
10.1.2.3.2. Saudi
Arabia
10.1.2.3.3. South
Africa
10.1.2.3.4. Rest
of MEA
11. Latin America
Inorganic Salts Market: Estimates &
Forecast Trend Analysis
11.1.
Latin
America Market Assessments & Key Findings
11.1.1.
Latin
America Inorganic Salts Market Introduction
11.1.2.
Latin
America Inorganic Salts Market Size Estimates and Forecast (US$ Billion) (2020
- 2033)
11.1.2.1. By Application
11.1.2.2. By Type
11.1.2.3.
By
Country
11.1.2.3.1. Brazil
11.1.2.3.2. Argentina
11.1.2.3.3. Mexico
11.1.2.3.4. Rest
of LATAM
12. Country Wise Market:
Introduction
13.
Competition
Landscape
13.1.
Global
Inorganic Salts Market Product Mapping
13.2.
Global
Inorganic Salts Market Concentration Analysis, by Leading Players / Innovators
/ Emerging Players / New Entrants
13.3.
Global
Inorganic Salts Market Tier Structure Analysis
13.4.
Global
Inorganic Salts Market Concentration & Company Market Shares (%) Analysis,
2024
14.
Company
Profiles
14.1.
BASF SE
14.1.1.
Company
Overview & Key Stats
14.1.2.
Financial
Performance & KPIs
14.1.3.
Product
Portfolio
14.1.4.
SWOT
Analysis
14.1.5.
Business
Strategy & Recent Developments
* Similar details would be provided for all the players
mentioned below
14.2. Evonik
Industries
14.3. AkzoNobel
14.4. Tata
Chemicals
14.5. Solvay
14.6. Dow
Chemical Company
14.7. Honeywell
14.8. Lanxess
14.9. Eastman
Chemical Company
14.10. Clariant
14.11. Celanese
Corporation
14.12. Nouryon
14.13. K+S
14.14. ICL
Group
14.15. Innophos
Holdings
14.16. Tosoh
Corporation
14.17. Sumitomo
Chemical
14.18. Arkema
14.19. Gujarat
Heavy Chemicals
14.20. Chemours
14.21. Others
15. Research
Methodology
15.1.
External
Transportations / Databases
15.2.
Internal
Proprietary Database
15.3.
Primary
Research
15.4.
Secondary
Research
15.5.
Assumptions
15.6.
Limitations
15.7.
Report
FAQs
16. Research
Findings & Conclusion
Our Research Methodology
"Insight without rigor is just noise."
We follow a comprehensive, multi-phase research framework designed to deliver accurate, strategic, and decision-ready intelligence. Our process integrates primary and secondary research , both quantitative and qualitative , along with dual modeling techniques ( top-down and bottom-up) and a final layer of validation through our proprietary in-house repository.
PRIMARY RESEARCH
Primary research captures real-time, firsthand insights from the market to understand behaviors, motivations, and emerging trends.
1. Quantitative Primary Research
Objective: Generate statistically significant data directly from market participants.
Approaches:- Structured surveys with customers, distributors, and field agents
- Mobile-based data collection for point-of-sale audits and usage behavior
- Phone-based interviews (CATI) for market sizing and product feedback
- Online polling around industry events and digital campaigns
- Purchase frequency by customer type
- Channel performance across geographies
- Feature demand by application or demographic
2. Qualitative Primary Research
Objective: Explore decision-making drivers, pain points, and market readiness.
Approaches:- In-depth interviews (IDIs) with executives, product managers, and key decision-makers
- Focus groups among end users and early adopters
- Site visits and observational research for consumer products
- Informal field-level discussions for regional and cultural nuances
SECONDARY RESEARCH
This phase helps establish a macro-to-micro understanding of market trends, size, regulation, and competitive dynamics, sourced from credible and public domain information.
1. Quantitative Secondary Research
Objective: Model market value and segment-level forecasts based on published data.
Sources include:- Financial reports and investor summaries
- Government trade data, customs records, and regulatory statistics
- Industry association publications and economic databases
- Channel performance and pricing data from marketplace listings
- Revenue splits, pricing trends, and CAGR estimates
- Supply-side capacity and volume tracking
- Investment analysis and funding benchmarks
2. Qualitative Secondary Research
Objective: Capture strategic direction, innovation signals, and behavioral trends.
Sources include:- Company announcements, roadmaps, and product pipelines
- Publicly available whitepapers, conference abstracts, and academic research
- Regulatory body publications and policy briefs
- Social and media sentiment scanning for early-stage shifts
- Strategic shifts in market positioning
- Unmet needs and white spaces
- Regulatory triggers and compliance impact

DUAL MODELING: TOP-DOWN + BOTTOM-UP
To ensure robust market estimation, we apply two complementary sizing approaches:
Top-Down Modeling:- Start with broader industry value (e.g., global or regional TAM)
- Apply filters by segment, geography, end-user, or use case
- Adjust with primary insights and validation benchmarks
- Ideal for investor-grade market scans and opportunity mapping
- Aggregate from the ground up using sales volumes, pricing, and unit economics
- Use internal modeling templates aligned with stakeholder data
- Incorporate distributor-level or region-specific inputs
- Most accurate for emerging segments and granular sub-markets
DATA VALIDATION: IN-HOUSE REPOSITORY
We close the loop with proprietary data intelligence built from ongoing projects, industry monitoring, and historical benchmarking. This repository includes:
- Multi-sector market and pricing models
- Key trendlines from past interviews and forecasts
- Benchmarked adoption rates, churn patterns, and ROI indicators
- Industry-specific deviation flags and cross-check logic
- Catches inconsistencies early
- Aligns projections across studies
- Enables consistent, high-trust deliverables