
Interactive Video Wall Market Size and Forecast (2026–2034), Global and Regional Growth, Trend, Share, and Industry Analysis Report Coverage; Technology (LCD, LED, OLED, Rear Projection), Component (Hardware, Software, Services), Application (Retail, Corporate, Healthcare, Education, Entertainment & Hospitality, Control Rooms, Others), and Geography
2026-03-11
Semiconductor and Electronics
Ekta Chaurasia (Team Lead)
Description
Interactive Video Wall Market Overview
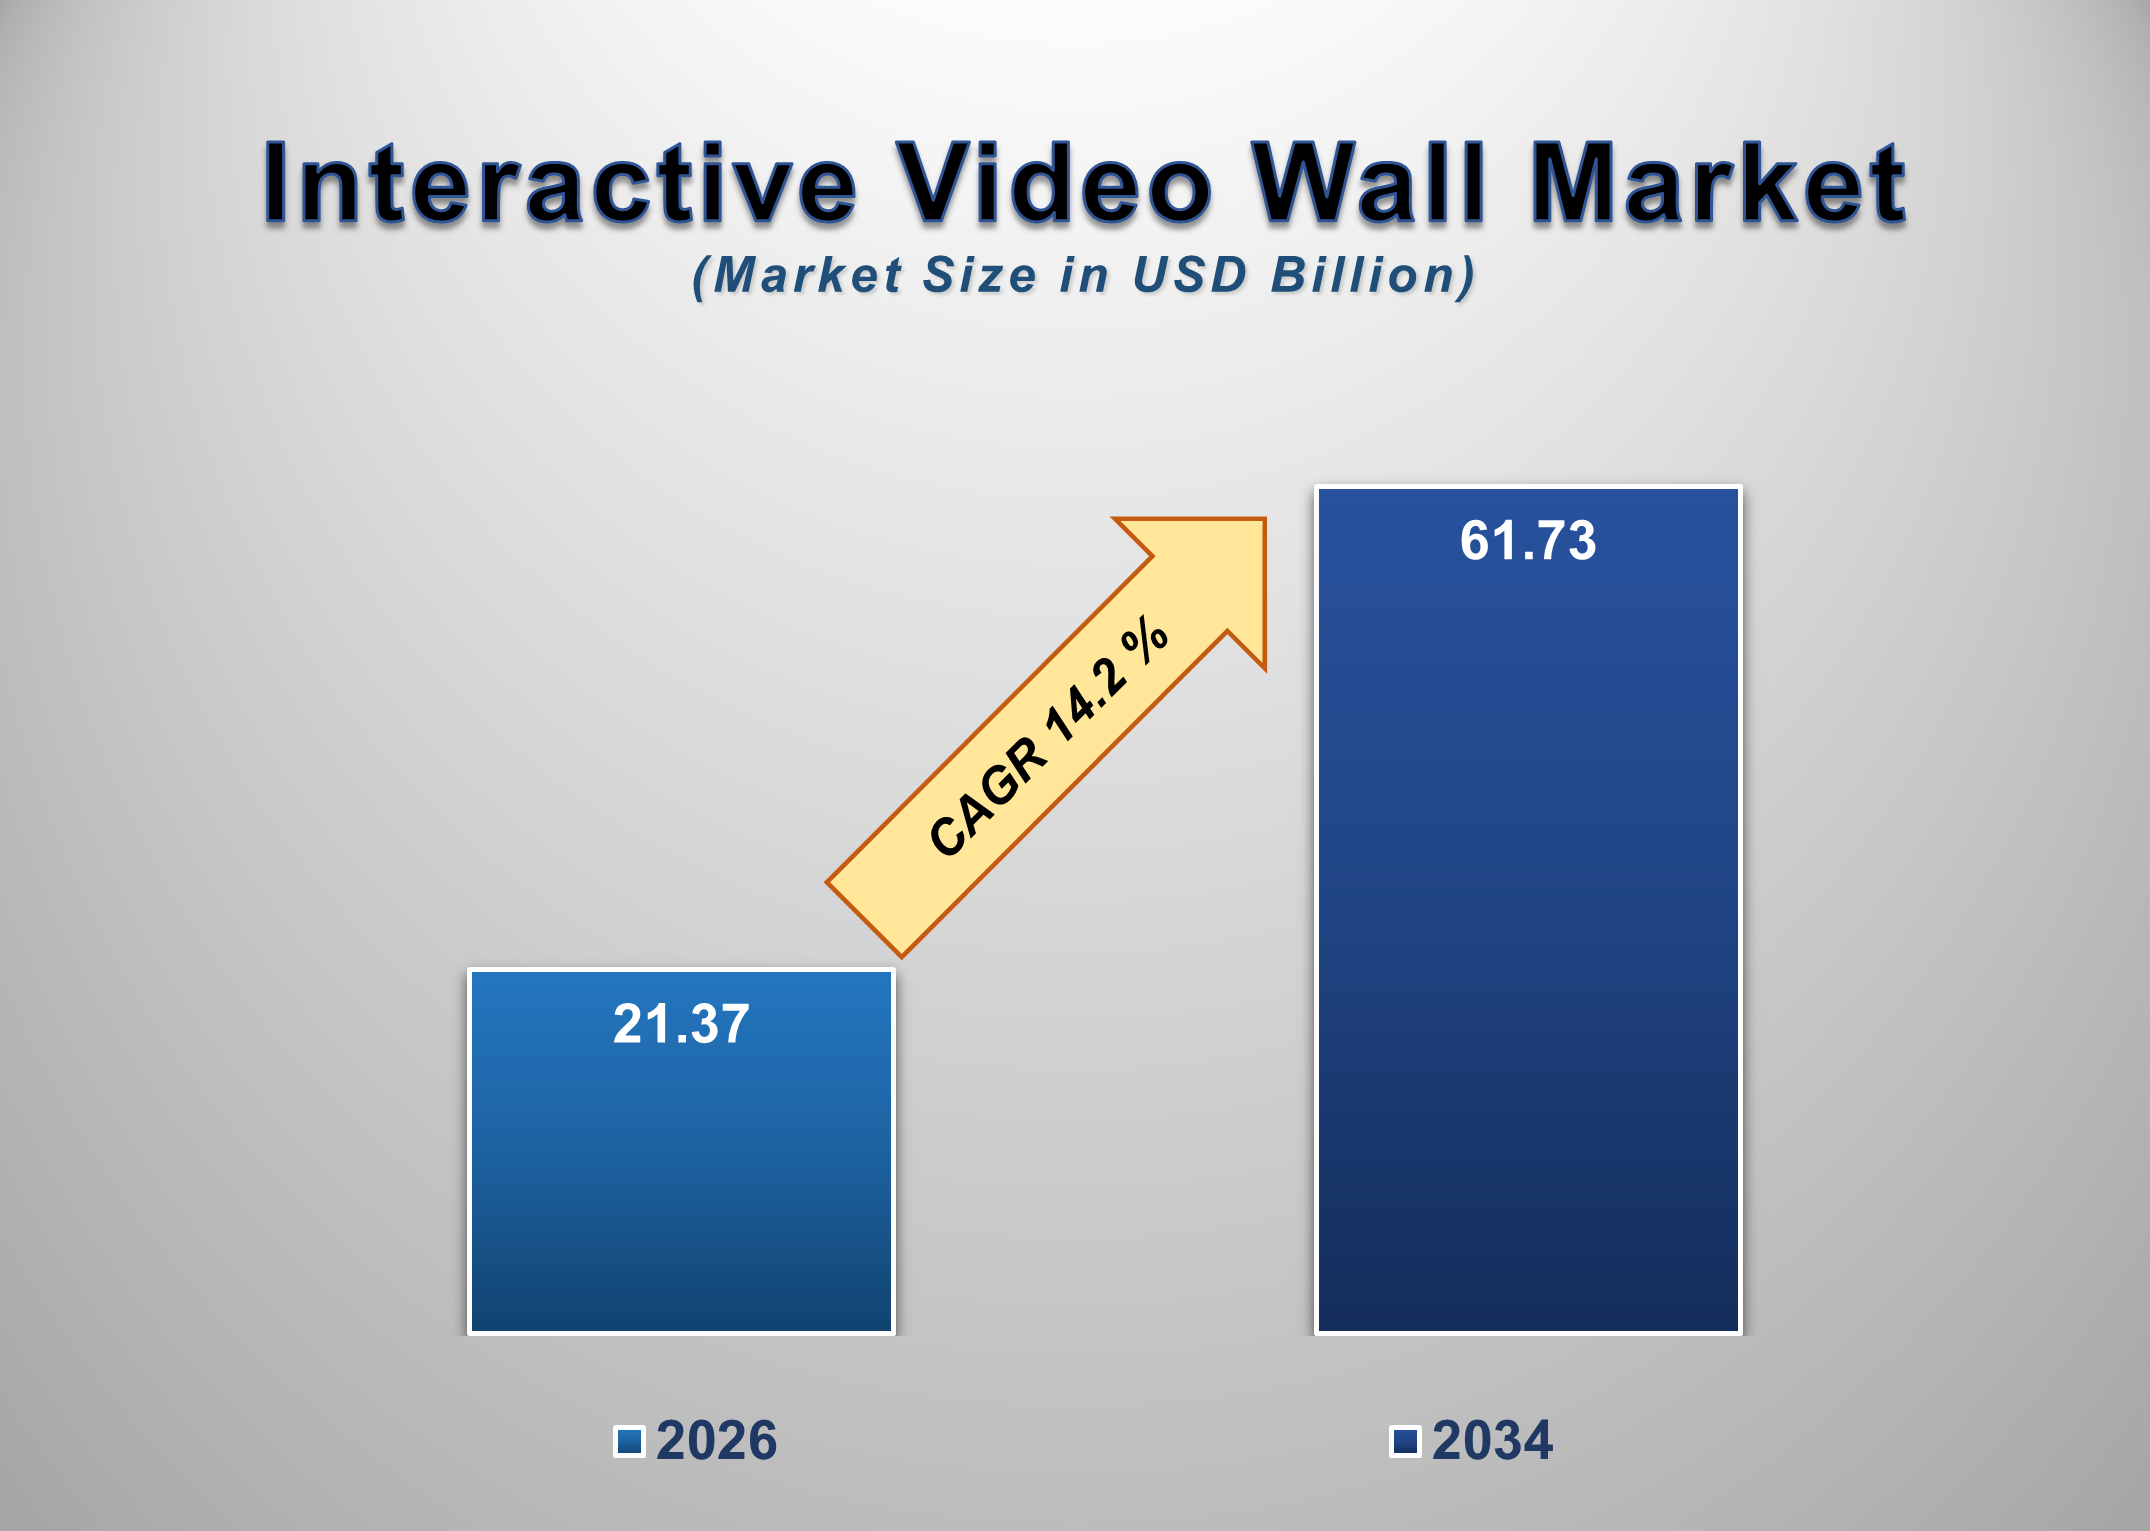
The global interactive video wall market is witnessing strong expansion, fueled by increasing demand for immersive visual communication, digital engagement solutions, and real-time data visualization across commercial and institutional environments. Valued at USD 21.37 billion in 2026, the market is projected to reach USD 61.73 billion by 2034, growing at a CAGR of 14.2% during the forecast period.
Interactive video walls consist of multiple display panels seamlessly integrated to function as a single large visual interface with touch, gesture, or sensor-based interactivity. Unlike traditional video walls used solely for display purposes, interactive systems enable user engagement, real-time data manipulation, and dynamic content management. These solutions are increasingly deployed in retail stores, corporate boardrooms, transportation hubs, educational institutions, healthcare facilities, and control rooms.
Technological advancements in LED and ultra-narrow bezel LCD panels have significantly enhanced image clarity, brightness, and scalability. Fine-pitch LED displays, in particular, are gaining traction due to superior resolution, seamless modularity, and high durability. Additionally, improvements in interactive software platforms, multi-touch capabilities, and AI-driven content personalization have strengthened the functional appeal of these systems.
The growing emphasis on digital transformation across enterprises and public institutions is accelerating investments in advanced visualization infrastructure. Control rooms and command centers utilize interactive video walls for real-time monitoring of operations, cybersecurity threats, and public safety management. In retail environments, brands deploy interactive walls to enhance customer engagement, promote immersive advertising, and deliver personalized experiences.
However, high installation costs, integration complexity, and space requirements remain key challenges. Despite these constraints, continuous technological innovation, declining LED costs, and rising demand for experiential marketing are expected to sustain long-term market growth.
As organizations increasingly prioritize visual collaboration and data-driven decision-making, interactive video walls are emerging as strategic digital communication assets.
Interactive Video Wall Market Drivers and Opportunities
Increasing Demand for Immersive Customer Engagement in Retail and Hospitality
Retailers and hospitality providers are shifting toward experiential marketing strategies to attract and retain customers. Interactive video walls enable dynamic product showcases, personalized promotions, and real-time customer interaction. These systems integrate touch sensors, motion detection, and AI-based analytics to deliver customized content based on user engagement patterns.
Luxury retail stores and flagship outlets are increasingly deploying large-format interactive displays to differentiate brand presence and create immersive environments. In hospitality settings, interactive walls are used for digital concierge services, wayfinding solutions, and promotional displays. The measurable impact on customer dwell time and brand recall is encouraging further adoption across commercial sectors.
Growing Adoption in Control Rooms and Corporate Collaboration Spaces
The rising need for centralized monitoring and collaborative decision-making is driving the deployment of interactive video walls in control rooms, network operations centers (NOCs), and corporate command hubs. Industries such as energy, transportation, defense, and telecommunications require high-resolution, real-time visualization platforms capable of displaying multiple data streams simultaneously.
Interactive video walls allow operators to manipulate dashboards, zoom into critical metrics, and respond rapidly to operational incidents. In corporate environments, these systems enhance hybrid collaboration by supporting interactive presentations, data visualization, and multi-user input. As enterprises modernize their communication infrastructure, interactive video walls are becoming integral to digital workplace strategies.
Integration with AI-Driven Content Management and Smart City Infrastructure
A major growth opportunity lies in the integration of interactive video walls with AI-driven content management systems and smart city infrastructure projects. Advanced analytics platforms enable automated content adaptation based on audience demographics, environmental conditions, or real-time data feeds. For example, transportation hubs can dynamically update travel information, emergency alerts, or targeted advertisements based on passenger flow analytics.
Smart city initiatives increasingly incorporate interactive public information displays for urban planning, traffic management, and citizen engagement. As governments invest in digital infrastructure and IoT-enabled ecosystems, interactive video walls are expected to play a pivotal role in enhancing public communication and urban monitoring systems. The convergence of AI, IoT, and advanced display technologies presents significant long-term expansion potential for market participants.
Interactive Video Wall Market Scope
Interactive Video Wall Market Report Segmentation Analysis
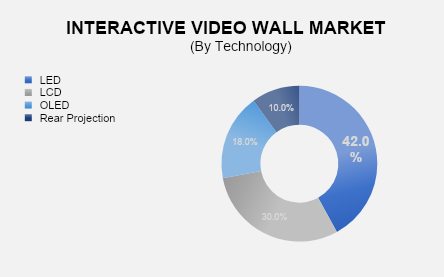
The global interactive video wall market analysis is segmented by Technology, Component, Application, and Region. The LED segment dominated the market in 2025 and is projected to grow at the highest CAGR during the forecast period.
By technology, the market includes LCD, LED, OLED, and rear projection systems. LED video walls account for the largest market share due to superior brightness, seamless scalability, energy efficiency, and longer operational lifespan. Fine-pitch LED displays eliminate visible bezels, offering a unified viewing experience ideal for large-scale installations. Their durability and adaptability make them suitable for both indoor and outdoor environments, contributing to widespread adoption across commercial and industrial sectors.
Application Segment Analysis
The Retail segment holds the highest share of the application segment over the forecast period.
Retailers increasingly deploy interactive video walls to enhance customer engagement and drive foot traffic. These systems support product demonstrations, promotional campaigns, and immersive brand storytelling. Interactive capabilities enable shoppers to browse product catalogs, customize purchases, and access real-time information. The integration of analytics tools allows retailers to measure engagement metrics and optimize marketing strategies. As competition intensifies in brick-and-mortar retail, interactive video walls serve as powerful tools for experiential differentiation.
Interactive Video Wall Market Share Analysis by Region
North America is projected to hold a significant share of the global interactive video wall market over the forecast period.
The region’s dominance is attributed to advanced digital infrastructure, early adoption of immersive display technologies, and high investments in corporate collaboration and retail innovation. The United States leads the regional market due to strong presence of AV solution providers and widespread deployment across corporate headquarters, retail chains, and government facilities. Continued investment in smart buildings and digital signage solutions is expected to sustain regional growth.
Interactive Video Wall Market Recent Developments News
In February 2025, Samsung Electronics introduced a next-generation fine-pitch LED interactive video wall solution designed for enterprise collaboration spaces.
In June 2025, LG Electronics expanded its commercial display portfolio with AI-enabled interactive video wall systems targeting retail and hospitality sectors.
In October 2025, Barco NV launched a modular interactive LED wall platform optimized for control room and mission-critical applications.
Competitive Landscape
The Global Interactive Video Wall Market is dominated by a few large companies, such as
Samsung Electronics Co., Ltd.
LG Electronics Inc.
Sony Group Corporation
Panasonic Holdings Corporation
Barco NV
Christie Digital Systems USA, Inc.
Sharp NEC Display Solutions, Ltd.
Leyard Optoelectronic Co., Ltd.
Daktronics, Inc.
Absen Optoelectronic Co., Ltd.
ViewSonic Corporation
Planar Systems, Inc.
Delta Electronics, Inc.
Philips Professional Display Solutions
AOTO Electronics Co., Ltd.
Frequently Asked Questions
Ekta Chaurasia (Team Lead)
Ekta Chaurasia is a highly experienced Team Lead at M2Square Consultancy with over 7 years of expertise in market research, strategic consulting, competitive benchmarking, and business intelligence solutions. She specializes in ICT, semiconductors & electronics, automotive & transportation, and industrial machinery markets.
She leads end-to-end global research projects focused on market trends, industry analysis, growth forecasting, customer insights, and strategic decision-making. Known for her analytical leadership and industry expertise, Ekta helps businesses uncover growth opportunities, evaluate competitive landscapes, and stay ahead in rapidly evolving markets through accurate and insight-driven research.
Interactive Video Wall Market
Our Research Methodology
"Insight without rigor is just noise."
We follow a comprehensive, multi-phase research framework designed to deliver accurate, strategic, and decision-ready intelligence. Our process integrates primary and secondary research , both quantitative and qualitative , along with dual modeling techniques ( top-down and bottom-up) and a final layer of validation through our proprietary in-house repository.
PRIMARY RESEARCH
Primary research captures real-time, firsthand insights from the market to understand behaviors, motivations, and emerging trends.
1. Quantitative Primary Research
Objective: Generate statistically significant data directly from market participants.
Approaches:- Structured surveys with customers, distributors, and field agents
- Mobile-based data collection for point-of-sale audits and usage behavior
- Phone-based interviews (CATI) for market sizing and product feedback
- Online polling around industry events and digital campaigns
- Purchase frequency by customer type
- Channel performance across geographies
- Feature demand by application or demographic
2. Qualitative Primary Research
Objective: Explore decision-making drivers, pain points, and market readiness.
Approaches:- In-depth interviews (IDIs) with executives, product managers, and key decision-makers
- Focus groups among end users and early adopters
- Site visits and observational research for consumer products
- Informal field-level discussions for regional and cultural nuances
SECONDARY RESEARCH
This phase helps establish a macro-to-micro understanding of market trends, size, regulation, and competitive dynamics, sourced from credible and public domain information.
1. Quantitative Secondary Research
Objective: Model market value and segment-level forecasts based on published data.
Sources include:- Financial reports and investor summaries
- Government trade data, customs records, and regulatory statistics
- Industry association publications and economic databases
- Channel performance and pricing data from marketplace listings
- Revenue splits, pricing trends, and CAGR estimates
- Supply-side capacity and volume tracking
- Investment analysis and funding benchmarks
2. Qualitative Secondary Research
Objective: Capture strategic direction, innovation signals, and behavioral trends.
Sources include:- Company announcements, roadmaps, and product pipelines
- Publicly available whitepapers, conference abstracts, and academic research
- Regulatory body publications and policy briefs
- Social and media sentiment scanning for early-stage shifts
- Strategic shifts in market positioning
- Unmet needs and white spaces
- Regulatory triggers and compliance impact

DUAL MODELING: TOP-DOWN + BOTTOM-UP
To ensure robust market estimation, we apply two complementary sizing approaches:
Top-Down Modeling:- Start with broader industry value (e.g., global or regional TAM)
- Apply filters by segment, geography, end-user, or use case
- Adjust with primary insights and validation benchmarks
- Ideal for investor-grade market scans and opportunity mapping
- Aggregate from the ground up using sales volumes, pricing, and unit economics
- Use internal modeling templates aligned with stakeholder data
- Incorporate distributor-level or region-specific inputs
- Most accurate for emerging segments and granular sub-markets
DATA VALIDATION: IN-HOUSE REPOSITORY
We close the loop with proprietary data intelligence built from ongoing projects, industry monitoring, and historical benchmarking. This repository includes:
- Multi-sector market and pricing models
- Key trendlines from past interviews and forecasts
- Benchmarked adoption rates, churn patterns, and ROI indicators
- Industry-specific deviation flags and cross-check logic
- Catches inconsistencies early
- Aligns projections across studies
- Enables consistent, high-trust deliverables