
Interactive Whiteboard Market Size and Forecast (2020 - 2033), Global and Regional Share, Trend, and Industry Analysis Report Coverage: By Product Type (Fixed, Mobile/Portable, Kits, Integrated Displays), By Technology (Infrared, Electromagnetic, Optical, Capacitive, Multi-touch), By Component (Hardware, Software, Services), By Application (Education K-12, Higher Education, Corporate, Government, Healthcare, Retail & Others), and Geography
2025-11-21
Consumer Products
Jaya Bundele (Research Analyst)
Description
Interactive Whiteboard (IWB) Market Overview
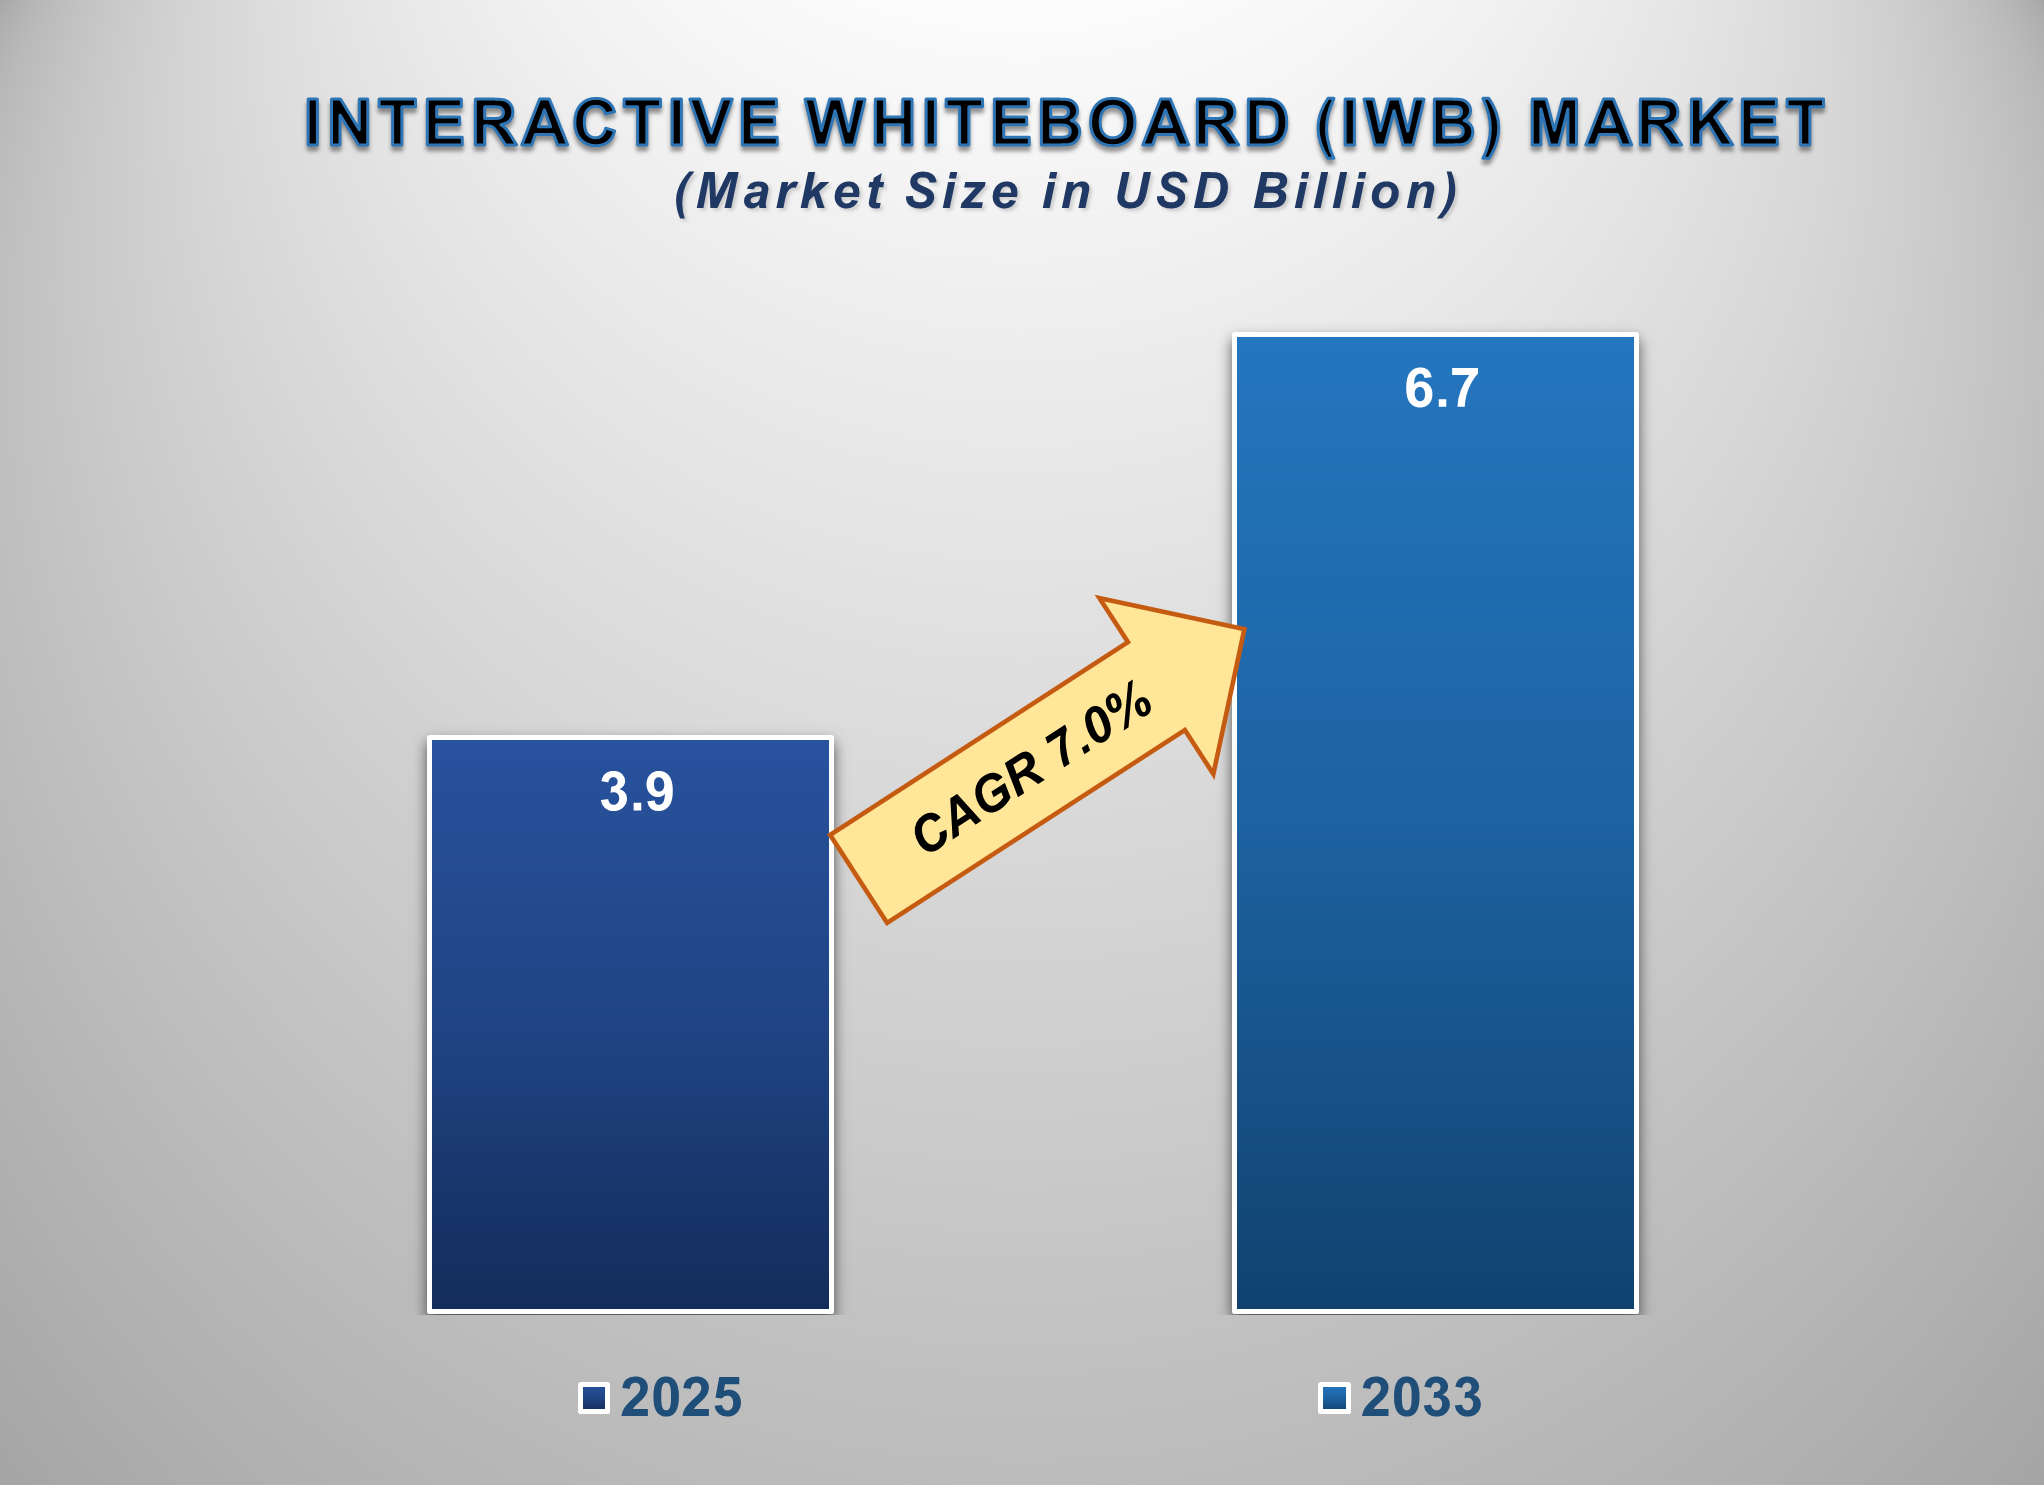
The Interactive Whiteboard (IWB) Market is poised for significant growth from 2025 to 2033, driven by the global acceleration of digitalization in education and corporate sectors, rising investments in smart infrastructure, and the increasing adoption of collaborative technologies. The market is projected to be valued at approximately USD 3.9 billion in 2025 and is forecasted to reach nearly USD 6.7 billion by 2033, exhibiting a compound annual growth rate (CAGR) of 7.0% during this period.
Interactive whiteboards are large interactive
display panels that can be either a standalone touchscreen computer or a
connectable apparatus used to control computers from a projector. Market growth
is primarily fueled by the shift from traditional teaching and presentation
methods to dynamic, digital-first approaches. The post-pandemic emphasis on
hybrid work and learning models has been a key catalyst, creating a sustained
demand for tools that facilitate seamless collaboration between in-person and remote
participants.
Furthermore, technological advancements such as
the integration of multi-touch capabilities, 4K resolution, and cloud
connectivity are enhancing user experience and driving upgrades. North America
and Europe are mature markets characterized by high replacement rates and the
adoption of advanced solutions, while the Asia-Pacific region is expected to
witness the fastest growth, fueled by massive government initiatives in
education technology and rapid corporate expansion.
Interactive
Whiteboard (IWB) Market Drivers and Opportunities
Digital Transformation in Education and
Corporate Sectors is the Primary Market Driver
The global push for digital transformation
across core sectors is the fundamental driver for the IWB market. In the
education sector, governments and institutions worldwide are heavily investing
in smart classroom infrastructure to modernize curricula and improve student
engagement through interactive learning. In the corporate world, the permanent
shift to hybrid work models has made interactive whiteboards a critical tool
for conference rooms and huddle spaces, enabling effective brainstorming,
training, and presentations with remote teams. The need for visual
collaboration tools that go beyond simple video conferencing to include
real-time annotation and content sharing is propelling adoption across both
these key end-user segments, ensuring robust and sustained market growth.
Technological Advancements and the Shift to
Interactive Flat Panels (IFPs) are Driving Premiumization
Continuous innovation in display and touch
technology is a powerful catalyst, transforming IWBs from simple presentation
tools into central collaboration hubs. The market is witnessing a significant
shift from traditional projector-based whiteboards to advanced Interactive Flat
Panels (IFPs), which offer superior image quality, reliability, and multi-touch
functionality. Innovations such as embedded operating systems (Android,
Windows), built-in video conferencing capabilities, and wireless screen sharing
(e.g., Miracast, AirPlay) are creating all-in-one solutions. The integration of
Artificial Intelligence (AI) for features like automatic transcription and
gesture control represents the next frontier. These advancements allow
manufacturers to differentiate their products and command higher prices, moving
the market beyond basic functionality and driving value growth through enhanced
performance, integration, and user experience.
The Expansion of Hybrid Work/Learning Models
and Untapped Emerging Economies Presents
Significant Opportunities
The structural adoption of hybrid work and
blended learning models has created a durable, long-term growth frontier for
the IWB market. This trend necessitates technology that bridges the gap between
physical and virtual participants, a core function of modern interactive
displays. This creates a vast replacement and new installation market in
corporate offices and educational institutions globally. Simultaneously, the
vast, untapped potential in emerging economies across Asia-Pacific, Latin
America, and Africa represents a massive
opportunity. Governments in countries like India, China, and Brazil are
launching national digital education missions, while corporations in these
regions are modernizing their offices. Catering to these price-sensitive
markets with value-oriented, durable, and easy-to-use models is a major
strategic opportunity for market players.
Interactive Whiteboard
(IWB) Market Scope
|
Report Attributes |
Description |
|
Market Size in 2025 |
USD 3.9 Billion |
|
Market Forecast in 2033 |
USD 6.7 Billion |
|
CAGR % 2025-2033 |
7.0% |
|
Base Year |
2024 |
|
Historic Data |
2020-2024 |
|
Forecast Period |
2025-2033 |
|
Report USP |
Product Portfolio,
Technological Analysis, Company Market Share, Company Heatmap, Pricing
Analysis, Growth Factors and more |
|
Segments Covered |
●
By Product Type ●
By Technology ●
By Application ●
By Component |
|
Regional Scope |
●
North America, ●
Europe, ●
APAC, ●
Latin America ●
Middle East and
Africa |
|
Country Scope |
1)
U.S. 2)
Canada 3)
Germany 4)
UK 5)
France 6)
Spain 7)
Italy 8)
Switzerland 9)
China 10)
Japan 11)
India 12)
Australia 13)
South Korea 14)
Brazil 15)
Mexico 16)
Argentina 17)
South Africa 18)
Saudi Arabia 19)
UAE |
Interactive Whiteboard
(IWB) Market Report Segmentation Analysis
The global Interactive Whiteboard
Market industry analysis is segmented by Technology, by End-User, by Screen
Size, and by region.
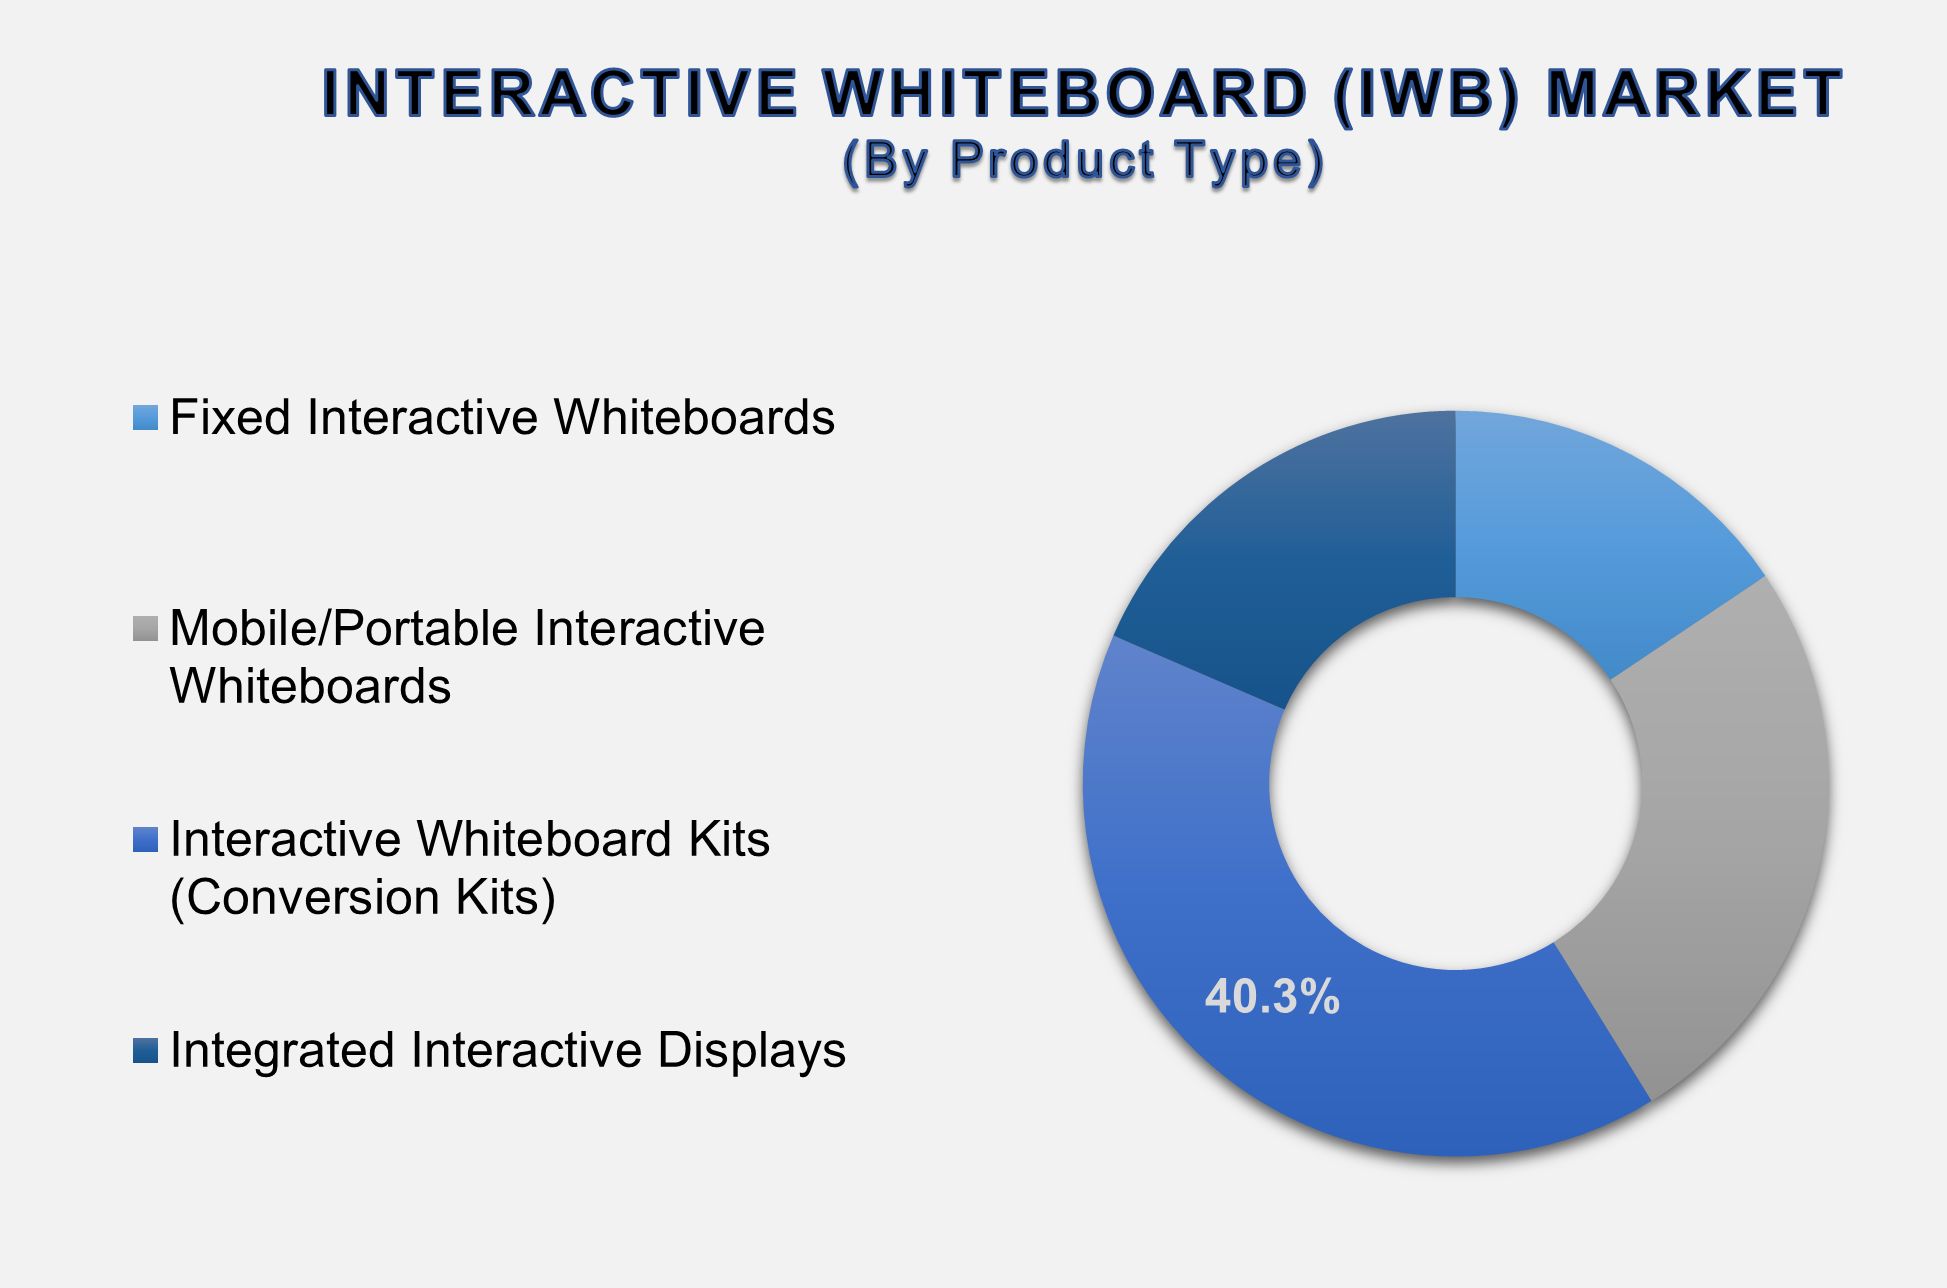
The Integrated
Interactive Displays Segment is Anticipated to Command the Largest Market Share
and Witness the Highest Growth
The dominance of Integrated Interactive Displays
is due to their superior user experience, reliability, and all-in-one
functionality. These displays, which are essentially large-format touchscreen
computers, offer brilliant 4K/UHD resolution, zero maintenance (no bulbs or
filters like projectors), and often come with built-in computing, audio, and
video conferencing capabilities. Their sleek design, ease of use, and robust
performance make them the preferred choice for new corporate installations and
modern educational institutions, driving both market value and growth as they
increasingly replace older projector-based systems.
Capacitive/Projected Capacitive Technology
Segment is Projected to Lead the Market
Capacitive technology is becoming the gold standard for high-end Interactive Whiteboards and Integrated Displays. Its popularity stems from providing a user experience identical to that of modern smartphones and tablets—highly responsive, multi-touch, and gesture-enabled interaction without the need for special styluses. Capacitive screens are durable, offer excellent clarity, and are less prone to calibration issues than optical or infrared technologies. As the market shifts towards more intuitive and robust solutions, capacitive technology is witnessing the fastest adoption, particularly in corporate and high-budget educational environments.
The Hardware Component Segment Dominated the
Global Market in 2025, but Software is the Fastest Growing
As a fundamentally hardware-driven market, the
hardware segment—comprising the physical displays, projectors, and
pens—naturally holds the largest revenue share. However, the software and
services segment is projected to be the fastest-growing. The reason for this is
the increasing focus on the ecosystem; the true value of an IWB is unlocked by
its collaboration software, firmware updates, and apps that enable screen
sharing, cloud integration, and digital whiteboarding. Vendors are increasingly
monetizing software subscriptions and professional services like installation
and training, making this component critical for differentiation and recurring
revenue.
The Education (K-12) application Segment
Dominated the Global Market in 2025
The K-12 education sector remains the largest
application segment due to its scale and the global priority placed on
modernizing primary and secondary education. Widespread government funding,
initiatives for digital classrooms, and the direct impact of interactive tools
on student engagement make this segment the bedrock of the IWB market. The
sheer volume of classrooms worldwide and the push for STEM/STEAM education
ensure consistent, high-volume demand. The Corporate segment is the second
largest and is the key driver for premium, feature-rich products, fueled by the
needs of hybrid meetings and corporate training.
The following segments are part of an in-depth analysis of
the global Interactive Whiteboard (IWB) Market:
|
Market
Segments |
|
|
By Product
Type |
●
Fixed Interactive
Whiteboards ●
Mobile/Portable
Interactive Whiteboards ●
Interactive
Whiteboard Kits (Conversion Kits) ●
Integrated
Interactive Displays |
|
By
Technology |
●
Infrared (IR) Touch ●
Electromagnetic
Pen/Touch ●
Optical
(Camera-based) Touch ●
Laser/Ultrasonic ●
Capacitive/Projected
Capacitive ●
Multi-touch
(Gesture-enabled) |
|
By
Application |
●
Education (K-12) ●
Higher Education ●
Corporate (Meetings,
Training, Conferencing) ●
Government &
Public Sector ●
Healthcare ●
Retail & Others |
|
By Component |
●
Hardware ●
Software ●
Services |
Interactive Whiteboard
(IWB) Market Share Analysis by Region
The Asia-Pacific region
is anticipated to hold the largest portion of the Interactive Whiteboard Market
globally throughout the forecast period.
Asia-Pacific's dominance is attributed to massive
government-led digital education initiatives, rapid corporate growth, and
extensive investments in smart city infrastructure. Countries like China,
India, Japan, and South Korea are at the forefront of this growth. China's
"Education Modernization 2035" plan and India's "Digital
India" campaign are driving large-scale adoption of smart classrooms. The
region benefits from a vast population, a growing number of educational
institutions, and an expanding corporate sector that is rapidly adopting hybrid
work models. The presence of major manufacturing hubs also contributes to
competitive pricing and market growth, solidifying Asia-Pacific's position as
the largest and most dynamic market for interactive whiteboards.
Interactive Whiteboard
(IWB) Market Competition Landscape Analysis
The global interactive
whiteboard market is moderately consolidated and highly competitive, featuring
a mix of global technology giants, specialized display manufacturers, and
strong regional players. Competition is intense and centered on technological innovation,
product quality and reliability, pricing, software ecosystem, and after-sales
service. Key strategies include continuous R&D to improve display and touch
technology, developing proprietary collaboration software, forming strategic
partnerships with educational and enterprise software providers, and expanding
distribution networks. The rise of value-focused brands, particularly from
Asia, has intensified price competition in the mid and low-end segments.
Global Interactive
Whiteboard (IWB) Market Recent Developments News:
- In January 2025, Google announced a deep
integration of its Google Workspace tools into a new line of interactive
displays from a major OEM, targeting the enterprise segment.
- In November 2024, Microsoft launched a new version
of its Surface Hub, featuring enhanced AI-powered collaboration tools and
improved integration with Microsoft Teams Rooms.
- In September 2024, ViewSonic introduced a new
series of 4K Interactive Flat Panels with a unified communications
platform built in, specifically
designed for hybrid work environments.
- In July 2024, MAXHUB, a leading Chinese provider, expanded its
footprint in the European market with the launch of its latest V6 series
interactive displays, emphasizing seamless wireless connectivity.
The Global Interactive
Whiteboard (IWB) Market Is Dominated by a Few Large Companies, such as
●
Microsoft Corporation
●
Google LLC
●
Samsung Electronics
Co., Ltd.
●
SMART Technologies
(Foxconn)
●
Promethean World Ltd.
●
ViewSonic Corporation
●
LG Electronics Inc.
●
Sharp Corporation
(Foxconn)
●
Cisco Systems, Inc.
●
Planar Systems
(Leyard)
●
BenQ Corporation
●
Newline Interactive
●
Hikvision
●
MAXHUB
●
Julong Co., Ltd.
● Other Prominent Players
Frequently Asked Questions
Jaya Bundele (Research Analyst)
Jaya Bundele is a skilled Research Analyst with 4+ years of experience in market intelligence, consumer insights, competitive analysis, and industry forecasting across the consumer goods, agriculture, and food & beverage sectors. She specializes in market sizing, trend analysis, growth opportunity mapping, and strategic secondary research for global and regional markets.
Her expertise lies in transforming complex industry data into actionable business strategies that help organizations identify emerging trends, understand customer behavior, and gain a competitive edge. With a strong focus on data-driven insights, business intelligence, and future market trends, Jaya delivers high-quality research solutions aligned with evolving industry demands and market dynamics.
1. Global Interactive
Whiteboard (IWB) Market Introduction and Market Overview
1.1.
Objectives
of the Study
1.2.
Global
Interactive Whiteboard (IWB) Market Scope and Market Estimation
1.2.1.Global Electronic Toll
Collection Overall Market Size (US$ Bn), Market CAGR (%), Market forecast (2025
- 2033)
1.2.2.Global Interactive
Whiteboard (IWB) Market Revenue Share (%) and Growth Rate (Y-o-Y) from 2020 - 2033
1.3.
Market
Segmentation
1.3.1.Product Type of Global Interactive
Whiteboard (IWB) Market
1.3.2.Component of Global Interactive
Whiteboard (IWB) Market
1.3.3.Application of Global Interactive
Whiteboard (IWB) Market
1.3.4.Technology of Global Interactive
Whiteboard (IWB) Market
1.3.5.Region of Global Interactive
Whiteboard (IWB) Market
2.
Executive Summary
2.1.
Demand
Side Trends
2.2.
Key
Market Trends
2.3.
Market
Demand (US$ Bn) Analysis 2020 – 2024 and Forecast, 2025 – 2033
2.4.
Demand
and Opportunity Assessment
2.5.
Pricing
Analysis
2.6.
Technological
Advancements
2.7.
Key
Developments
2.8.
Market
Entry Strategies
2.9.
Market
Dynamics
2.9.1.Drivers
2.9.2.Limitations
2.9.3.Opportunities
2.9.4.Impact Analysis of Drivers
and Restraints
2.10.
Porter’s
Five Forces Analysis
2.11.
PEST
Analysis
3. Global
Interactive Whiteboard (IWB) Market
Estimates & Historical Trend Analysis (2020 - 2024)
4. Global
Interactive Whiteboard (IWB) Market
Estimates & Forecast Trend Analysis, by Product
Type
4.1.
Global
Interactive Whiteboard (IWB) Market Revenue (US$ Bn) Estimates and Forecasts,
by Product Type, 2020 - 2033
4.1.1.Fixed Interactive
Whiteboards
4.1.2.Mobile/Portable
Interactive Whiteboards
4.1.3.Interactive Whiteboard
Kits (Conversion Kits)
4.1.4.Integrated Interactive
Displays
5. Global
Interactive Whiteboard (IWB) Market
Estimates & Forecast Trend Analysis, by Component
5.1.
Global
Interactive Whiteboard (IWB) Market Revenue (US$ Bn) Estimates and Forecasts,
by Component, 2020 - 2033
5.1.1.Hardware
5.1.2.Software
5.1.3.Services
6. Global
Interactive Whiteboard (IWB) Market
Estimates & Forecast Trend Analysis, by Application
6.1.
Global
Interactive Whiteboard (IWB) Market Revenue (US$ Bn) Estimates and Forecasts,
by Application, 2020 - 2033
6.1.1.Education (K-12)
6.1.2.Higher Education
6.1.3.Corporate (Meetings,
Training, Conferencing)
6.1.4.Government & Public
Sector
6.1.5.Healthcare
6.1.6.Retail & Others
7. Global
Interactive Whiteboard (IWB) Market
Estimates & Forecast Trend Analysis, by Technology
7.1.
Global
Interactive Whiteboard (IWB) Market Revenue (US$ Bn) Estimates and Forecasts,
by Technology, 2020 - 2033
7.1.1.Infrared (IR) Touch
7.1.2.Electromagnetic Pen/Touch
7.1.3.Optical (Camera-based)
Touch
7.1.4.Laser/Ultrasonic
7.1.5.Capacitive/Projected
Capacitive
7.1.6.Multi-touch
(Gesture-enabled)
8. Global
Interactive Whiteboard (IWB) Market
Estimates & Forecast Trend Analysis, by region
8.1.
Global
Interactive Whiteboard (IWB) Market Revenue (US$ Bn) Estimates and Forecasts,
by region, 2020 - 2033
8.1.1.North America
8.1.2.Europe
8.1.3.Asia Pacific
8.1.4.Middle East & Africa
8.1.5.Latin America
9. North America Interactive
Whiteboard (IWB) Market: Estimates
& Forecast Trend Analysis
9.1. North America Interactive
Whiteboard (IWB) Market Assessments & Key Findings
9.1.1.North America Interactive
Whiteboard (IWB) Market Introduction
9.1.2.North America Interactive
Whiteboard (IWB) Market Size Estimates and Forecast (US$ Billion) (2020 - 2033)
9.1.2.1.
By Product Type
9.1.2.2.
By Component
9.1.2.3.
By Application
9.1.2.4.
By Technology
9.1.2.5. By Country
9.1.2.5.1. The U.S.
9.1.2.5.2. Canada
10. Europe Interactive
Whiteboard (IWB) Market: Estimates
& Forecast Trend Analysis
10.1. Europe Interactive
Whiteboard (IWB) Market Assessments & Key Findings
10.1.1. Europe Interactive
Whiteboard (IWB) Market Introduction
10.1.2. Europe Interactive
Whiteboard (IWB) Market Size Estimates and Forecast (US$ Billion) (2020 - 2033)
10.1.2.1.
By Product Type
10.1.2.2.
By Component
10.1.2.3.
By Application
10.1.2.4.
By Technology
10.1.2.5. By Country
10.1.2.5.1.
Germany
10.1.2.5.2.
Italy
10.1.2.5.3.
U.K.
10.1.2.5.4.
France
10.1.2.5.5.
Spain
10.1.2.5.6.
Switzerland
10.1.2.5.7. Rest
of Europe
11. Asia Pacific Interactive
Whiteboard (IWB) Market: Estimates
& Forecast Trend Analysis
11.1. Asia Pacific Market
Assessments & Key Findings
11.1.1.
Asia
Pacific Interactive Whiteboard (IWB) Market Introduction
11.1.2.
Asia
Pacific Interactive Whiteboard (IWB) Market Size Estimates and Forecast (US$ Billion)
(2020 - 2033)
11.1.2.1.
By Product Type
11.1.2.2.
By Component
11.1.2.3.
By Application
11.1.2.4.
By Technology
11.1.2.5. By Country
11.1.2.5.1. China
11.1.2.5.2. Japan
11.1.2.5.3. India
11.1.2.5.4. Australia
11.1.2.5.5. South Korea
11.1.2.5.6. Rest of Asia Pacific
12. Middle East & Africa Interactive
Whiteboard (IWB) Market: Estimates
& Forecast Trend Analysis
12.1. Middle East & Africa
Market Assessments & Key Findings
12.1.1. Middle
East & Africa
Interactive Whiteboard (IWB) Market Introduction
12.1.2. Middle
East & Africa
Interactive Whiteboard (IWB) Market Size Estimates and Forecast (US$ Billion) (2020
- 2033)
12.1.2.1.
By Product Type
12.1.2.2.
By Component
12.1.2.3.
By Application
12.1.2.4.
By Technology
12.1.2.5. By Country
12.1.2.5.1. UAE
12.1.2.5.2. Saudi
Arabia
12.1.2.5.3. South
Africa
12.1.2.5.4. Rest
of MEA
13. Latin America
Interactive Whiteboard (IWB) Market:
Estimates & Forecast Trend Analysis
13.1. Latin America Market
Assessments & Key Findings
13.1.1. Latin America Interactive
Whiteboard (IWB) Market Introduction
13.1.2. Latin America Interactive
Whiteboard (IWB) Market Size Estimates and Forecast (US$ Billion) (2020 - 2033)
13.1.2.1.
By Product Type
13.1.2.2.
By Component
13.1.2.3.
By Application
13.1.2.4.
By Technology
13.1.2.5. By Country
13.1.2.5.1. Brazil
13.1.2.5.2. Argentina
13.1.2.5.3. Mexico
13.1.2.5.4. Rest
of LATAM
14.
Country
Wise Market: Introduction
15.
Competition
Landscape
15.1. Global Interactive
Whiteboard (IWB) Market Product Mapping
15.2. Global Interactive
Whiteboard (IWB) Market Concentration Analysis, by Leading Players / Innovators
/ Emerging Players / New Entrants
15.3. Global Interactive
Whiteboard (IWB) Market Tier Structure Analysis
15.4. Global Interactive
Whiteboard (IWB) Market Concentration & Company Market Shares (%) Analysis,
2024
16.
Company
Profiles
16.1.
Microsoft Corporation
16.1.1.
Company
Overview & Key Stats
16.1.2.
Financial
Performance & KPIs
16.1.3.
Product
Portfolio
16.1.4.
SWOT
Analysis
16.1.5.
Business
Strategy & Recent Developments
* Similar details would be provided for all the players
mentioned below
16.2.
Google LLC
16.3.
Samsung Electronics Co., Ltd.
16.4.
SMART Technologies (Foxconn)
16.5.
Promethean World Ltd.
16.6.
ViewSonic Corporation
16.7.
LG Electronics Inc.
16.8.
Sharp Corporation (Foxconn)
16.9.
Cisco Systems, Inc.
16.10.
Planar Systems (Leyard)
16.11.
BenQ Corporation
16.12.
Newline Interactive
16.13.
Hikvision
16.14.
MAXHUB
16.15.
Julong Co., Ltd.
16.16.
Other Prominent Players
17. Research
Methodology
17.1. External Transportations /
Databases
17.2. Internal Proprietary
Database
17.3. Primary Research
17.4. Secondary Research
17.5. Assumptions
17.6. Limitations
17.7. Report FAQs
18. Research
Findings & Conclusion
Our Research Methodology
"Insight without rigor is just noise."
We follow a comprehensive, multi-phase research framework designed to deliver accurate, strategic, and decision-ready intelligence. Our process integrates primary and secondary research , both quantitative and qualitative , along with dual modeling techniques ( top-down and bottom-up) and a final layer of validation through our proprietary in-house repository.
PRIMARY RESEARCH
Primary research captures real-time, firsthand insights from the market to understand behaviors, motivations, and emerging trends.
1. Quantitative Primary Research
Objective: Generate statistically significant data directly from market participants.
Approaches:- Structured surveys with customers, distributors, and field agents
- Mobile-based data collection for point-of-sale audits and usage behavior
- Phone-based interviews (CATI) for market sizing and product feedback
- Online polling around industry events and digital campaigns
- Purchase frequency by customer type
- Channel performance across geographies
- Feature demand by application or demographic
2. Qualitative Primary Research
Objective: Explore decision-making drivers, pain points, and market readiness.
Approaches:- In-depth interviews (IDIs) with executives, product managers, and key decision-makers
- Focus groups among end users and early adopters
- Site visits and observational research for consumer products
- Informal field-level discussions for regional and cultural nuances
SECONDARY RESEARCH
This phase helps establish a macro-to-micro understanding of market trends, size, regulation, and competitive dynamics, sourced from credible and public domain information.
1. Quantitative Secondary Research
Objective: Model market value and segment-level forecasts based on published data.
Sources include:- Financial reports and investor summaries
- Government trade data, customs records, and regulatory statistics
- Industry association publications and economic databases
- Channel performance and pricing data from marketplace listings
- Revenue splits, pricing trends, and CAGR estimates
- Supply-side capacity and volume tracking
- Investment analysis and funding benchmarks
2. Qualitative Secondary Research
Objective: Capture strategic direction, innovation signals, and behavioral trends.
Sources include:- Company announcements, roadmaps, and product pipelines
- Publicly available whitepapers, conference abstracts, and academic research
- Regulatory body publications and policy briefs
- Social and media sentiment scanning for early-stage shifts
- Strategic shifts in market positioning
- Unmet needs and white spaces
- Regulatory triggers and compliance impact

DUAL MODELING: TOP-DOWN + BOTTOM-UP
To ensure robust market estimation, we apply two complementary sizing approaches:
Top-Down Modeling:- Start with broader industry value (e.g., global or regional TAM)
- Apply filters by segment, geography, end-user, or use case
- Adjust with primary insights and validation benchmarks
- Ideal for investor-grade market scans and opportunity mapping
- Aggregate from the ground up using sales volumes, pricing, and unit economics
- Use internal modeling templates aligned with stakeholder data
- Incorporate distributor-level or region-specific inputs
- Most accurate for emerging segments and granular sub-markets
DATA VALIDATION: IN-HOUSE REPOSITORY
We close the loop with proprietary data intelligence built from ongoing projects, industry monitoring, and historical benchmarking. This repository includes:
- Multi-sector market and pricing models
- Key trendlines from past interviews and forecasts
- Benchmarked adoption rates, churn patterns, and ROI indicators
- Industry-specific deviation flags and cross-check logic
- Catches inconsistencies early
- Aligns projections across studies
- Enables consistent, high-trust deliverables