
Linerless Labels Market Size and Forecast (2025–2033), Global and Regional Growth, Trend, Share and Industry Analysis Report Coverage: By Adhesion Type (Permanent, Removable, Repositionable, Others), By Printing Technologies (Direct Thermal, Thermal Transfer, Laser, Inkjet, Others), By Application (Food & Beverage, Pharmaceutical & Personal Care, Retail, Logistics, Others), By Component (Facestock, Adhesive, Release Coating), and Geography
2025-12-18
Packaging Industry
Jaya Bundele (Research Analyst)
Description
Linerless
Labels Market Overview
The Global Linerless Labels Market is projected to reach USD 2.5 billion by 2033, up from USD 1.6 billion in 2025, registering a CAGR of 6.1% during 2025–2033. The market is witnessing robust expansion as industries increasingly shift toward sustainable labeling technologies that reduce waste, enhance efficiency, and minimize overall production costs. Linerless labels, which eliminate the need for traditional release liners, offer a more environmentally friendly solution and enable higher label roll capacity, reducing downtime and material usage. As global sustainability regulations tighten and companies adopt eco-friendly packaging standards, linerless labels are emerging as a preferred alternative across multiple end-use industries, including food & beverage, retail, and logistics.

Growing adoption of automation in
packaging lines, advancements in thermal printing technologies, and rising
e-commerce activities further support market growth. Food & beverage
manufacturers remain the largest adopters due to increasing demand for efficient
labeling solutions with excellent adhesion and temperature resistance.
Linerless
Labels Market Drivers and Opportunities
Rising Adoption of Sustainable
and Cost-Efficient Packaging Solutions Is Driving Market Growth
The demand for sustainable
labeling solutions is one of the primary drivers boosting the linerless labels
market worldwide. With global regulations emphasizing waste reduction,
recyclability, and resource efficiency, industries are increasingly shifting away
from liner-backed labels, which generate tons of silicone-coated paper waste
annually. Linerless labels eliminate liner disposal requirements, offering
companies significant environmental and financial benefits. These labels also
enable greater space utilization, allowing more labels per roll, reducing
changeovers, lowering transportation costs, and improving operational
efficiency in high-volume packaging lines.
In addition, the strong consumer
and regulatory push toward sustainability is compelling brands to adopt
packaging that aligns with circular economy principles. The rise of green
manufacturing and carbon footprint reduction initiatives is accelerating investment
in linerless labeling technology. Industries such as food, retail, and
logistics appreciate the cost savings stemming from reduced raw material usage,
simpler handling, and fewer workplace injuries associated with liner waste. As
environmental, operational, and economic advantages converge, linerless labels
are becoming an essential component of modern packaging ecosystems, supporting
long-term market expansion.
Increasing Demand from Food
& Beverage and E-Commerce Industries Fuels Market Expansion
The expanding global food &
beverage sector, paired with rapid growth in e-commerce and omnichannel retail,
is a major force driving linerless label adoption. Food manufacturers rely
heavily on linerless labels for pricing, shelf marking, weigh-scale labeling,
and product identification due to their superior adhesion, resistance to
moisture, and compatibility with cold-chain logistics. The surge in
ready-to-eat meals, packaged foods, and delivery-based consumption patterns is
driving a substantial increase in labeling volume, significantly benefiting the
market. At the same time, the logistics and retail industries are experiencing
exponential growth driven by online shopping and last-mile delivery. Linerless
labels provide efficiency in warehouse labeling, shipping, and inventory
management, offering high-speed printing and excellent scannability. Thermal
printing technologies, especially direct thermal, enable fast, on-demand label
creation without the need for ribbons or toners, making them ideal for fast-moving
logistics operations. As global trade expands and supply chain digitization
accelerates, linerless labels will continue to see strong momentum across
distribution centers, fulfillment hubs, and retail environments.
Technological Advancements in
Printing and Labeling Equipment Create Significant Opportunities
Advancements in thermal printing,
adhesive formulations, and facestock durability are opening new growth avenues
for the linerless labels market. Direct thermal and thermal transfer printing
technologies have significantly evolved, allowing high-resolution, long-lasting
images suitable for critical applications such as pharmaceutical labeling,
perishable food tracking, and logistics documentation. Improvements in inkjet
and laser printing compatibility are further expanding the range of substrates
suitable for linerless labels. Additionally, manufacturers are developing
innovative facestock materials that offer enhanced heat and abrasion
resistance, improved tensile strength, and greater versatility for both indoor
and outdoor applications. The evolution of repositionable and high-performance
adhesives is also enabling wider adoption in sectors requiring label
flexibility and reusability. Equipment manufacturers are integrating advanced
sensors, automatic cutters, and real-time monitoring features into linerless
label applicators, increasing efficiency and reducing downtime. These
technological innovations are expected to unlock new opportunities across
high-volume manufacturing and regulated industries in the coming years.
Linerless Labels Market Scope
|
Report Attributes |
Description |
|
Market Size in 2025 |
USD 1.6 Billion |
|
Market Forecast in 2033 |
USD 2.5 Billion |
|
CAGR % 2025-2033 |
6.1% |
|
Base Year |
2024 |
|
Historic Data |
2020-2024 |
|
Forecast Period |
2025-2033 |
|
Report USP |
Production, Consumption,
Company Share, Company Heatmap, Company Production Capacity, Growth Factors,
and more |
|
Segments Covered |
●
By Adhesion Type ●
By Printing
Technologies ●
By Application ●
By Component |
|
Regional Scope |
●
North America ●
Europe ●
APAC ●
Latin America ●
Middle East and
Africa |
|
Country Scope |
1)
U.S. 2)
Canada 3)
Germany 4)
UK 5)
France 6)
Spain 7)
Italy 8)
Switzerland 9)
China 10)
Japan 11)
India 12)
Australia 13)
South Korea 14)
Brazil 15)
Mexico 16)
Argentina 17)
South Africa 18)
Saudi Arabia 19)
UAE |
Linerless Labels Market Report Segmentation Analysis
The global Linerless Labels
Market industry analysis is segmented by Adhesion Type, by Printing
Technologies, by Application, by Component, and by region.
Permanent Adhesion Type
Segment Accounted for the Largest Market Share in the Global Linerless Labels
Market
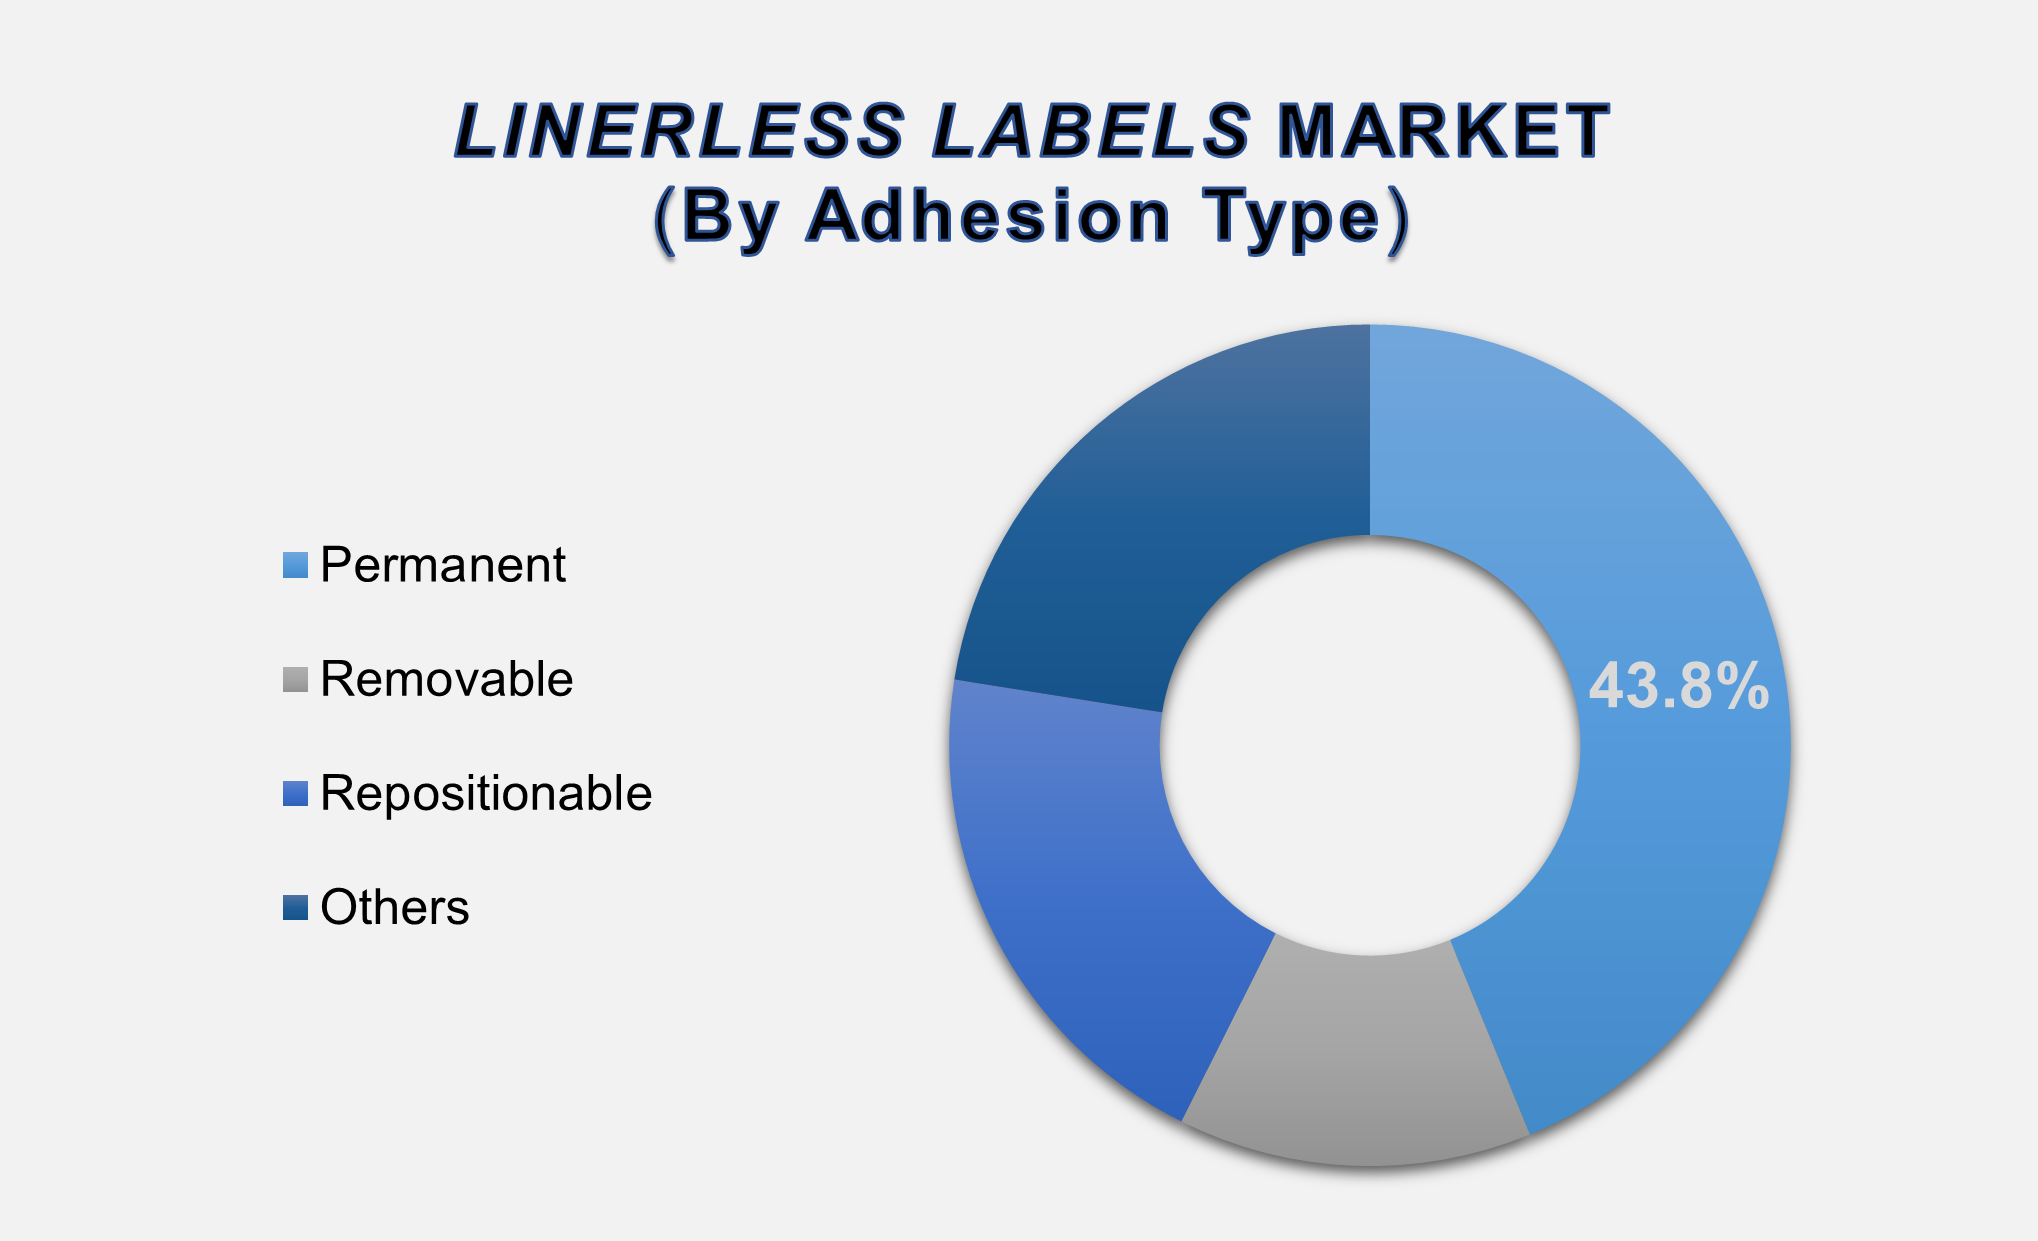
By adhesion type, the market is categorized into Permanent, Removable, Repositionable, and Others. The Permanent segment dominated the global market in 2025, accounting for 43.8% of total revenue. Permanent linerless labels are preferred for applications requiring strong, long-lasting adhesion, particularly in the food & beverage and logistics sectors. Their ability to withstand moisture, temperature changes, and handling makes them ideal for packaging, shipping, and retail environments. Increasing demand for durable labeling solutions in high-volume packaging operations and advancements in adhesive chemistry continue to reinforce the segment’s leadership.
Direct Thermal Printing
Technology Accounted for the Largest Market Share in 2025
By printing technology, the
market includes Direct Thermal, Thermal Transfer, Laser, Inkjet, and Others.
The Direct Thermal segment leads the market due to its cost efficiency, high
printing speed, and compatibility with linerless label rolls. It is widely used
in retail point-of-sale systems, logistics operations, and food labeling due to
its ease of use and elimination of ribbons or toners. Rapid growth in
e-commerce, inventory tracking, and weigh-scale labeling further contributes to
the strong adoption of direct thermal printing technology in linerless label
applications.
Food & Beverage
Application Segment Held the Largest Market Share Globally
By application, the market is
divided into Food & Beverage, Pharmaceutical & Personal Care, Retail,
Logistics, and Others. The Food & Beverage segment dominated the global
market in 2025. Linerless labels are extensively used in food packaging for
pricing, product identification, and regulatory compliance. Their eco-friendly
nature, cost-effectiveness, and ability to perform well under varying storage
conditions make them a preferred choice for fresh produce, frozen foods, and
ready meals. Rising demand for packaged food and growing emphasis on efficient
labeling systems further propel the segment’s significant share.
The following segments are
part of an in-depth analysis of the global Linerless Labels Market:
|
Market
Segments |
|
|
By Adhesion Type |
●
Permanent ●
Removable ●
Repositionable ●
Others |
|
By Printing
Technologies |
●
Direct Thermal ●
Thermal Transfer ●
Laser ●
Inkjet ●
Others |
|
By Application |
●
Food & Beverage ●
Pharmaceutical &
Personal Care ●
Retail ●
Logistics ●
Others |
|
By Component |
●
Facestock ●
Adhesive ●
Release Coating |
Linerless
Labels Market Share Analysis by Region
The
Asia-Pacific region is projected to hold the largest share of the global
Linerless Labels market over the forecast period.
The Asia-Pacific (APAC) region
accounted for the largest share of 41.4% in the global linerless labels market
in 2025. The region’s dominance is driven by rapid industrialization, expanding
food manufacturing activity, and strong growth in retail and e-commerce sectors
across China, India, Japan, and Southeast Asia. Additionally, rising
sustainability initiatives and investments in automated packaging technologies
are accelerating the adoption of linerless labeling solutions in APAC.
North America is expected to grow
at the highest CAGR during the forecast period. The region’s growth is driven
by advanced retail infrastructures, increased adoption of smart labeling
solutions, and stringent regulatory standards promoting waste reduction and
sustainable packaging. Strong technological innovation and the presence of
major retail chains continue to support the region’s expanding market
potential.
Linerless Labels Market Competition Landscape Analysis
The global
linerless labels market is moderately competitive, with major players focusing
on sustainability initiatives, product innovation, and expansion of thermal
printing capabilities. Companies are investing in high-performance adhesive
technologies, durable facestock materials, and automated linerless applicators
to cater to diverse industry requirements.
Global Linerless Labels Market Recent Developments News:
- In May 2021, CCL Industries
acquired Lux Global Label Asia Pte Ltd, rebranding the entity as CCL Label
Singapore to strengthen its presence and capabilities in the Asian
labeling market.
- In February 2021, Avery
Dennison introduced its recycled PET (rPET) liner portfolio in Europe,
featuring four labeling constructions designed to support brand
sustainability goals and circular packaging initiatives.
The Global Linerless Labels Market is dominated by a
few large companies, such as
●
Avery Dennison
●
CCL Industries
●
Multi-Color
Corporation
●
UPM Raflatac
●
Coveris Holdings
●
SATO Holdings
●
Zebra Technologies
●
Herma GmbH
●
Ravenwood Packaging
●
Reflex Labels
●
Gipako
●
ImageTek Labels
●
Lintec Corporation
●
Lecta Group
●
PMC Label
●
Stickythings
●
Label Logic
●
Advanced Labels
●
L&N Label Company
●
Primary Labels
● Other Prominent Players
Frequently Asked Questions
Jaya Bundele (Research Analyst)
Jaya Bundele is a skilled Research Analyst with 4+ years of experience in market intelligence, consumer insights, competitive analysis, and industry forecasting across the consumer goods, agriculture, and food & beverage sectors. She specializes in market sizing, trend analysis, growth opportunity mapping, and strategic secondary research for global and regional markets.
Her expertise lies in transforming complex industry data into actionable business strategies that help organizations identify emerging trends, understand customer behavior, and gain a competitive edge. With a strong focus on data-driven insights, business intelligence, and future market trends, Jaya delivers high-quality research solutions aligned with evolving industry demands and market dynamics.
1. Global Linerless Labels
Market Introduction and Market Overview
1.1.
Objectives
of the Study
1.2.
Global
Linerless Labels Market Scope and Market Estimation
1.2.1.Global Linerless Labels
Market Overall Market Size (US$ Bn), Market CAGR (%), Market forecast (2025 - 2033)
1.2.2.Global Linerless Labels
Market Revenue Share (%) and Growth Rate (Y-o-Y) from 2020 - 2033
1.3.
Market
Segmentation
1.3.1.Adhesion Type of Global Linerless
Labels Market
1.3.2.Printing Technologies of
Global Linerless Labels Market
1.3.3.Application of Global Linerless
Labels Market
1.3.4.Component of Global Linerless
Labels Market
1.3.5.Region of Global Linerless
Labels Market
2. Executive
Summary
2.1.
Demand
Side Trends
2.2.
Key
Market Trends
2.3.
Market
Demand (US$ Bn) Analysis 2020 – 2024 and Forecast, 2025 – 2033
2.4.
Demand
and Opportunity Assessment
2.5.
Demand
Supply Scenario
2.6.
Market
Dynamics
2.6.1.Drivers
2.6.2.Limitations
2.6.3.Opportunities
2.6.4.Impact Analysis of Drivers
and Restraints
2.7.
Emerging
Trends for Linerless Labels Market
2.8.
Porter’s
Five Forces Analysis
2.9.
PEST
Analysis
2.10.
Key
Regulation
3. Global
Linerless Labels Market Estimates
& Historical Trend Analysis (2020 - 2024)
4.
Global Linerless Labels
Market Estimates & Forecast Trend
Analysis, by Adhesion Type
4.1.
Global
Linerless Labels Market Revenue (US$ Bn) Estimates and Forecasts, by Adhesion
Type, 2020 - 2033
4.1.1.Removable
4.1.2.Repositionable
4.1.3.Others
5.
Global Linerless Labels
Market Estimates & Forecast Trend
Analysis, by Printing Technologies
5.1.
Global
Linerless Labels Market Revenue (US$ Bn) Estimates and Forecasts, by Printing
Technologies, 2020 - 2033
5.1.1.Direct Thermal
5.1.2.Thermal Transfer
5.1.3.Laser
5.1.4.Inkjet
5.1.5.Others
6.
Global Linerless Labels
Market Estimates & Forecast Trend
Analysis, by Application
6.1.
Global
Linerless Labels Market Revenue (US$ Bn) Estimates and Forecasts, by Application,
2020 - 2033
6.1.1.Food & Beverage
6.1.2.Pharmaceutical &
Personal Care
6.1.3.Retail
6.1.4.Logistics
6.1.5.Others
7.
Global Linerless Labels
Market Estimates & Forecast Trend
Analysis, by Component
7.1.
Global
Linerless Labels Market Revenue (US$ Bn) Estimates and Forecasts, by Component,
2020 - 2033
7.1.1.Facestock
7.1.2.Adhesive
7.1.3.Release Coating
8. Global
Linerless Labels Market Estimates
& Forecast Trend Analysis, by region
1.1.
Global
Linerless Labels Market Revenue (US$ Bn) Estimates and Forecasts, by region, 2020
- 2033
1.1.1.North America
1.1.2.Europe
1.1.3.Asia Pacific
1.1.4.Middle East & Africa
1.1.5.Latin America
9. North America Linerless
Labels Market: Estimates & Forecast
Trend Analysis
9.1.
North
America Linerless Labels Market Assessments & Key Findings
9.1.1.North America Linerless
Labels Market Introduction
9.1.2.North America Linerless
Labels Market Size Estimates and Forecast (US$ Billion) (2020 - 2033)
9.1.2.1. By Adhesion
Type
9.1.2.2. By Printing
Technologies
9.1.2.3. By Application
9.1.2.4. By Component
9.1.2.5.
By
Country
9.1.2.5.1. The U.S.
9.1.2.5.2. Canada
10. Europe Linerless
Labels Market: Estimates & Forecast
Trend Analysis
10.1.
Europe
Linerless Labels Market Assessments & Key Findings
10.1.1.
Europe
Linerless Labels Market Introduction
10.1.2.
Europe
Linerless Labels Market Size Estimates and Forecast (US$ Billion) (2020 - 2033)
10.1.2.1. By Adhesion
Type
10.1.2.2. By Printing
Technologies
10.1.2.3. By Application
10.1.2.4. By Component
10.1.2.5.
By
Country
10.1.2.5.1.
Germany
10.1.2.5.2.
Italy
10.1.2.5.3.
U.K.
10.1.2.5.4.
France
10.1.2.5.5.
Spain
10.1.2.5.6.
Switzerland
10.1.2.5.7. Rest
of Europe
11. Asia Pacific Linerless
Labels Market: Estimates & Forecast
Trend Analysis
11.1.
Asia
Pacific Market Assessments & Key Findings
11.1.1.
Asia
Pacific Linerless Labels Market Introduction
11.1.2.
Asia
Pacific Linerless Labels Market Size Estimates and Forecast (US$ Billion) (2020
- 2033)
11.1.2.1. By Adhesion
Type
11.1.2.2. By Printing
Technologies
11.1.2.3. By Application
11.1.2.4. By Component
11.1.2.5.
By
Country
11.1.2.5.1. China
11.1.2.5.2. Japan
11.1.2.5.3. India
11.1.2.5.4. Australia
11.1.2.5.5. South Korea
11.1.2.5.6. Rest of Asia Pacific
12. Middle East & Africa Linerless
Labels Market: Estimates & Forecast
Trend Analysis
12.1.
Middle
East & Africa Market Assessments & Key Findings
12.1.1.
Middle East & Africa Linerless Labels Market Introduction
12.1.2.
Middle East & Africa Linerless Labels Market Size Estimates
and Forecast (US$ Billion) (2020 - 2033)
12.1.2.1. By Adhesion
Type
12.1.2.2. By Printing
Technologies
12.1.2.3. By Application
12.1.2.4. By Component
12.1.2.5.
By
Country
12.1.2.5.1. South
Africa
12.1.2.5.2. UAE
12.1.2.5.3. Saudi
Arabia
12.1.2.5.4. Rest
of MEA
13. Latin America
Linerless Labels Market: Estimates
& Forecast Trend Analysis
13.1.
Latin
America Market Assessments & Key Findings
13.1.1.
Latin
America Linerless Labels Market Introduction
13.1.2.
Latin
America Linerless Labels Market Size Estimates and Forecast (US$ Billion) (2020
- 2033)
13.1.2.1. By Adhesion
Type
13.1.2.2. By Printing
Technologies
13.1.2.3. By Application
13.1.2.4. By Component
13.1.2.5.
By
Country
13.1.2.5.1. Brazil
13.1.2.5.2. Mexico
13.1.2.5.3. Argentina
13.1.2.5.4. Rest
of LATAM
14. Country Wise Market:
Introduction
15.
Competition
Landscape
15.1.
Global
Linerless Labels Market Product Mapping
15.2.
Global
Linerless Labels Market Concentration Analysis, by Leading Players / Innovators
/ Emerging Players / New Entrants
15.3.
Global
Linerless Labels Market Tier Structure Analysis
15.4.
Global
Linerless Labels Market Concentration & Company Market Shares (%) Analysis,
2023
16.
Company
Profiles
16.1. Avery
Dennison
16.1.1.
Company
Overview & Key Stats
16.1.2.
Financial
Performance & KPIs
16.1.3.
Product
Portfolio
16.1.4.
SWOT
Analysis
16.1.5.
Business
Strategy & Recent Developments
*
Similar details would be provided for all the players mentioned below
16.2. CCL
Industries
16.3. Multi-Color
Corporation
16.4. UPM Raflatac
16.5. Coveris
Holdings
16.6. SATO Holdings
16.7. Zebra
Technologies
16.8. Herma GmbH
16.9. Ravenwood
Packaging
16.10. Reflex Labels
16.11. Gipako
16.12. ImageTek
Labels
16.13. Lintec
Corporation
16.14. Lecta Group
16.15. PMC Label
16.16. Stickythings
16.17. Label Logic
16.18. Advanced
Labels
16.19. L&N Label
Company
16.20. Primary
Labels
16.21. Other
Prominent Players
17. Research
Methodology
17.1.
External
Transportations / Databases
17.2.
Internal
Proprietary Database
17.3.
Primary
Research
17.4.
Secondary
Research
17.5.
Assumptions
17.6.
Limitations
17.7.
Report
FAQs
18. Research
Findings & Conclusion
Our Research Methodology
"Insight without rigor is just noise."
We follow a comprehensive, multi-phase research framework designed to deliver accurate, strategic, and decision-ready intelligence. Our process integrates primary and secondary research , both quantitative and qualitative , along with dual modeling techniques ( top-down and bottom-up) and a final layer of validation through our proprietary in-house repository.
PRIMARY RESEARCH
Primary research captures real-time, firsthand insights from the market to understand behaviors, motivations, and emerging trends.
1. Quantitative Primary Research
Objective: Generate statistically significant data directly from market participants.
Approaches:- Structured surveys with customers, distributors, and field agents
- Mobile-based data collection for point-of-sale audits and usage behavior
- Phone-based interviews (CATI) for market sizing and product feedback
- Online polling around industry events and digital campaigns
- Purchase frequency by customer type
- Channel performance across geographies
- Feature demand by application or demographic
2. Qualitative Primary Research
Objective: Explore decision-making drivers, pain points, and market readiness.
Approaches:- In-depth interviews (IDIs) with executives, product managers, and key decision-makers
- Focus groups among end users and early adopters
- Site visits and observational research for consumer products
- Informal field-level discussions for regional and cultural nuances
SECONDARY RESEARCH
This phase helps establish a macro-to-micro understanding of market trends, size, regulation, and competitive dynamics, sourced from credible and public domain information.
1. Quantitative Secondary Research
Objective: Model market value and segment-level forecasts based on published data.
Sources include:- Financial reports and investor summaries
- Government trade data, customs records, and regulatory statistics
- Industry association publications and economic databases
- Channel performance and pricing data from marketplace listings
- Revenue splits, pricing trends, and CAGR estimates
- Supply-side capacity and volume tracking
- Investment analysis and funding benchmarks
2. Qualitative Secondary Research
Objective: Capture strategic direction, innovation signals, and behavioral trends.
Sources include:- Company announcements, roadmaps, and product pipelines
- Publicly available whitepapers, conference abstracts, and academic research
- Regulatory body publications and policy briefs
- Social and media sentiment scanning for early-stage shifts
- Strategic shifts in market positioning
- Unmet needs and white spaces
- Regulatory triggers and compliance impact

DUAL MODELING: TOP-DOWN + BOTTOM-UP
To ensure robust market estimation, we apply two complementary sizing approaches:
Top-Down Modeling:- Start with broader industry value (e.g., global or regional TAM)
- Apply filters by segment, geography, end-user, or use case
- Adjust with primary insights and validation benchmarks
- Ideal for investor-grade market scans and opportunity mapping
- Aggregate from the ground up using sales volumes, pricing, and unit economics
- Use internal modeling templates aligned with stakeholder data
- Incorporate distributor-level or region-specific inputs
- Most accurate for emerging segments and granular sub-markets
DATA VALIDATION: IN-HOUSE REPOSITORY
We close the loop with proprietary data intelligence built from ongoing projects, industry monitoring, and historical benchmarking. This repository includes:
- Multi-sector market and pricing models
- Key trendlines from past interviews and forecasts
- Benchmarked adoption rates, churn patterns, and ROI indicators
- Industry-specific deviation flags and cross-check logic
- Catches inconsistencies early
- Aligns projections across studies
- Enables consistent, high-trust deliverables