
Marine Port Services Market Size and Forecast (2025–2033), Global and Regional Share, Trends, and Industry Analysis Report Coverage: By Service (Container Handling Services, Ship Repair and Maintenance Services, Supply-Chain and Logistics Solutions, Other Services), By Ownership and Governance (State-Owned Ports, PPP/Concession Ports, Private Greenfield Ports), and Geography
2026-02-02
Aerospace & Defense
Ekta Chaurasia (Team Lead)
Description
Marine Port
Services Market Overview
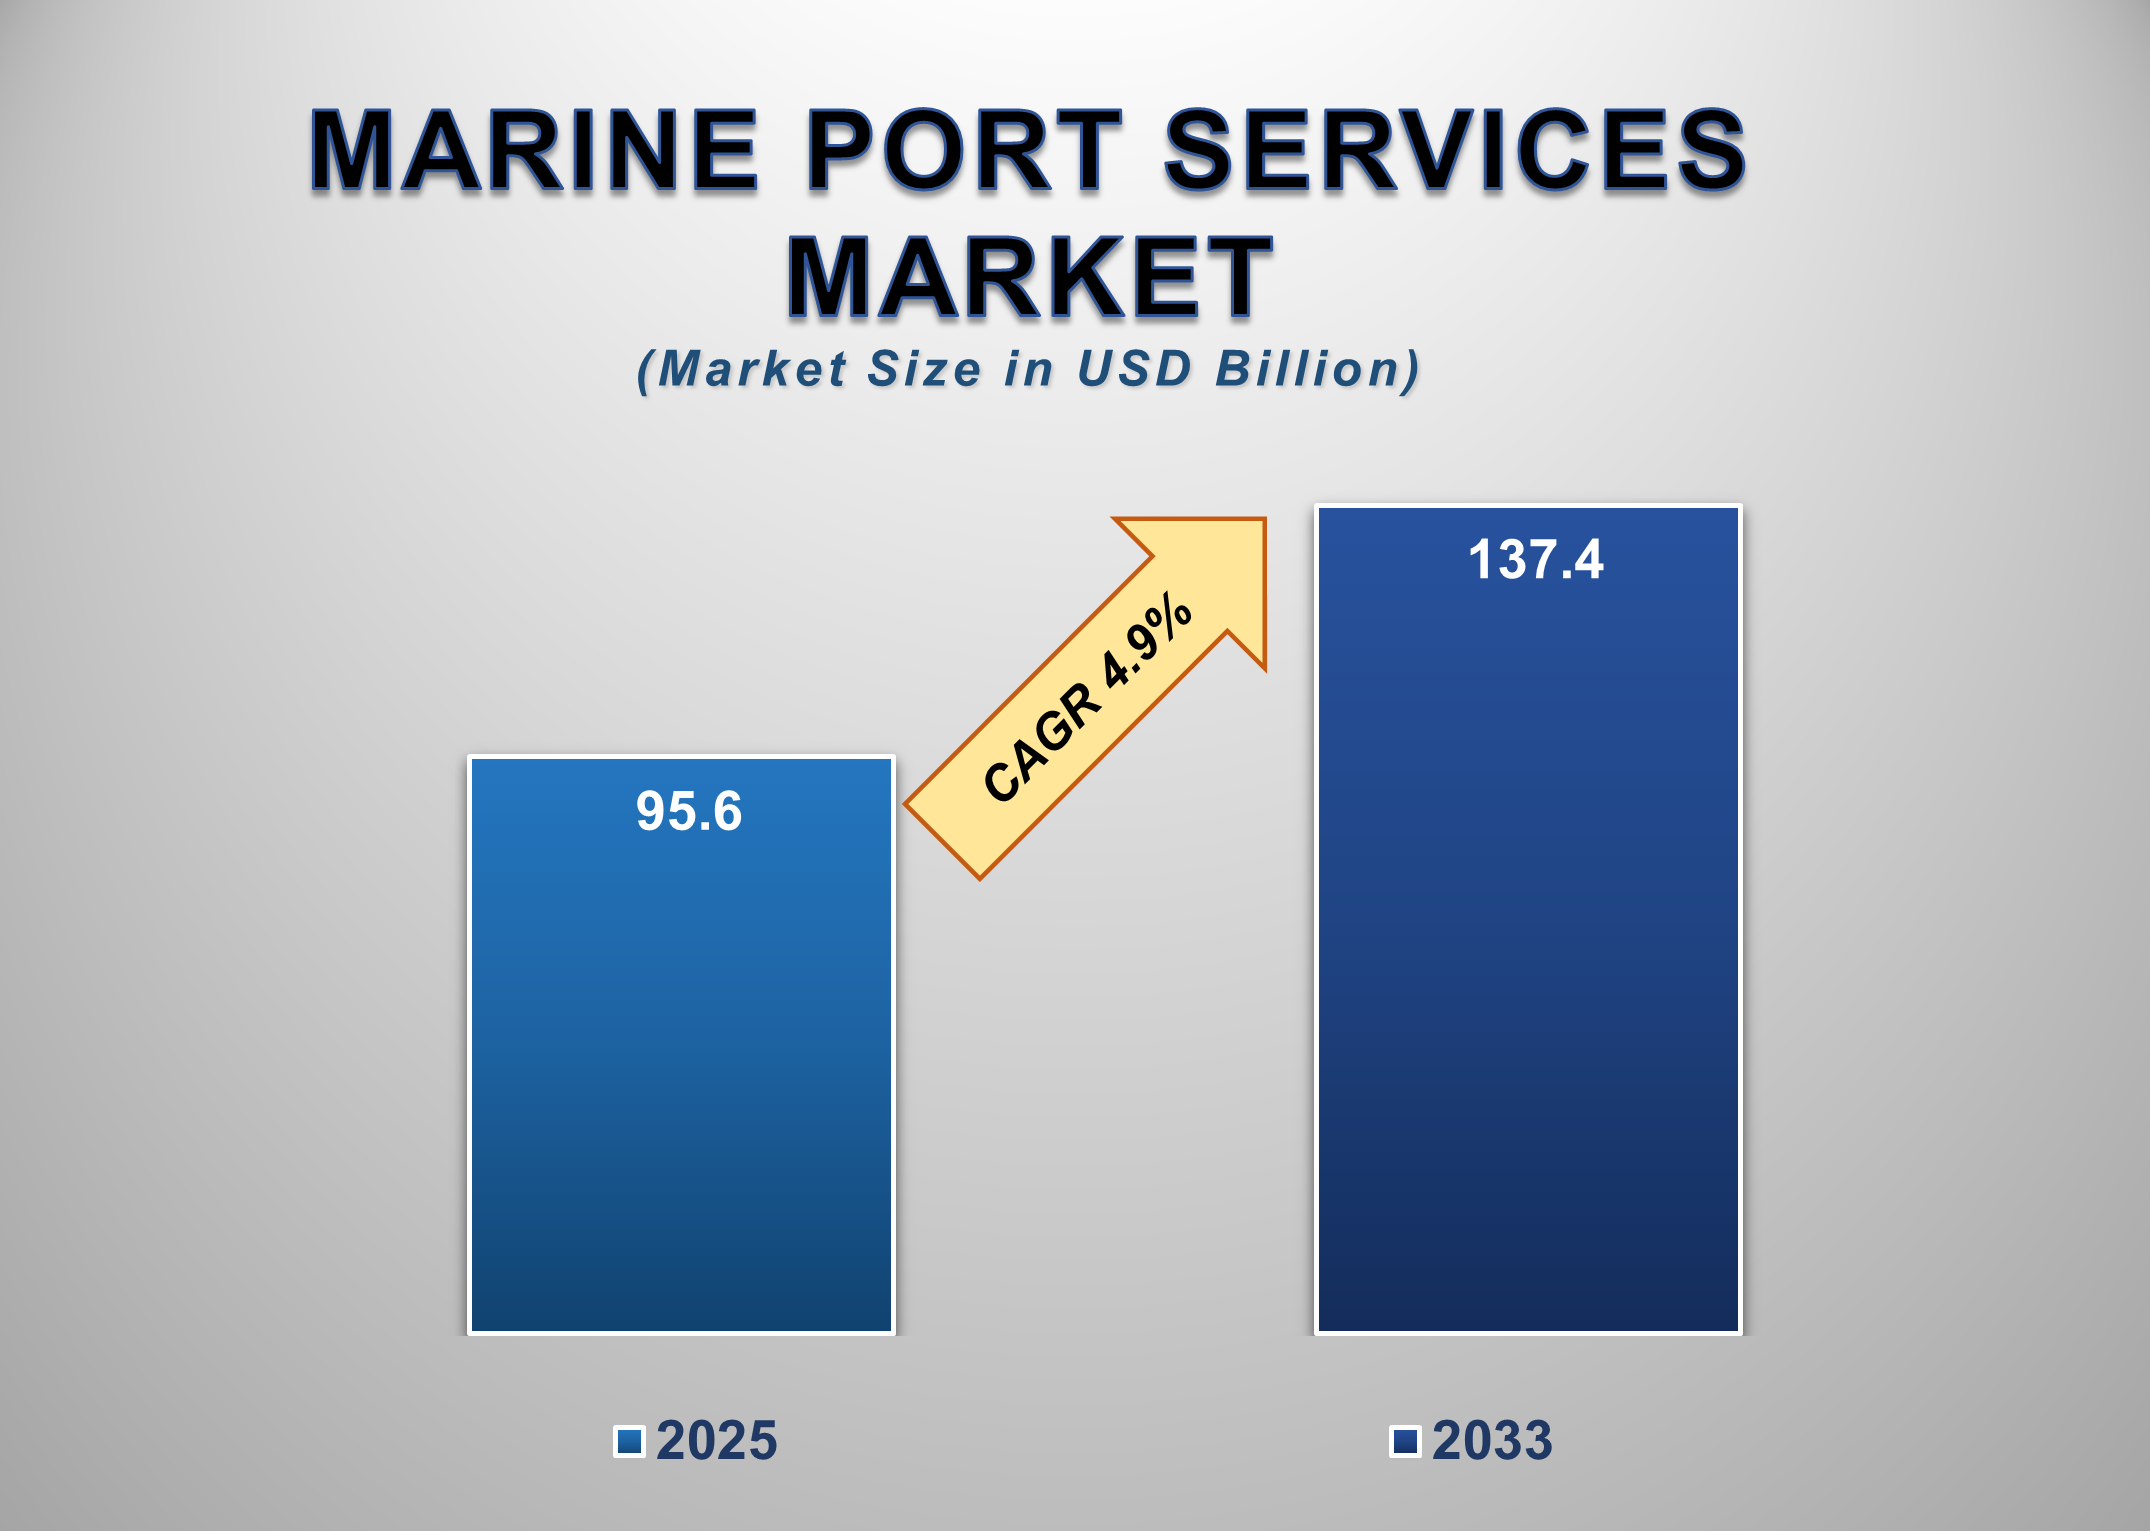
The global Marine Port Services Market plays a critical role in facilitating international trade, maritime transportation, and global supply chain connectivity. Valued at USD 95.6 billion in 2025, the market is projected to reach USD 137.4 billion by 2033, expanding at a CAGR of 4.9% during the forecast period. Marine port services encompass a wide range of operational activities, including container handling, vessel berthing, cargo storage, ship repair, logistics coordination, and intermodal connectivity.
The steady growth of global
seaborne trade, rising containerization, and expansion of manufacturing and
consumption hubs in emerging economies continue to support market expansion.
Ports are increasingly evolving from traditional cargo-handling centers into
integrated logistics and industrial ecosystems, offering value-added services
such as warehousing, cold storage, digital cargo tracking, and multimodal
transport integration. This shift is enabling ports to enhance throughput
efficiency and improve revenue diversification.
Marine Port Services Market Drivers and
Opportunities
Growth in Global Trade and Containerized Cargo Is
Driving Market Expansion
The
continued expansion of global trade volumes and containerized cargo movement is
a key driver of the Marine Port Services Market. Over 80% of global merchandise
trade by volume is transported via sea, making ports indispensable nodes in
international commerce. The increasing use of standardized containers has
improved cargo handling efficiency, reduced transit times, and enhanced supply
chain reliability, directly boosting demand for container handling services.
Rising consumption, urbanization, and industrialization in emerging economies
are increasing import and export activities, particularly in the Asia-Pacific, the Middle East, and parts of Africa.
Additionally, the growth of e-commerce and cross-border trade has intensified
demand for faster port turnaround times and higher handling capacity. Ports are
responding by expanding terminals, upgrading cranes, and improving yard
management systems to accommodate larger vessels and higher throughput.
Port Modernization, Automation, and
Digitalization are driving the growth of the Marine Port Services Market
Port
modernization and the adoption of automation and digital technologies are
significantly enhancing operational efficiency across marine port services.
Automated cranes, smart terminal operating systems, AI-driven traffic
management, and real-time cargo tracking solutions are reducing vessel
turnaround times and minimizing operational bottlenecks. These technologies
enable ports to handle higher cargo volumes without proportional increases in
labor or land use. Digital port platforms facilitate better coordination
between shipping lines, terminal operators, customs authorities, and logistics
providers. The use of blockchain, IoT sensors, and predictive analytics
improves transparency, reduces paperwork, and enhances security across port
operations. Many ports are also investing in green technologies such as shore
power systems and energy-efficient equipment to meet sustainability goals.
Opportunity for the
Marine Port Services Market
Integrated Logistics and Value-Added Services
Create Long-Term Growth Opportunities
The
growing integration of ports into broader logistics and supply chain ecosystems
presents a major opportunity for the Marine Port Services Market. Modern ports
are expanding beyond basic cargo handling to offer value-added services such as
bonded warehousing, cold chain logistics, cargo consolidation, distribution
centers, and inland container depots. This transformation enables ports to
capture additional revenue streams and strengthen customer retention. Strategic
development of port-centric logistics parks and free trade zones is attracting
manufacturers, distributors, and logistics providers to operate closer to port
facilities. This proximity reduces transportation costs, shortens delivery
timelines, and improves supply chain efficiency. Additionally, the growth of
specialized cargo such as refrigerated goods, chemicals, and project cargo is
increasing demand for tailored port services.
Marine Port Services
Market Scope
|
Report Attributes |
Description |
|
Market Size in 2025 |
USD 95.6 Billion |
|
Market Forecast in 2033 |
USD 137.4 Billion |
|
CAGR % 2025-2033 |
4.9% |
|
Base Year |
2024 |
|
Historic Data |
2020-2024 |
|
Forecast Period |
2025-2033 |
|
Report USP |
Production, Consumption,
Company Share, Company Heatmap, Company Production Capacity, Growth Factors,
and more |
|
Segments Covered |
●
By Service, By
Ownership and Governance |
|
Regional Scope |
●
North America ●
Europe ●
APAC ●
Latin America ●
Middle East and
Africa |
|
Country Scope |
1)
U.S. 2)
Canada 3)
Germany 4)
UK 5)
France 6)
Spain 7)
Italy 8)
Switzerland 9)
China 10)
Japan 11)
India 12)
Australia 13)
South Korea 14)
Brazil 15)
Mexico 16)
Argentina 17)
South Africa 18)
Saudi Arabia 19)
UAE |
Marine Port Services
Market Report Segmentation Analysis
The global Marine Port Services
market industry analysis is segmented by service type, ownership and governance
mode, and region.
The Container Handling Services Segment Accounted
for the Largest Market Share in the Global Marine Port Services Market
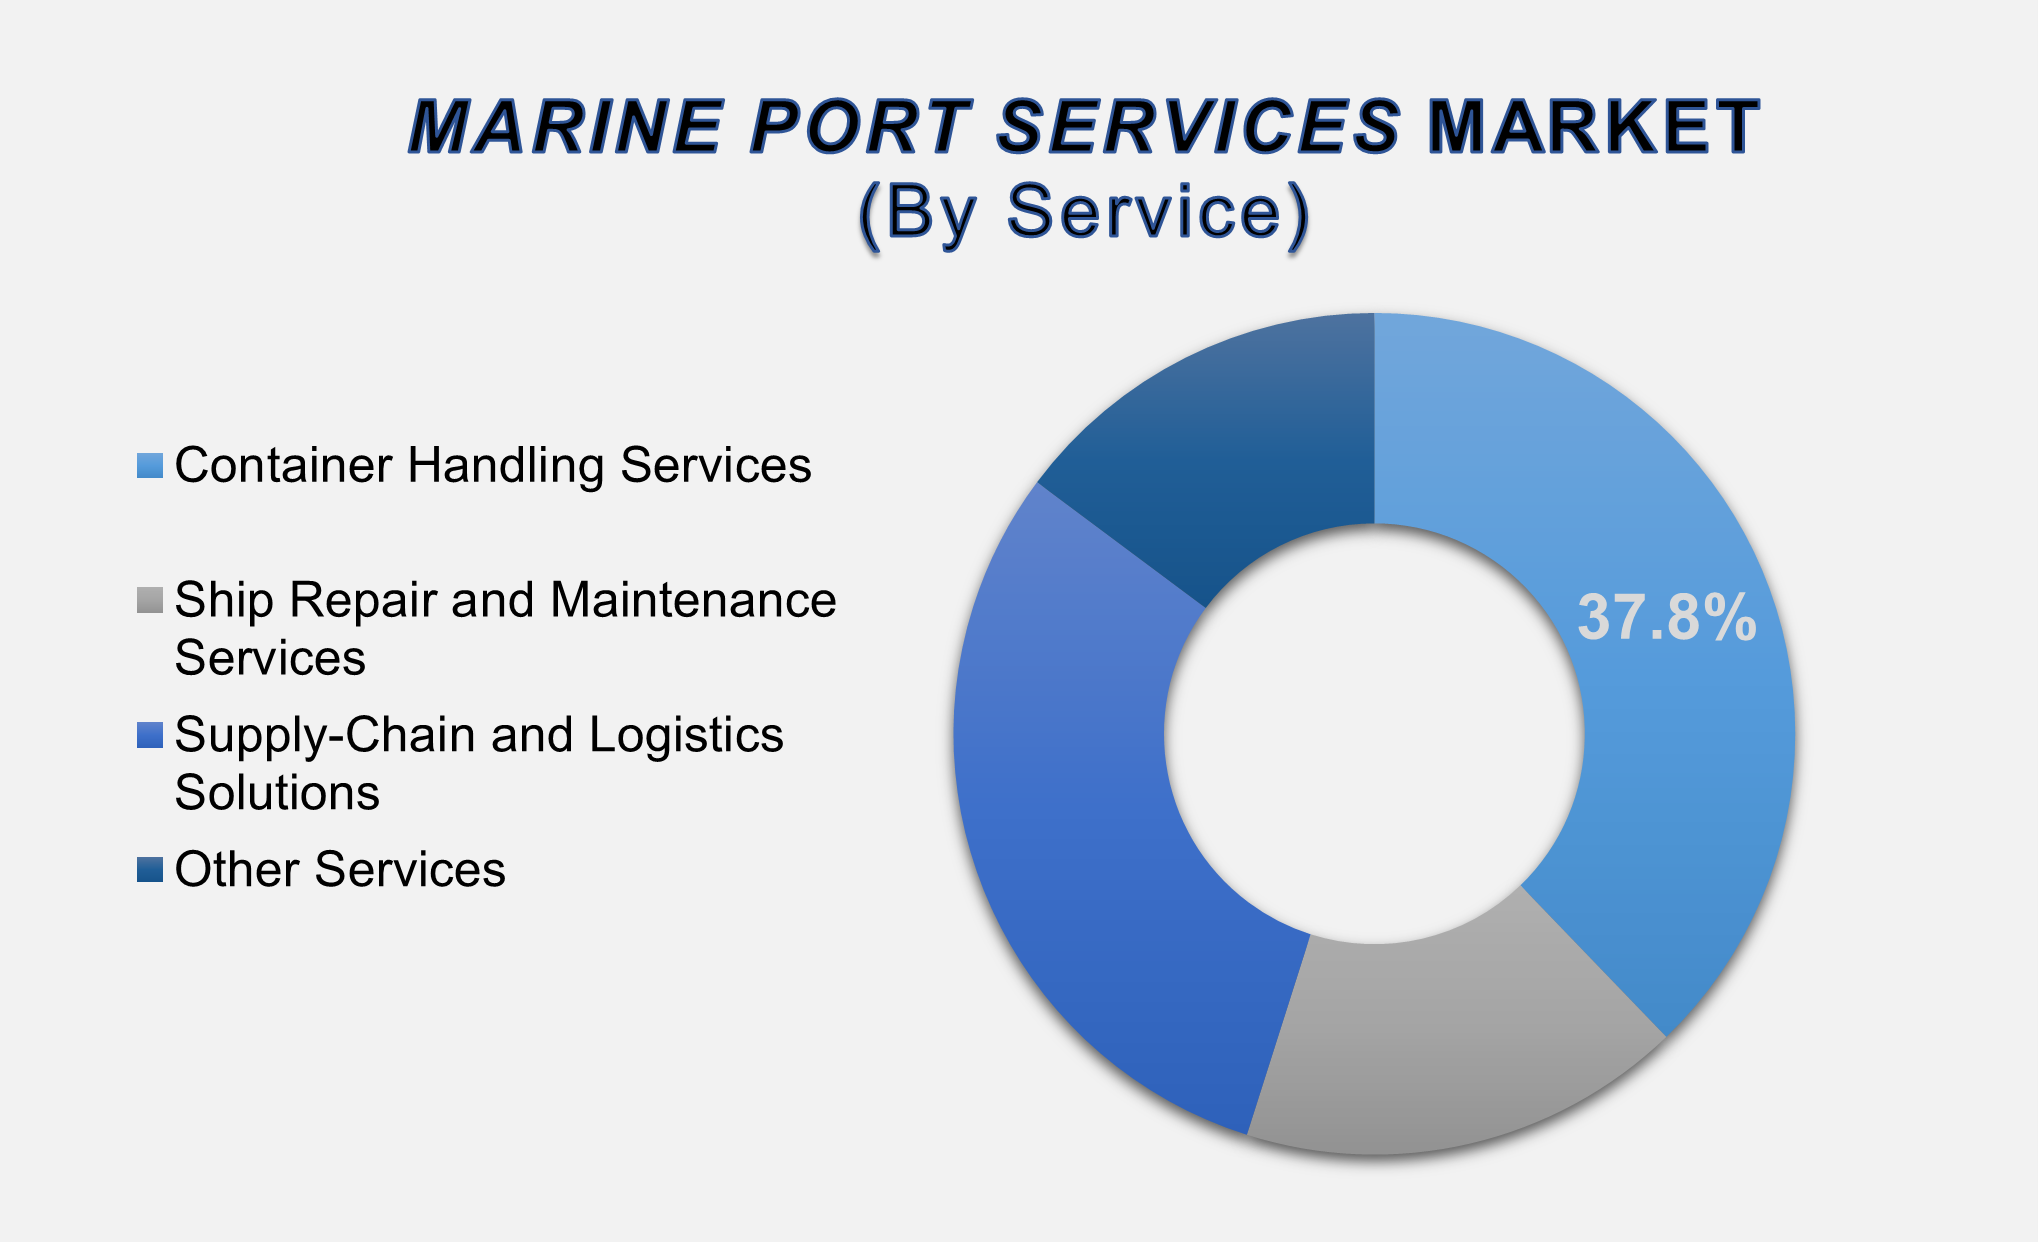
The container handling services segment accounted for the largest market share at 37.8%, driven by the continued dominance of containerized cargo in global maritime trade. Container handling includes loading, unloading, stacking, and transferring containers between ships, trucks, and rail systems, making it the core revenue-generating activity for most commercial ports. The increasing size of container vessels and higher cargo volumes per call have amplified the need for efficient handling infrastructure and skilled operations. Investments in ship-to-shore cranes, automated stacking systems, and yard optimization technologies are further strengthening this segment’s leadership. As container trade continues to grow, container handling services will remain the backbone of the marine port services market.
State-Owned Ports Lead Due to Strategic Trade and
Infrastructure Control
The
state-owned ports segment holds a significant share of the market, particularly
in Asia-Pacific, Europe, and parts of the Middle East. Governments often retain
ownership of key ports to ensure control over national trade routes, customs
operations, and strategic infrastructure assets. State-owned ports benefit from
long-term public investment, policy support, and integration with national
transportation networks. These ports typically handle large cargo volumes and
play a central role in national economic development. While private
participation is increasing, state-owned ports continue to dominate in terms of
cargo throughput and strategic importance.
Supply-Chain and Logistics Solutions Are Gaining
Momentum Across Major Ports
The
supply-chain and logistics solutions segment is witnessing strong growth as
ports expand their role beyond cargo handling. Services such as warehousing,
inland transportation coordination, cargo consolidation, and digital logistics
platforms are becoming increasingly important to shippers and freight
forwarders. Ports offering integrated logistics solutions enable customers to
streamline operations and reduce end-to-end supply chain costs. This trend is
particularly strong in mega ports and transshipment hubs that serve as regional
distribution centers. As global logistics complexity increases, demand for
port-based logistics services is expected to rise steadily.
The following segments are
part of an in-depth analysis of the global Marine Port Services Market:
|
Market
Segments |
|
|
By Service |
●
Container Handling
Services ●
Ship Repair and
Maintenance Services ●
Supply-Chain and
Logistics Solutions ●
Other Services |
|
By Ownership
and Governance |
●
State-Owned Ports ●
PPP / Concession
Ports ●
Private Greenfield
Ports |
Marine Port Services Market Share Analysis by
Region
The Asia Pacific region is projected to hold the
largest share of the global Marine Port Services market over the forecast
period.
Asia-Pacific dominates the global
Marine Port Services Market with a 39.8% share, supported by massive trade
volumes, extensive port infrastructure, and strong manufacturing and export
activity in China, India, Southeast Asia, and South Korea. Government-backed
port development programs and investments in mega ports further reinforce
regional leadership.
North America is expected to grow
at the fastest CAGR, driven by port modernization initiatives, increased
automation, and efforts to enhance supply chain resilience. Europe maintains a
strong presence through technologically advanced ports and high-value logistics
services, while the Middle East and Latin America continue to expand their
strategic port capacities.
Marine Port Services Market Competition Landscape
Analysis
The Marine
Port Services Market is highly competitive, with global terminal operators,
port authorities, and integrated logistics players competing on efficiency,
scale, and service diversification. Companies focus on terminal expansion,
automation, strategic partnerships, and geographic expansion to strengthen
their market positions.
Global Marine Port Services Market Recent
Developments News:
- In January 2025, DP World
signed Memorandums of Understanding (MoUs) worth USD 3 billion (INR 250
billion) with the Gujarat government for the development of maritime and
logistics infrastructure. The investment will fund multi-purpose
deep-draft ports, special economic zones (SEZs), and cargo terminals at
strategic locations across Gujarat.
- In October 2024, COSCO SHIPPING
Ports acquired stakes in two key terminals at Laem Chabang Port, Thailand, Thai Laemchabang Terminal (TLT) and
Hutchison Laemchabang Terminal (HLT), with
an investment of USD 110 million. The terminals have a combined potential
annual capacity of 6.7 million TEUs, significantly boosting Laem Chabang's
capacity as Thailand’s primary container gateway.
- In September 2023,
International Container Terminal Services, Inc. (ICTSI) launched the ICTSI
App, a secure operational tool providing real-time cargo visibility to
port users and cargo owners. The app, already with about 29,000 users,
tracks shipment status from vessel loading to port haulage and is being
expanded to other ICTSI port locations globally.
- In August 2023, HHLA PLT Italy,
the multi-purpose terminal of Hamburger Hafen und Logistik AG in Trieste,
welcomed Ocean Network Express (ONE) to its facility as part of the
Adriatic Israel Butterfly (AIB) service. This new call strengthens HHLA
PLT Italy’s connectivity and reinforces Trieste’s role as a key logistics
hub in the Adriatic region.
The Global Marine Port Services Market is
dominated by a few large companies, such as
●
DP World
●
APM Terminals
●
PSA International
●
COSCO Shipping Ports
●
Hutchison Ports
●
Dubai Ports World
●
International
Container Terminal Services
●
Shanghai International
Port Group
●
Terminal Investment
Limited
●
Port of Rotterdam
●
Port of Singapore
Authority
●
Port of Antwerp
●
Port of Hamburg
●
Port of Los Angeles
●
Maersk
●
Mediterranean Shipping
Company
●
CMA CGM
●
Yang Ming Marine
Transport
●
Hapag-Lloyd
●
Orient Overseas
Container Line
● Other Prominent Players
Frequently Asked Questions
Ekta Chaurasia (Team Lead)
Ekta Chaurasia is a highly experienced Team Lead at M2Square Consultancy with over 7 years of expertise in market research, strategic consulting, competitive benchmarking, and business intelligence solutions. She specializes in ICT, semiconductors & electronics, automotive & transportation, and industrial machinery markets.
She leads end-to-end global research projects focused on market trends, industry analysis, growth forecasting, customer insights, and strategic decision-making. Known for her analytical leadership and industry expertise, Ekta helps businesses uncover growth opportunities, evaluate competitive landscapes, and stay ahead in rapidly evolving markets through accurate and insight-driven research.
1. Global Marine Port
Services Market Introduction and Market Overview
1.1.
Objectives
of the Study
1.2.
Global
Marine Port Services Market Scope and Market Estimation
1.2.1.Global Marine Port
Services Overall Market Size (US$ Bn), Market CAGR (%), Market forecast (2025 -
2033)
1.2.2.Global Marine Port
Services Market Revenue Share (%) and Growth Rate (Y-o-Y) from 2020 - 2033
1.3.
Market
Segmentation
1.3.1.Service of Global Marine
Port Services Market
1.3.2.Ownership and Governance of
Global Marine Port Services Market
1.3.3.Region of Global Marine
Port Services Market
2. Executive
Summary
2.1.
Demand
Side Trends
2.2.
Key
Market Trends
2.3.
Market
Demand (US$ Bn) Analysis 2020 – 2024 and Forecast, 2025 – 2033
2.4.
Demand
and Opportunity Assessment
2.5.
Demand
Supply Scenario
2.6.
Market
Dynamics
2.6.1.Drivers
2.6.2.Limitations
2.6.3.Opportunities
2.6.4.Impact Analysis of Drivers
and Restraints
2.7.
Emerging
Trends for Marine Port Services Market
2.8.
Porter’s
Five Forces Analysis
2.9.
PEST
Analysis
2.10.
Key
Regulation
3. Global
Marine Port Services Market Estimates
& Historical Trend Analysis (2020 - 2024)
4. Global
Marine Port Services Market Estimates
& Forecast Trend Analysis, by Service
4.1.
Global
Marine Port Services Market Revenue (US$ Bn) Estimates and Forecasts, by Service,
2020 - 2033
4.1.1.Container Handling
Services
4.1.2.Ship Repair and
Maintenance Services
4.1.3.Supply-Chain and Logistics
Solutions
4.1.4.Other Services
5. Global
Marine Port Services Market Estimates
& Forecast Trend Analysis, by Ownership and
Governance
5.1.
Global
Marine Port Services Market Revenue (US$ Bn) Estimates and Forecasts, by Ownership
and Governance, 2020 - 2033
5.1.1.State-Owned Ports
5.1.2.PPP / Concession Ports
5.1.3.Private Greenfield Ports
6. Global
Marine Port Services Market Estimates
& Forecast Trend Analysis, by Region
6.1.
Global
Marine Port Services Market Revenue (US$ Bn) Estimates and Forecasts, by Region,
2020 - 2033
6.1.1.North America
6.1.2.Europe
6.1.3.Asia Pacific
6.1.4.Middle East & Africa
6.1.5.Latin America
7. North America Marine
Port Services Market: Estimates &
Forecast Trend Analysis
7.1.
North
America Marine Port Services Market Assessments & Key Findings
7.1.1.North America Marine Port
Services Market Introduction
7.1.2.North America Marine Port
Services Market Size Estimates and Forecast (US$ Billion) (2020 - 2033)
7.1.2.1. By Service
7.1.2.2. By Ownership
and Governance
7.1.2.3.
By
Country
7.1.2.3.1. The U.S.
7.1.2.3.2. Canada
8. Europe Marine
Port Services Market: Estimates &
Forecast Trend Analysis
8.1.
Europe
Marine Port Services Market Assessments & Key Findings
8.1.1.Europe Marine Port
Services Market Introduction
8.1.2.Europe Marine Port
Services Market Size Estimates and Forecast (US$ Billion) (2020 - 2033)
8.1.2.1. By Service
8.1.2.2. By Ownership
and Governance
8.1.2.3.
By
Country
8.1.2.3.1.
Germany
8.1.2.3.2.
Italy
8.1.2.3.3.
U.K.
8.1.2.3.4.
France
8.1.2.3.5.
Spain
8.1.2.3.6.
Switzerland
8.1.2.3.7. Rest
of Europe
9. Asia Pacific Marine
Port Services Market: Estimates &
Forecast Trend Analysis
9.1.
Asia
Pacific Market Assessments & Key Findings
9.1.1.Asia Pacific Marine Port
Services Market Introduction
9.1.2.Asia Pacific Marine Port
Services Market Size Estimates and Forecast (US$ Billion) (2020 - 2033)
9.1.2.1. By Service
9.1.2.2. By Ownership
and Governance
9.1.2.3.
By
Country
9.1.2.3.1.
China
9.1.2.3.2.
Japan
9.1.2.3.3.
India
9.1.2.3.4.
Australia
9.1.2.3.5.
South
Korea
9.1.2.3.6. Rest of Asia Pacific
10. Middle East & Africa Marine
Port Services Market: Estimates &
Forecast Trend Analysis
10.1.
Middle
East & Africa Market Assessments & Key Findings
10.1.1.
Middle East & Africa Marine Port Services Market
Introduction
10.1.2.
Middle East & Africa Marine Port Services Market Size Estimates
and Forecast (US$ Billion) (2020 - 2033)
10.1.2.1. By Service
10.1.2.2. By Ownership
and Governance
10.1.2.3.
By
Country
10.1.2.3.1. UAE
10.1.2.3.2. Saudi
Arabia
10.1.2.3.3. South
Africa
10.1.2.3.4. Rest
of MEA
11. Latin America
Marine Port Services Market: Estimates
& Forecast Trend Analysis
11.1.
Latin
America Market Assessments & Key Findings
11.1.1.
Latin
America Marine Port Services Market Introduction
11.1.2.
Latin
America Marine Port Services Market Size Estimates and Forecast (US$ Billion) (2020
- 2033)
11.1.2.1. By Service
11.1.2.2. By Ownership
and Governance
11.1.2.3.
By
Country
11.1.2.3.1. Brazil
11.1.2.3.2. Argentina
11.1.2.3.3. Mexico
11.1.2.3.4. Rest
of LATAM
12. Country Wise Market:
Introduction
13.
Competition
Landscape
13.1.
Global
Marine Port Services Market Product Mapping
13.2.
Global
Marine Port Services Market Concentration Analysis, by Leading Players /
Innovators / Emerging Players / New Entrants
13.3.
Global
Marine Port Services Market Tier Structure Analysis
13.4.
Global
Marine Port Services Market Concentration & Company Market Shares (%)
Analysis, 2024
14.
Company
Profiles
14.1.
DP World
14.1.1.
Company
Overview & Key Stats
14.1.2.
Financial
Performance & KPIs
14.1.3.
Product
Portfolio
14.1.4.
SWOT
Analysis
14.1.5.
Business
Strategy & Recent Developments
* Similar details would be provided for all the players
mentioned below
14.2. APM
Terminals
14.3. PSA
International
14.4. COSCO
Shipping Ports
14.5. Hutchison
Ports
14.6. Dubai
Ports World
14.7. International
Container Terminal Services
14.8. Shanghai
International Port Group
14.9. Terminal
Investment Limited
14.10. Port of
Rotterdam
14.11. Port of
Singapore Authority
14.12. Port of
Antwerp
14.13. Port of
Hamburg
14.14. Port of
Los Angeles
14.15. Maersk
14.16. Mediterranean
Shipping Company
14.17. CMA CGM
14.18. Yang
Ming Marine Transport
14.19. Hapag-Lloyd
14.20. Orient
Overseas Container Line
14.21. Others
15. Research
Methodology
15.1.
External
Transportations / Databases
15.2.
Internal
Proprietary Database
15.3.
Primary
Research
15.4.
Secondary
Research
15.5.
Assumptions
15.6.
Limitations
15.7.
Report
FAQs
16. Research
Findings & Conclusion
Our Research Methodology
"Insight without rigor is just noise."
We follow a comprehensive, multi-phase research framework designed to deliver accurate, strategic, and decision-ready intelligence. Our process integrates primary and secondary research , both quantitative and qualitative , along with dual modeling techniques ( top-down and bottom-up) and a final layer of validation through our proprietary in-house repository.
PRIMARY RESEARCH
Primary research captures real-time, firsthand insights from the market to understand behaviors, motivations, and emerging trends.
1. Quantitative Primary Research
Objective: Generate statistically significant data directly from market participants.
Approaches:- Structured surveys with customers, distributors, and field agents
- Mobile-based data collection for point-of-sale audits and usage behavior
- Phone-based interviews (CATI) for market sizing and product feedback
- Online polling around industry events and digital campaigns
- Purchase frequency by customer type
- Channel performance across geographies
- Feature demand by application or demographic
2. Qualitative Primary Research
Objective: Explore decision-making drivers, pain points, and market readiness.
Approaches:- In-depth interviews (IDIs) with executives, product managers, and key decision-makers
- Focus groups among end users and early adopters
- Site visits and observational research for consumer products
- Informal field-level discussions for regional and cultural nuances
SECONDARY RESEARCH
This phase helps establish a macro-to-micro understanding of market trends, size, regulation, and competitive dynamics, sourced from credible and public domain information.
1. Quantitative Secondary Research
Objective: Model market value and segment-level forecasts based on published data.
Sources include:- Financial reports and investor summaries
- Government trade data, customs records, and regulatory statistics
- Industry association publications and economic databases
- Channel performance and pricing data from marketplace listings
- Revenue splits, pricing trends, and CAGR estimates
- Supply-side capacity and volume tracking
- Investment analysis and funding benchmarks
2. Qualitative Secondary Research
Objective: Capture strategic direction, innovation signals, and behavioral trends.
Sources include:- Company announcements, roadmaps, and product pipelines
- Publicly available whitepapers, conference abstracts, and academic research
- Regulatory body publications and policy briefs
- Social and media sentiment scanning for early-stage shifts
- Strategic shifts in market positioning
- Unmet needs and white spaces
- Regulatory triggers and compliance impact

DUAL MODELING: TOP-DOWN + BOTTOM-UP
To ensure robust market estimation, we apply two complementary sizing approaches:
Top-Down Modeling:- Start with broader industry value (e.g., global or regional TAM)
- Apply filters by segment, geography, end-user, or use case
- Adjust with primary insights and validation benchmarks
- Ideal for investor-grade market scans and opportunity mapping
- Aggregate from the ground up using sales volumes, pricing, and unit economics
- Use internal modeling templates aligned with stakeholder data
- Incorporate distributor-level or region-specific inputs
- Most accurate for emerging segments and granular sub-markets
DATA VALIDATION: IN-HOUSE REPOSITORY
We close the loop with proprietary data intelligence built from ongoing projects, industry monitoring, and historical benchmarking. This repository includes:
- Multi-sector market and pricing models
- Key trendlines from past interviews and forecasts
- Benchmarked adoption rates, churn patterns, and ROI indicators
- Industry-specific deviation flags and cross-check logic
- Catches inconsistencies early
- Aligns projections across studies
- Enables consistent, high-trust deliverables