

Global Polyurethane (PU) Components Market Size and Forecast (2026–2034), Global and Regional Growth, Trend, Share and Industry Analysis Report Coverage; By Product Type (Residential, Commercial, Industrial, Agricultural, Infrastructure); By End User Industry (Marine, Offshore Oil & Gas, Building & Construction (Real Estate), Mining, Automotive, Others); and Geography
2026-10-23
Chemicals & Materials
Aishwarya Panbude (Research Analyst)
Description
The Polyurethane (PU) Components
Market revenue was 42,753.3 million
USD in 2025 and will reach 72,779.7 million
USD in 2034, with a CAGR of 6.2% during 2026-2034.
Polyurethane (PU) Components Market Introduction
The global polyurethane (PU) components market refers to the industry involved in the design, manufacturing, processing, and supply of finished polyurethane-based components that are used across a broad range of end-use industries. These components are manufactured using polyurethane materials, including rigid polyurethane foam, flexible polyurethane foam, polyurethane elastomers, integral skin polyurethane, microcellular polyurethane, reaction injection molded (RIM) polyurethane, and cast polyurethane systems. They are engineered to deliver superior abrasion resistance, impact strength, flexibility, thermal insulation, chemical resistance, vibration damping, corrosion resistance, and durability
Polyurethane (PU) Components Market Size & Highlights
·
The global polyurethane (PU) components market reached USD 42,753.3
Million in 2025.
·
The market is expected to reach USD 72,779.7 Million by 2034.
·
The polyurethane (PU) components industry is anticipated to
expand at a CAGR of 6.2% from 2026 to 2034.
· Top companies in the
market include Trelleborg Group, Woodbridge, RAMPF
Group, Freudenberg Group, Lear Corporation, and Adient plc.
·
Asia Pacific dominated the global polyurethane (PU) components market
in 2025.
|
Attribute |
Detail |
|
Market
Drivers |
·
Expansion
of Marine, Port, Offshore and Heavy-Duty Industrial Infrastructure ·
Increasing
Mining Activity and Declining Ore Grades Driving Demand for PU Wear
Components |
|
Market Opportunity |
·
Growing Adoption of Bio-Based, Recycled and Circular
Polyurethane Components ·
Growing Demand for Customized, High-Performance PU Components
in Oil & Gas, Energy and Process Industries |
Increasing Mining Activity and Declining Ore Grades Driving
Demand for PU Wear Components
The expansion of mining
and mineral-processing activity is creating a structurally strong demand
environment for PU elastomer wear components because mining equipment operates
under some of the most severe abrasion, impact, vibration and material-handling
conditions. The global energy transition is increasing demand for copper,
lithium, nickel, graphite and other critical minerals used in electric
vehicles, batteries, renewable-energy systems, power grids and other
technologies. The International Energy Agency (IEA) projects that, under its
Stated Policies Scenario, global copper demand will increase from approximately
26.7 million tonnes in 2024 to 34.1 million tonnes by 2040, an increase of
around 28%. Cleantech-related copper demand alone is projected to rise from
approximately 7.7 million tonnes in 2024 to 12.2 million tonnes by 2040. The
IEA also estimates that announced mining projects could leave copper with a
potential 30% supply shortfall by 2035, driven partly by declining ore grades,
rising project costs and limited new discoveries. These conditions are
encouraging mining companies to expand existing operations, develop new
deposits and increase processing efficiency.
Declining ore grades are
particularly relevant to PU component demand because lower-grade ores require
larger quantities of material to be mined, transported and processed to obtain
the same quantity of saleable mineral. This increases throughput requirements
across crushers, screens, feeders, conveyors, chutes, hydrocyclones, pumps and
other mineral-processing equipment. Higher material throughput increases
exposure of equipment surfaces to abrasive particles, impact and slurry,
accelerating wear and increasing replacement frequency. PU elastomers are well
suited to selected wear applications because they can provide high abrasion
resistance, impact resilience, elasticity and resistance to corrosion and
moisture. Consequently, increasing ore throughput can translate into higher
consumption of PU liners, screen components, wear pads, scraper blades,
hydrocyclone components, seals, rollers and other engineered wear parts.
The demand opportunity
extends across multiple minerals rather than being limited to copper. The IEA
expects strong long-term growth in demand for lithium, nickel, graphite and
other energy-transition minerals. Under the STEPS scenario, lithium demand is
projected to increase from approximately 205 kt in 2024 to 928 kt in 2040,
while nickel demand increases from approximately 3.37 million tonnes to 5.69
million tonnes over the same period. Expansion of mines and mineral-processing
facilities therefore creates a broad application base for PU components across
crushing, screening, classification, slurry handling, conveying and
material-transfer systems.
India provides a
particularly strong example of this demand mechanism because of the country's
large and expanding mining industry. India's raw coal production increased from
approximately 997.8 million tonnes in FY2023-24 to 1,047.5 million tonnes in FY2024-25,
representing approximately 5.0% growth. The Ministry of Coal has also indicated
an objective of increasing domestic coal production to approximately 1.5
billion tonnes by 2029-30, supported by new projects, expansion of existing
mines, commercial mining and increased deployment of mass-production
technologies. Increasing production and mechanization increase operating hours
for conveyors, crushers, screens, feeders, loaders and other equipment,
supporting recurring demand for wear and replacement components.
The aftermarket nature of
mining wear components further strengthens the attractiveness of the segment.
PU liners, screen panels, seals, wear pads, rollers and other components are
consumable or replacement parts whose service life is determined by operating
conditions rather than by the capital cycle of the complete mining machine.
Even when mining companies reduce purchases of new equipment, existing mines
continue to consume replacement wear components as long as production
continues. This creates a recurring revenue opportunity for PU component
manufacturers and can provide greater demand resilience than applications that
depend entirely on new equipment sales.
Mining operators are also
increasingly focusing on total cost of ownership rather than simply minimizing
the initial purchase price of components. A component with higher initial cost
can be commercially attractive when it extends service intervals, reduces
maintenance labor, lowers unplanned downtime and improves equipment
availability. This favors engineered PU components where their wear performance
provides measurable operating benefits. Suppliers that can customize hardness,
geometry, formulation and reinforcement according to the operating conditions
of individual mines can therefore capture higher-value applications than
suppliers competing only on standardized replacement parts.
Thus, rising
critical-mineral demand, expansion of mineral-processing capacity, declining
ore grades, increasing material throughput and recurring aftermarket
replacement requirements make mining one of the strongest application drivers
for PU elastomer components.
Growing Adoption of
Bio-Based, Recycled and Circular Polyurethane Components Is Creating New Growth
Opportunities
Increasing environmental
awareness and corporate carbon-reduction commitments are encouraging
manufacturers across automotive, industrial, construction, marine, consumer,
and other industries to reduce the environmental footprint of polyurethane
products. This is creating an opportunity for PU component manufacturers to
develop bio-based, recycled-content, and circular polyurethane components that
maintain the mechanical and durability characteristics required in demanding
applications. The transition is particularly relevant to finished PU components
because customers are increasingly evaluating not only component performance
but also the material's origin, recycled content, carbon footprint, and
end-of-life characteristics.
Bio-based polyols derived
from renewable sources such as soybean oil, castor oil, rapeseed oil, tall oil,
and other biomass-based feedstocks are being incorporated into polyurethane
formulations. Depending on the application and formulation, these materials can
partially replace conventional fossil-based inputs while maintaining required
properties. For finished components, this creates possibilities for
lower-carbon PU wheels, rollers, bushings, seals, wear pads, damping
components, liners, and other engineered parts without necessarily changing the
fundamental component geometry or manufacturing process.
Recycled polyurethane
feedstocks are also creating new possibilities for component manufacturers.
Mechanical recycling, chemical recycling, glycolysis, hydrolysis, and other
recovery processes can convert selected PU waste streams into materials that
can be incorporated into new polyurethane formulations. Chemical recycling is
particularly relevant for polyurethane because it can recover useful chemical
building blocks from waste that may be difficult to recycle through
conventional mechanical methods. As recycling technologies improve,
manufacturers can increasingly incorporate recovered materials into new PU
products while maintaining application-specific performance requirements.
Automotive is an important
sector for this transition because manufacturers are under increasing pressure
to reduce the environmental footprint of vehicles and their supply chains. PU
seat foam, automotive interiors, damping materials, seals, protective components,
and other PU products can potentially incorporate recycled or renewable
feedstocks. Similar requirements are emerging in industrial and construction
applications as large customers introduce sustainability criteria into supplier
selection and procurement processes.
Major polyurethane
manufacturers are already commercializing solutions incorporating renewable and
recycled feedstocks. BASF, Covestro, Dow, Huntsman and other chemical companies
have developed circular or partially bio-based polyurethane solutions for applications
including automotive, footwear, furniture, construction and industrial
products. BASF, for example, introduced its Loop portfolio incorporating
recycled-content polyurethane solutions, while Covestro has been developing
chemical recycling and alternative-feedstock technologies for polyurethane
materials. These developments are gradually expanding the range of sustainable
PU materials available to downstream component manufacturers.
India is also developing
capabilities in polyurethane recycling and circular-material technologies. In
2025, CSIR-NCL and Covestro India entered into a collaboration focused on
sustainable polyurethane upcycling, including chemical approaches for recovering
value from PU waste. This type of technology development can improve the
long-term availability of recycled feedstocks for Indian PU manufacturers and
component producers.
For finished-component
manufacturers, sustainability can become a product differentiation and
premiumization opportunity. A supplier capable of offering a conventional PU
component alongside a certified recycled-content or bio-based alternative can
address customers with different sustainability requirements while maintaining
the same basic component functionality. This can help manufacturers expand
relationships with multinational OEMs and industrial customers that have
established carbon-reduction targets throughout their supply chains.
Manufacturers with access
to reliable renewable or recycled feedstocks, formulation expertise, testing
capabilities, traceability systems, and carbon-footprint documentation can
establish stronger differentiation in the global PU components market.
Segment Outlook of Global Polyurethane (PU) Components Market
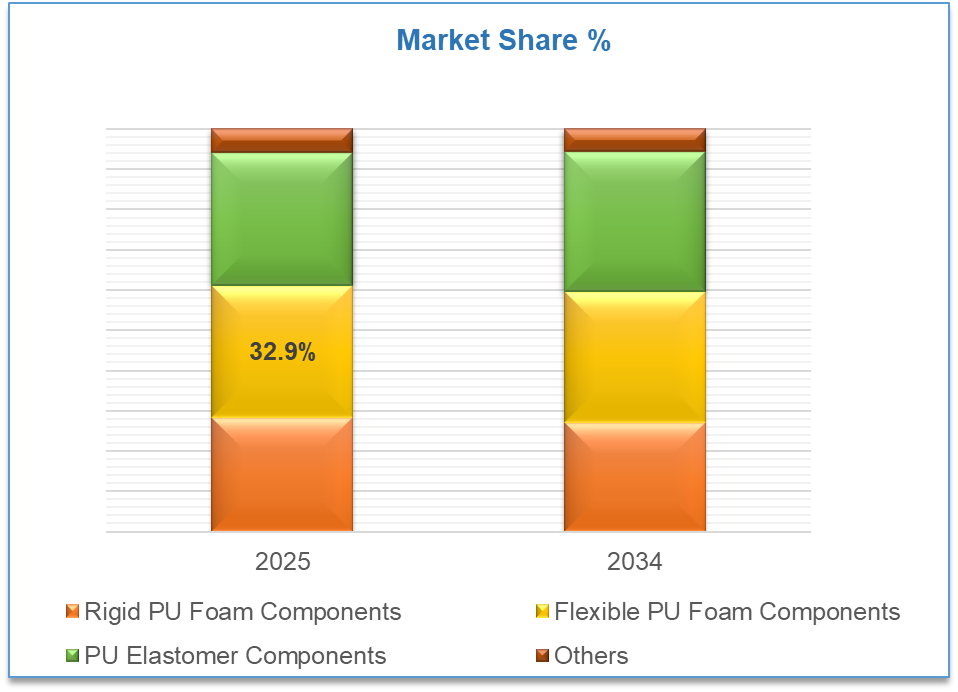
The global polyurethane (PU) components market is segmented by product type
into Rigid PU Foam Components, Flexible PU Foam Components, PU Elastomer
Components, and Others, with each category addressing distinct performance and
application requirements across construction, automotive, furniture and
bedding, appliances, refrigeration, industrial machinery, footwear,
electronics, and other end-use industries. Among these product types, flexible
PU foam and rigid PU foam components collectively account for a significant
share of overall market demand, supported by their extensive use in cushioning,
insulation, comfort, lightweighting, and energy-efficiency applications.
Further, energy-efficiency
requirements, lightweighting, industrial automation, vehicle production,
construction activity, and increasing demand for durable engineered materials
are among the key factors supporting product-type growth. Rigid PU foam benefits
strongly from stricter building-energy-performance standards and the expansion
of cold storage, refrigeration, and temperature-controlled logistics
infrastructure. Flexible PU foam demand is influenced by furniture and bedding
replacement cycles, automotive production, urbanization, premium comfort
products, and the increasing use of lightweight materials in vehicle interiors.
PU elastomers are benefiting from industrial customers' focus on extending
equipment service life, reducing maintenance costs, and improving operational
efficiency. Meanwhile, specialty PU components are gaining opportunities as
manufacturers increasingly seek customized materials capable of combining
multiple functional properties within a single component.
Regional Outlook of Global Polyurethane (PU) Components Market
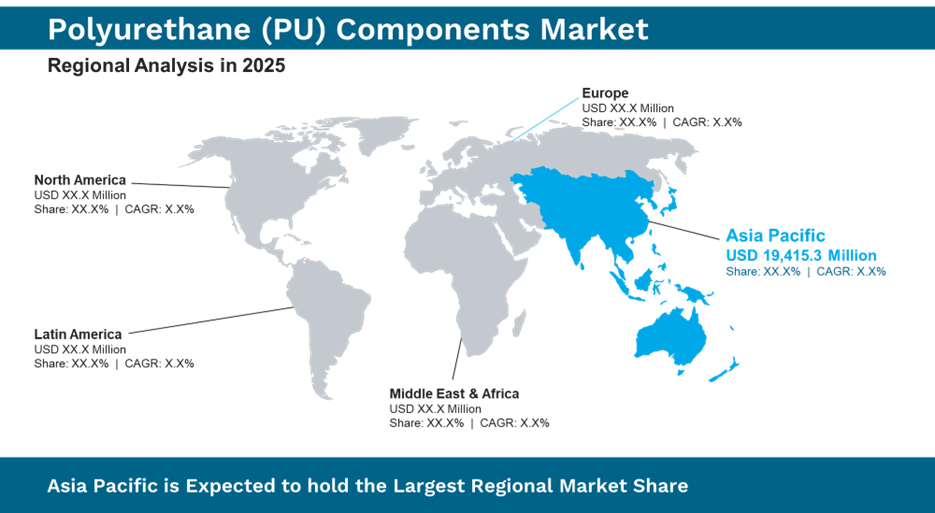
The global polyurethane
(PU) components market can be analyzed across North America, Europe,
Asia-Pacific, Latin America, and the Middle East & Africa (MEA). The North
America PU Components Market is supported by a diversified manufacturing base
spanning automotive, construction, industrial machinery, mining, aerospace,
electronics, healthcare, and logistics, with demand increasingly shifting
toward engineered polyurethane components rather than purely commodity
products. The automotive sector remains a major demand center for flexible PU
foam, molded seating components, acoustic materials, seals, gaskets, and
elastomer parts, while continued vehicle electrification is creating additional
requirements for lightweight, vibration-control, sealing, thermal-management,
and battery-related components. In construction, demand is supported by
building-energy-efficiency requirements and the need for high-performance
insulation, particularly rigid PU/PIR products used in commercial buildings,
cold-storage facilities, warehouses, and industrial structures. The U.S. Department of Energy identifies
building energy efficiency as an important policy priority, while continued
investment in domestic manufacturing and infrastructure is supporting
industrial demand for PU components. The region's data-center and AI
infrastructure expansion is another emerging demand driver, creating
opportunities for PU/PIR insulation, seals, gaskets, vibration-control
components, and specialty materials used in cooling and building-envelope applications.
Meanwhile, mining activity in the U.S. and Canada supports demand for
abrasion-resistant PU liners, screens, rollers, seals, and other wear
components. On the supply side, North America benefits from established
chemical producers and component manufacturers, but producers remain exposed to
fluctuations in MDI, TDI, polyol, energy and logistics costs. Domestic
manufacturing investment and supply-chain regionalization are encouraging
customers to source closer to production facilities, supporting local and
nearshore PU component suppliers.
However, relatively high
labor, energy, compliance and operating costs compared with some Asian
manufacturing locations can place pressure on commodity-component margins.
Regulatory requirements concerning worker exposure to diisocyanates, VOCs,
chemical handling, fire performance and sustainability are also increasing
compliance costs but simultaneously encourage demand for safer,
higher-performance and lower-emission formulations. Overall, North America is
evolving toward a high-value, application-engineered PU components market,
where customization, durability, regulatory compliance, domestic supply
reliability and total cost of ownership increasingly influence purchasing
decisions alongside unit price.
Analysis of Key Players in Global Polyurethane (PU) Components
Market
Chemical manufacturers,
producers of polyurethane components, and specialist suppliers processing PU
elastomers, flexible and rigid foam components, coatings, adhesives, sealants,
and molded products are all part of the competitive environment of the global
Polyurethane (PU) Components Market. The competition is propelled by the need
for competitive solutions in automotive, construction, furniture, industrial
equipment, and consumer goods segments. The main differentiating factors
include product performance, durability, level of customization, capability for
raw materials sourcing, effectiveness of manufacturing processes, price, etc.
Competitive Analysis by Product
Type
|
Solution Category |
Major Players |
Basis of Competition |
|
Industrial and
Engineered PU Components |
Trelleborg AB,
Freudenberg Group, Hutchinson SA |
Component durability,
wear and abrasion resistance, sealing performance, customization, and
reliability in demanding industrial applications. |
|
PU Systems, Formulations and Molded Components |
RAMPF Group |
Formulation
expertise, molded component design, application-specific engineering,
processing capabilities, and product performance. |
|
PU Insulation and
Building Components |
Kingspan Group,
Recticel, ArcelorMittal Construction |
Thermal insulation
performance, energy efficiency, fire safety, product quality, regulatory
compliance, and cost competitiveness. |
|
Automotive PU Components |
Woodbridge
Group, Adient plc, Lear Corporation, Hutchinson SA |
Lightweighting,
seating comfort, acoustic performance, durability, design flexibility, OEM
relationships, and manufacturing scale. |
|
Mining and
Wear-Resistant PU Components |
Weir Group PLC,
Multotec, Argonics Inc. |
Abrasion resistance,
component lifespan, operational reliability, reduced maintenance
requirements, and performance in mineral processing environments. |
|
Specialty PU and Polymer Components |
Saint-Gobain
Performance Plastics, Krishna Rubber Industries, Trelleborg AB |
Material
performance, chemical resistance, precision engineering, application-specific
customization, and product consistency. |
Key Developments in Global Polyurethane (PU) Components Market
·
TotalEnergies SE
(Hutchinson SA) — Agreement – In March 2026, Hutchinson and Dynamatic Technologies
Limited signed a Memorandum of Agreement (MoA) to support the growth of India's
aerospace market by combining their complementary expertise. The collaboration
leverages Hutchinson's advanced composite systems and multi‑material solutions alongside
Dynamatic's capabilities in metallic aerostructures and complex assemblies.
Initial work packages include Dynamatic entrusting Hutchinson with a composite
parts program, while Hutchinson awards Dynamatic a multi‑year contract for metallic parts. The partnership
aims to strengthen industrial competitiveness from India and contribute to a
local aerospace ecosystem meeting international standards.
·
RAMPF Group — Product
Launch: In
April 2026 RAMPF presented two-component RAKU PUR polyurethane foam sealing
systems at the International Foam Materials Innovation & Application
Conference in Shanghai.
The polyurethane (PU)
components market can be split based on product type, end-use industry, and
region as follows:
On the basis of product
type, the polyurethane (PU) components market from 2021 to 2034 is primarily
split into:
·
Product Type
o
Rigid PU Foam Components
o
Flexible PU Foam Components
o
PU Elastomer Components
o
Others
On the basis of end-use
industry, the polyurethane (PU) components market from 2021 to 2034 covers:
· Marine
· Offshore Oil & Gas
· Building & Construction (Real Estate)
· Mining
· Automotive
· Others
Geographically, the
detailed analysis of consumption, revenue, market share and growth rate, historic
and forecast (2021-2034) of the following regions are covered
North America
·
United States
·
Canada
Europe
·
Germany
·
Italy
·
UK
·
France
·
Spain
·
Switzerland
·
Rest of Europe
Asia-Pacific
·
China
·
Japan
·
India
·
Australia
·
South Korea
·
Rest of Asia Pacific
Middle East and Africa
·
UAE
·
Saudi Arabia
·
South Africa
·
Rest of Middle East & Africa
Latin America
·
Brazil
·
Mexico
·
Argentina
·
Rest of LATAM
Key players in the global polyurethane (PU) components market covered:
·
Trelleborg AB
· TotalEnergies SE (Hutchinson SA)
·
RAMPF Group
·
Freudenberg Group
·
Compagnie de Saint-Gobain
·
Krishna Rubber Industries
·
Multotec
· Kingspan Group
·
Metecno Group
·
ArcelorMittal Construction
· Recticel
·
Woodbridge Group
·
Lear Corporation
·
Adient plc
·
Balmoral Group
·
Argonics Inc.
Aishwarya Panbude (Research Analyst)
Aishwarya Panbude is a skilled Research Analyst with 4+ years of experience in market intelligence, consumer insights, competitive analysis, and industry forecasting across the consumer goods, agriculture, and food & beverage sectors. She specializes in market sizing, trend analysis, growth opportunity mapping, and strategic secondary research for global and regional markets.
Her expertise lies in transforming complex industry data into actionable business strategies that help organizations identify emerging trends, understand customer behavior, and gain a competitive edge. With a strong focus on data-driven insights, business intelligence, and future market trends, Jaya delivers high-quality research solutions aligned with evolving industry demands and market dynamics.
1.
Global
Advanced Driver Assistance Systems (ADAS) Market Introduction and Market
Overview
1.1. Objectives of the Study
1.2. Market Segmentation
1.2.1.Component of Global Advanced
Driver Assistance Systems (ADAS) Market
1.2.2.Technology of Global Advanced
Driver Assistance Systems (ADAS) Market
1.2.3.Autonomy Level of Global Advanced
Driver Assistance Systems (ADAS) Market
1.2.4.Vehicle Type of Global Advanced
Driver Assistance Systems (ADAS) Market
1.2.5.Region of Global Advanced Driver
Assistance Systems (ADAS) Market
1.3. Competition Coverage List of
Market Participants
1.4. Market Definition: Advanced
Driver Assistance Systems (ADAS) Market
2.
Executive Summary
2.1. Global Advanced Driver
Assistance Systems (ADAS) Market Estimation & Forecast
2.1.1.Global Advanced Driver
Assistance Systems (ADAS) Market Size (US$ Million) Estimates & Historical
Trend Analysis (2021 - 2025)
2.1.2.Global Advanced Driver
Assistance Systems (ADAS) Overall Market Size (US$ Million), Growth Rate
(Y-o-Y), Market CAGR (%), Market forecast (2026 - 2034)
2.2. Snapshot of Global Advanced
Driver Assistance Systems (ADAS) Market
2.3. Global Advanced Driver
Assistance Systems (ADAS) Market Revenue Share (%) 2025
2.4. REGIONAL OUTLINE: Revenue CAGR,
by Region
2.5. Key Competitors & Key
Insights
3.
Market Overview (Qualitative
Analysis)
3.1. Demand Side Trends
3.2. Key Market Trends
3.3. Supply Side Trends /
Manufacturing Trends
3.4. Demand and Opportunity
Assessment, 2026 - 2034
3.5. Market Dynamics
3.5.1.Drivers
3.5.2.Limitations
3.5.3.Opportunities
3.5.4.Impact Analysis of Drivers and
Restraints
3.6. Pricing Models and Service Cost
Analysis in ADAS
3.7. Case Study Analysis
3.8. Impact of Generative AI
3.9. Overview of Regulatory Landscape
and Certification
3.10. U.S. Tariff Impact on ADAS
3.11. Value Chain Analysis
3.12. Porter’s Five Forces Analysis
3.13. PEST Analysis
4.
Global Advanced Driver Assistance
Systems (ADAS) Market Estimates & Forecast Trend Analysis, by Component
4.1. Global Advanced Driver
Assistance Systems (ADAS) Market Assessments & Key Findings, by Component
4.2. Global Advanced Driver
Assistance Systems (ADAS) Market Revenue (US$ Million) Estimates and Forecasts,
by Component, 2021 - 2034
4.2.1.Processor
4.2.2.Sensors
4.2.2.1.
Radar
4.2.2.2.
LiDAR
4.2.2.3.
Ultrasonic
4.2.2.4.
Infrared
4.2.2.5.
Others
4.2.3.Software
4.2.4.Others
5.
Global Advanced Driver
Assistance Systems (ADAS) Market Estimates & Forecast Trend Analysis, by Technology
5.1. Global Advanced Driver
Assistance Systems (ADAS) Market Assessments & Key Findings, by Technology
5.2. Global Advanced Driver
Assistance Systems (ADAS) Market Revenue (US$ Million) Estimates and Forecasts,
by Technology, 2021 - 2034
5.2.1.Adaptive Cruise Control (ACC)
5.2.2.Blind Spot Detection System
(BSD)
5.2.3.Park Assistance
5.2.4.Lane Departure Warning System
(LDWS)
5.2.5.Tire Pressure Monitoring System
(TPMS)
5.2.6.Autonomous Emergency Braking
(AEB)
5.2.7.Adaptive Front Lights (AFL)
5.2.8.Driver monitoring
5.2.9.Traffic Sign Recognition
5.2.10. Others
6.
Global Advanced Driver Assistance
Systems (ADAS) Market Estimates & Forecast Trend Analysis, by Autonomy Level
6.1. Global Advanced Driver
Assistance Systems (ADAS) Market Assessments & Key Findings, by Autonomy
Level
6.2. Global Advanced Driver
Assistance Systems (ADAS) Market Revenue (US$ Million) Estimates and Forecasts,
by Autonomy Level, 2021 - 2034
6.2.1.L1
6.2.2.L2
6.2.3.L3
6.2.4.L4
7.
Global Advanced Driver
Assistance Systems (ADAS) Market Estimates & Forecast Trend Analysis, by Vehicle
Type
7.1. Global Advanced Driver
Assistance Systems (ADAS) Market Assessments & Key Findings, by Vehicle
Type
7.2. Global Advanced Driver
Assistance Systems (ADAS) Market Revenue (US$ Million) Estimates and Forecasts,
by Vehicle Type, 2021 - 2034
7.2.1.Passenger Cars
7.2.2.Light Commercial Vehicle
7.2.3.Heavy Commercial Vehicle
8.
Global Advanced Driver
Assistance Systems (ADAS) Market Estimates & Forecast Trend Analysis, by Region
8.1. Global Advanced Driver
Assistance Systems (ADAS) Market Assessments & Key Findings, by Region
8.2. Global Advanced Driver
Assistance Systems (ADAS) Market Revenue (US$ Million) Estimates and Forecasts,
by Region, 2021 - 2034
8.2.1.North America
8.2.2.Europe
8.2.3.Asia Pacific
8.2.4.Middle East & Africa
8.2.5.Latin America
9.
North
America Advanced Driver Assistance Systems (ADAS)
Market: Estimates & Forecast Trend
Analysis
9.1.
North
America Advanced Driver Assistance Systems (ADAS) Market Assessments & Key
Findings
9.1.1.North America Advanced Driver
Assistance Systems (ADAS) Market Introduction
9.1.2.North America Advanced Driver
Assistance Systems (ADAS) Market Size Estimates and Forecast (US$ Million) (2021
- 2034)
9.1.2.1. By Component
9.1.2.2. By Technology
9.1.2.3. By Autonomy Level
9.1.2.4. By Vehicle Type
9.1.2.5. By Country
9.1.2.5.1. The U.S.
9.1.2.5.2. Canada
10. Europe Advanced
Driver Assistance Systems (ADAS) Market:
Estimates & Forecast Trend Analysis
10.1. Europe Advanced Driver
Assistance Systems (ADAS) Market Assessments & Key Findings
10.1.1. Europe Advanced Driver
Assistance Systems (ADAS) Market Introduction
10.1.2. Europe Advanced Driver
Assistance Systems (ADAS) Market Size Estimates and Forecast (US$ Million) (2021
- 2034)
10.1.2.1. By Component
10.1.2.2. By Technology
10.1.2.3. By Autonomy Level
10.1.2.4. By Vehicle Type
10.1.2.5. By Country
10.1.2.5.1.
Germany
10.1.2.5.2.
Italy
10.1.2.5.3.
U.K.
10.1.2.5.4.
France
10.1.2.5.5.
Spain
10.1.2.5.6.
Switzerland
10.1.2.5.7. Rest
of Europe
11. Asia Pacific Advanced
Driver Assistance Systems (ADAS) Market:
Estimates & Forecast Trend Analysis
11.1. Asia Pacific Market Assessments
& Key Findings
11.1.1. Asia Pacific Advanced Driver
Assistance Systems (ADAS) Market Introduction
11.1.2. Asia Pacific Advanced Driver
Assistance Systems (ADAS) Market Size Estimates and Forecast (US$ Million) (2021
- 2034)
11.1.2.1. By Component
11.1.2.2. By Technology
11.1.2.3. By Autonomy Level
11.1.2.4. By Vehicle Type
11.1.2.5. By Country
11.1.2.5.1. China
11.1.2.5.2. Japan
11.1.2.5.3. India
11.1.2.5.4. Australia
11.1.2.5.5. South Korea
11.1.2.5.6. Rest of Asia Pacific
12. Middle East & Africa Advanced
Driver Assistance Systems (ADAS) Market:
Estimates & Forecast Trend Analysis
12.1. Middle East & Africa Market
Assessments & Key Findings
12.1.1. Middle
East & Africa Advanced
Driver Assistance Systems (ADAS) Market Introduction
12.1.2. Middle
East & Africa Advanced
Driver Assistance Systems (ADAS) Market Size Estimates and Forecast (US$ Million)
(2021 - 2034)
12.1.2.1. By Component
12.1.2.2. By Technology
12.1.2.3. By Autonomy Level
12.1.2.4. By Vehicle Type
12.1.2.5. By Country
12.1.2.5.1. South Africa
12.1.2.5.2. UAE
12.1.2.5.3. Saudi Arabia
12.1.2.5.4. Rest of MEA
13. Latin America
Advanced Driver Assistance Systems (ADAS) Market: Estimates & Forecast Trend Analysis
13.1. Latin America Market Assessments
& Key Findings
13.1.1. Latin America Advanced Driver Assistance
Systems (ADAS) Market Introduction
13.1.2. Latin America Advanced Driver
Assistance Systems (ADAS) Market Size Estimates and Forecast (US$ Million) (2021
- 2034)
13.1.2.1. By Component
13.1.2.2. By Technology
13.1.2.3. By Autonomy Level
13.1.2.4. By Vehicle Type
13.1.2.5. By Country
13.1.2.5.1. Brazil
13.1.2.5.2. Mexico
13.1.2.5.3. Argentina
13.1.2.5.4. Rest of LATAM
14. Competition Landscape
14.1. Global Advanced Driver
Assistance Systems (ADAS) Market Product Mapping
14.2. Global Advanced Driver
Assistance Systems (ADAS) Market Concentration Analysis, by Leading Players /
Innovators / Emerging Players / New Entrants
14.3. Global Advanced Driver
Assistance Systems (ADAS) Market Tier Structure Analysis
14.4. Global Advanced Driver
Assistance Systems (ADAS) Market Concentration & Company Market Shares (%)
Analysis, 2025
15. Company Profiles
15.1. Robert Bosch GmbH
15.1.1. Company Overview & Key Stats
15.1.2. Financial Performance & KPIs
15.1.3. Product Portfolio
15.1.4. SWOT Analysis
15.1.5. Business Strategy & Recent
Developments
* Similar details would be provided
for all the players mentioned below
15.2.
Continental AG
15.3.
Denso Corporation
15.4.
ZF
Friedrichshafen AG
15.5.
Magna
International Inc.
15.6.
Valeo SA
15.7.
Veoneer
15.8.
Hyundai Mobis
15.9.
Hella GmbH & Co. KGaA
15.10.
Hitachi Astemo Ltd.
15.11.
Autoliv
Inc.
15.12.
Aptiv PLC
15.13.
Mobileye
15.14.
Garmin Ltd.
15.15. Others
16. Research
Findings & Conclusion
17. Assumption & Acronyms Used
18. Research
Methodology
18.1. External Transportations /
Databases
18.2. Internal Proprietary Database
18.3. Primary Research
18.4. Secondary Research
18.5. Assumptions
18.6. Limitations
18.7. Report FAQs
Our Research Methodology
"Insight without rigor is just noise."
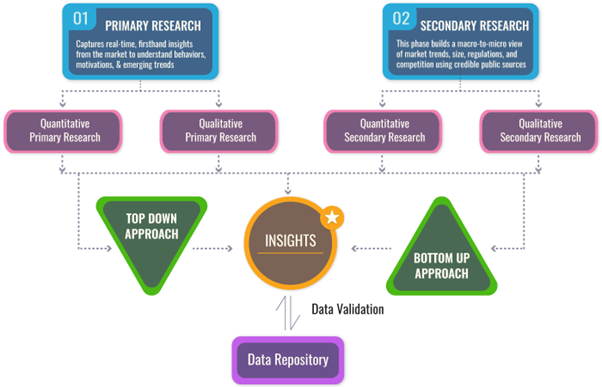
We follow a comprehensive, multi-phase research framework designed to deliver accurate, strategic, and decision-ready intelligence. Our process integrates primary and secondary research , both quantitative and qualitative , along with dual modeling techniques ( top-down and bottom-up) and a final layer of validation through our proprietary in-house repository.
PRIMARY RESEARCH
Primary research captures real-time, firsthand insights from the market to understand behaviors, motivations, and emerging trends.
1. Quantitative Primary Research
Objective: Generate statistically significant data directly from market participants.
Approaches:- Structured surveys with customers, distributors, and field agents
- Mobile-based data collection for point-of-sale audits and usage behavior
- Phone-based interviews (CATI) for market sizing and product feedback
- Online polling around industry events and digital campaigns
- Purchase frequency by customer type
- Channel performance across geographies
- Feature demand by application or demographic
2. Qualitative Primary Research
Objective: Explore decision-making drivers, pain points, and market readiness.
Approaches:- In-depth interviews (IDIs) with executives, product managers, and key decision-makers
- Focus groups among end users and early adopters
- Site visits and observational research for consumer products
- Informal field-level discussions for regional and cultural nuances
SECONDARY RESEARCH
This phase helps establish a macro-to-micro understanding of market trends, size, regulation, and competitive dynamics, sourced from credible and public domain information.
1. Quantitative Secondary Research
Objective: Model market value and segment-level forecasts based on published data.
Sources include:- Financial reports and investor summaries
- Government trade data, customs records, and regulatory statistics
- Industry association publications and economic databases
- Channel performance and pricing data from marketplace listings
- Revenue splits, pricing trends, and CAGR estimates
- Supply-side capacity and volume tracking
- Investment analysis and funding benchmarks
2. Qualitative Secondary Research
Objective: Capture strategic direction, innovation signals, and behavioral trends.
Sources include:- Company announcements, roadmaps, and product pipelines
- Publicly available whitepapers, conference abstracts, and academic research
- Regulatory body publications and policy briefs
- Social and media sentiment scanning for early-stage shifts
- Strategic shifts in market positioning
- Unmet needs and white spaces
- Regulatory triggers and compliance impact
DUAL MODELING: TOP-DOWN + BOTTOM-UP
To ensure robust market estimation, we apply two complementary sizing approaches:
Top-Down Modeling:- Start with broader industry value (e.g., global or regional TAM)
- Apply filters by segment, geography, end-user, or use case
- Adjust with primary insights and validation benchmarks
- Ideal for investor-grade market scans and opportunity mapping
- Aggregate from the ground up using sales volumes, pricing, and unit economics
- Use internal modeling templates aligned with stakeholder data
- Incorporate distributor-level or region-specific inputs
- Most accurate for emerging segments and granular sub-markets
DATA VALIDATION: IN-HOUSE REPOSITORY
We close the loop with proprietary data intelligence built from ongoing projects, industry monitoring, and historical benchmarking. This repository includes:
- Multi-sector market and pricing models
- Key trendlines from past interviews and forecasts
- Benchmarked adoption rates, churn patterns, and ROI indicators
- Industry-specific deviation flags and cross-check logic
- Catches inconsistencies early
- Aligns projections across studies
- Enables consistent, high-trust deliverables