

Portable Power Market Size and Forecast (2026–2034), Global and Regional Growth, Trend, Share and Industry Analysis Report Coverage; By Power Source (Direct Power, Battery-Powered Portable Power); By Capacity (Below 500 Wh, 500–1,000 Wh, Above 1,000 Wh); By Application (Emergency Power, Outdoor Recreation, Off-Grid Power, Residential Backup, Others); By End User (Residential, Commercial, Industrial); and Geography
2026-08-14
Energy & Power
Ekta Chaurasia (Team Lead)
Description
Portable Power Market Overview
The global Portable
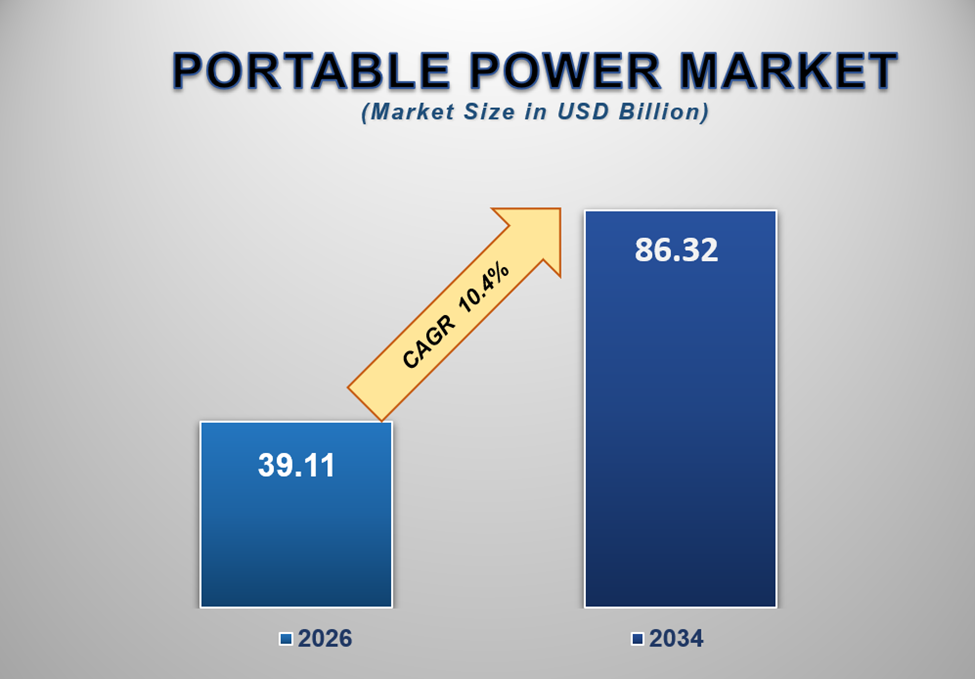
Power Market was valued at USD 39.11 billion in 2026 and is
projected to reach USD 86.32 billion by 2034, expanding at a CAGR of
10.4% during the forecast period. The market is experiencing strong growth
due to increasing demand for reliable backup electricity, rising outdoor
recreational activities, growing adoption of battery-powered equipment,
expansion of off-grid applications, and continuous advancements in energy
storage technologies.
Portable power
products provide electricity to consumers and businesses in locations where
conventional grid electricity is unavailable, unreliable, or inconvenient.
These solutions include portable power stations, battery generators, compact
power supplies, and other rechargeable energy-storage systems.
The increasing
frequency of power interruptions and growing awareness regarding emergency
preparedness are encouraging households and businesses to adopt portable backup
power solutions.
The expansion of
outdoor recreation, camping, travel, remote work, and recreational vehicle
activities is also creating substantial demand for compact energy-storage
systems capable of powering electronic devices, appliances, lighting equipment,
and communication systems.
Advancements in
lithium-ion and lithium iron phosphate battery technologies are improving
energy density, charging speed, operating life, safety, and portability. These
improvements are making portable power stations increasingly suitable for both
consumer and professional applications.
The integration
of solar charging capabilities is further expanding the market. Consumers can
combine portable power stations with solar panels to obtain electricity in
remote locations while reducing dependence on conventional fuel-powered
generators.
Growing demand
for clean and quiet backup power is also encouraging consumers to shift toward
battery-based portable power systems. Unlike conventional portable generators,
battery-powered systems can operate with minimal noise and without direct
exhaust emissions during use.
Additionally,
falling battery costs, improved power-management technologies, and the
increasing availability of high-capacity portable systems are expanding the
range of applications. As consumers and businesses increasingly prioritize
energy resilience, mobility, and cleaner power solutions, the portable power
market is expected to maintain strong growth through 2034.
Portable Power Market Drivers and
Opportunities
Increasing
Demand for Reliable Backup Power Is Driving Market Growth
The growing need
for dependable backup electricity is one of the primary factors driving the
portable power market.
Power outages
caused by severe weather events, infrastructure limitations, grid disruptions,
and other unexpected circumstances can affect households, businesses, and
critical equipment.
Portable power
stations provide an accessible backup solution for essential electronics,
communication devices, lighting, medical equipment, and selected household
appliances.
The increasing
focus on household emergency preparedness is encouraging consumers to invest in
rechargeable backup systems that can be stored and deployed when required.
Small businesses and remote workers are also increasingly using portable power solutions to maintain productivity during temporary power interruptions.
Growing
Outdoor Recreation and Off-Grid Activities Are Supporting Market Expansion
The increasing
popularity of camping, hiking, road trips, recreational vehicles, outdoor
events, and remote travel is creating significant demand for portable
electricity.
Modern consumers
increasingly require electricity for smartphones, laptops, cameras, lighting,
portable refrigerators, cooking equipment, and communication devices while
traveling or staying away from conventional power infrastructure.
Portable power
stations provide a convenient alternative to fuel-powered generators because
they can operate quietly and can be recharged through wall outlets, vehicles,
or solar panels.
The expansion of outdoor recreation and adventure tourism is therefore supporting demand for lightweight and high-capacity portable power systems.
Solar
Integration and Advanced Battery Technologies Present Significant Opportunities
The integration
of renewable energy technologies with portable power systems presents
substantial growth opportunities.
Solar-compatible
portable power stations allow users to recharge batteries in remote locations, supporting
off-grid living, emergency preparedness, outdoor activities, and
disaster-response applications.
Manufacturers
are increasingly developing systems equipped with lithium iron phosphate
batteries, fast-charging capabilities, advanced battery-management systems,
smart monitoring, and multiple output ports.
The growing
adoption of high-capacity batteries is also enabling portable power systems to
support increasingly demanding appliances and equipment.
As battery
technology improves and consumers seek cleaner alternatives to conventional
generators, solar-integrated and advanced battery-based portable power products
are expected to represent important areas of market expansion.
Portable Power Market Scope
|
Report Attributes |
Description |
|
Market Size in 2026 |
USD 39.11 Billion |
|
Market Forecast in 2034 |
USD 86.32 Billion |
|
CAGR % 2026-2034 |
10.4% |
|
Base Year |
2025 |
|
Historic Data |
2021-2025 |
|
Forecast Period |
2026-2034 |
|
Report USP |
Production, Consumption,
Company Share, Company Heatmap, Company Production, Service Type, Growth
Factors and more |
|
Segments Covered |
• By Power Source |
|
Regional Scope |
● North America |
|
Country Scope |
U.S. |
Portable Power Market Report
Segmentation Analysis
The global
portable power market industry analysis is segmented by power source, by
capacity, by application, by end user, and by region.
The
Battery-Powered Portable Power Segment Is Expected to Dominate the Market
During the Forecast Period
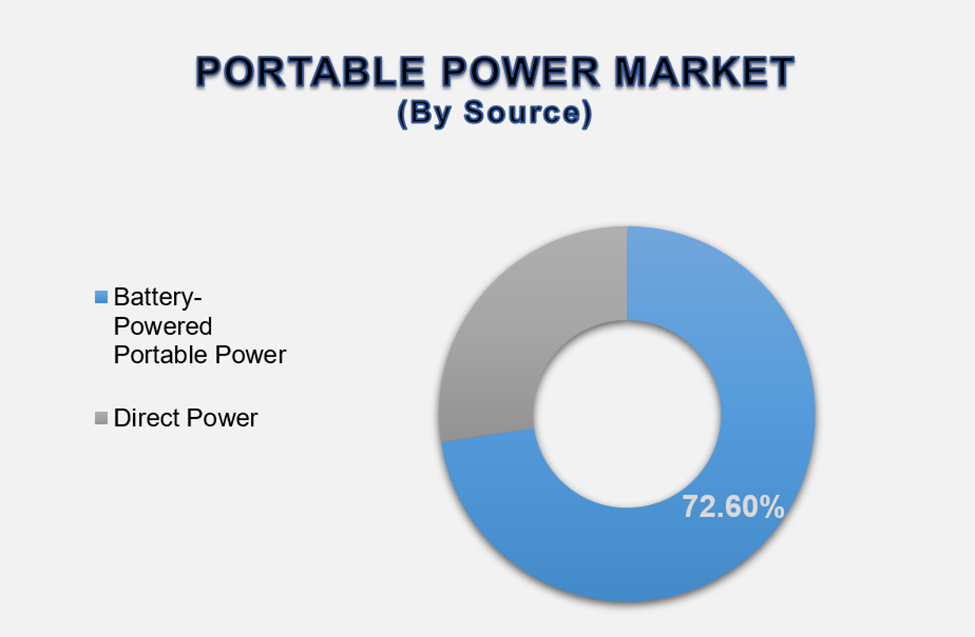
The Battery-Powered
Portable Power segment accounted for approximately 72.6% of the
global market, making it the dominant power-source category.
Battery-powered
systems are increasingly preferred because they provide quiet, convenient, and
emission-free operation.
Advancements in
lithium-ion and lithium iron phosphate battery technologies have improved
storage capacity, charging efficiency, safety, and product lifespan.
The growing
availability of portable power stations with multiple output configurations is
also allowing users to operate several electronic devices and appliances from a
single system.
Increasing consumer preference for cleaner alternatives to fuel-powered generators is expected to support the segment further.
The Above
1,000 Wh Segment Is Expected to Lead the Market by Capacity
The Above
1,000 Wh segment is expected to hold the largest market share due to
increasing demand for high-capacity portable power systems capable of
supporting appliances, tools, and multiple electronic devices for extended
periods.
High-capacity
systems are particularly attractive for emergency backup, recreational
vehicles, off-grid applications, professional work, and outdoor activities.
Advancements in battery energy density are allowing manufacturers to provide greater storage capacity without proportionally increasing product size.
The Emergency
Power Segment Is Expected to Dominate the Market by Application
The Emergency
Power segment represents the largest share of the portable power market due
to growing concerns regarding electricity interruptions and energy reliability.
Portable power
systems can provide temporary electricity for communication equipment,
lighting, computing devices, essential appliances, and other equipment during
outages.
Increasing
extreme weather events and aging electricity infrastructure in several markets
are strengthening consumer and business interest in backup power solutions.
The growing emphasis on household and business resilience is expected to maintain emergency power as a leading application.
The
Residential Segment Is Expected to Dominate the Market by End User
The Residential
segment accounts for the largest market share due to increasing household
adoption of portable backup systems and growing interest in emergency
preparedness.
Consumers are
increasingly purchasing portable power stations to support essential
electronics, appliances, lighting, and communication equipment during outages.
Demand is also
being supported by outdoor recreation, remote work, home energy resilience, and
the increasing availability of consumer-friendly portable power products.
The following
segments are part of an in-depth analysis of the global Portable Power Market:
|
Market Segments |
|
|
By Power Source |
●
Direct Power ●
Battery-Powered Portable Power |
|
By
Capacity |
●
Below 500 Wh ●
500–1,000 Wh ●
Above 1,000 Wh |
|
By Application |
●
Emergency Power ●
Outdoor Recreation ●
Off-Grid Power ●
Residential Backup ●
Others |
|
By End User |
●
Residential ●
Commercial ●
Industrial |
Portable Power Market Share Analysis
By Region
North America is projected to hold the largest share of the global portable power
market over the forecast period.
North America
accounted for approximately 34.2% of the global market in 2026,
supported by high consumer awareness of emergency preparedness, increasing
outdoor recreational activities, strong adoption of battery-powered equipment,
and rising demand for residential backup electricity. The United States
remains the dominant contributor due to frequent extreme weather events, high
consumer purchasing power, extensive camping and recreational vehicle markets,
and growing adoption of portable power stations.
Europe represents a significant market due to increasing interest in
renewable energy, energy resilience, outdoor recreation, and low-emission power
solutions. Consumers and businesses are increasingly adopting battery-based
backup systems as alternatives to conventional fuel generators. Germany, the
U.K., France, Italy, Spain, and Switzerland are important regional markets.
Asia Pacific is expected to register the highest CAGR during the forecast
period. Rapid urbanization, increasing electricity demand, expanding
e-commerce, growing outdoor recreation, and rising adoption of renewable energy
technologies are supporting regional growth. China, Japan, India, South
Korea, and Australia are major contributors, with China also serving as an
important manufacturing hub for portable battery and energy-storage products.
Latin America is expected to experience steady growth due to grid reliability
challenges in selected markets, increasing renewable energy adoption, and
expanding outdoor and recreational activities. Brazil, Mexico, and Argentina
represent key markets within the region.
Middle East & Africa is an emerging market supported by increasing demand for off-grid electricity, solar-powered energy solutions, telecommunications backup, and portable power for remote applications. High solar potential in several countries provides additional opportunities for solar-integrated portable power systems.
Portable
Power Market Competition Landscape Analysis
The portable
power market is highly competitive, with manufacturers focusing on battery
capacity, charging speed, portability, safety, product durability, and smart
energy-management capabilities.
Companies are
increasingly developing portable power stations equipped with lithium iron
phosphate batteries, solar charging capabilities, multiple AC and DC outputs,
USB charging ports, wireless connectivity, and mobile applications for remote
monitoring.
Product
differentiation is becoming increasingly important as manufacturers target
residential users, outdoor enthusiasts, emergency-preparedness consumers,
professional users, and off-grid applications.
Companies are also expanding distribution through direct-to-consumer websites, online marketplaces, specialty retailers, and strategic partnerships. Investments in battery technology, solar integration, fast charging, and intelligent energy management are expected to remain key competitive strategies.
Global
Portable Power Market Recent Developments News
●
In April 2026 – Portable power manufacturers expanded high-capacity battery
systems designed for residential backup and emergency applications.
●
In February 2026 – Companies introduced new portable power stations featuring faster
charging, improved battery management, and expanded solar compatibility.
●
In November 2025 – Manufacturers expanded lithium iron phosphate-based portable
power product portfolios to improve safety and operating life.
●
In August 2025 – Portable power companies strengthened products designed for
camping, recreational vehicles, outdoor events, and remote work.
● In June 2025 – Energy-storage manufacturers increased integration of mobile applications and smart monitoring capabilities into portable power stations.
The Global
Portable Power Market is Dominated by a Few Large Companies, Such As
●
EcoFlow Inc.
●
BLUETTI
●
Jackery Inc.
●
Goal Zero
●
Anker Innovations Limited
●
Zendure
●
DJI
●
Duracell Inc.
●
Milwaukee Tool
●
Pecron
●
Lion Energy
●
ROCKPALS
●
Renogy
●
ALLPOWERS Industrial
International Limited
●
Westinghouse Electric
Corporation
● Others
Frequently Asked Questions
Ekta Chaurasia (Team Lead)
Ekta Chaurasia is a highly experienced Team Lead at M2Square Consultancy with over 7 years of expertise in market research, strategic consulting, competitive benchmarking, and business intelligence solutions. She specializes in ICT, semiconductors & electronics, automotive & transportation, and industrial machinery markets.
She leads end-to-end global research projects focused on market trends, industry analysis, growth forecasting, customer insights, and strategic decision-making. Known for her analytical leadership and industry expertise, Ekta helps businesses uncover growth opportunities, evaluate competitive landscapes, and stay ahead in rapidly evolving markets through accurate and insight-driven research.
1.
Global Portable Power
Market Introduction and Market Overview
1.1. Objectives of the Study
1.2. Global Portable Power Market Scope and Market Estimation
1.2.1.
Global Portable Power Market
Size (US$ Million), Market CAGR (%), Market Forecast (2026 - 2034)
1.2.2.
Global Portable Power Market
Revenue Share (%) and Growth Rate (Y-o-Y) Analysis (2021 - 2034)
1.3. Market Segmentation
1.3.1.
Power Source of Global Portable
Power Market
1.3.2.
Capacity of Global Portable
Power Market
1.3.3.
Application of Global Portable
Power Market
1.3.4.
End User of Global Portable
Power Market
1.3.5.
Region of Global Portable Power
Market
1.4. Competition Coverage List of Market Participants
1.5. Market Definition: Portable Power Market
2.
Executive Summary
2.1. Demand Side Trends
2.2. Key Market Trends
2.3. Market Demand (US$ Million) Analysis 2021 – 2025 and Forecast, 2026
– 2034
2.4. Demand and Opportunity Assessment
2.5. Key Developments
2.6. Overview of Regulatory Landscape, Compliance Framework, and Industry
Standards
2.7. Market Entry Strategies
2.8. Market Dynamics
2.8.1.
Drivers
2.8.2.
Limitations
2.8.3.
Opportunities
2.8.4.
Impact Analysis of Drivers and
Restraints
2.9. Porter's Five Forces Analysis
2.10.
PEST Analysis
3.
Global Portable Power
Market Estimates & Historical Trend Analysis (2021 - 2025)
4.
Global Portable Power
Market Estimates & Forecast Trend Analysis, by Power Source
4.1. Global Portable Power Market Revenue (US$ Million) Estimates and
Forecasts, by Power Source, 2021 - 2034
4.1.1.
Direct Power
4.1.2.
Battery-Powered Portable Power
5.
Global Portable Power
Market Estimates & Forecast Trend Analysis, by Capacity
5.1. Global Portable Power Market Revenue (US$ Million) Estimates and
Forecasts, by Capacity, 2021 - 2034
5.1.1.
Below 500 Wh
5.1.2.
500–1,000 Wh
5.1.3.
Above 1,000 Wh
6.
Global Portable Power
Market Estimates & Forecast Trend Analysis, by Application
6.1. Global Portable Power Market Revenue (US$ Million) Estimates and
Forecasts, by Application, 2021 - 2034
6.1.1.
Emergency Power
6.1.2.
Outdoor Recreation
6.1.3.
Off-Grid Power
6.1.4.
Residential Backup
6.1.5.
Others
7.
Global Portable Power
Market Estimates & Forecast Trend Analysis, by End User
7.1. Global Portable Power Market Revenue (US$ Million) Estimates and
Forecasts, by End User, 2021 - 2034
7.1.1.
Residential
7.1.2.
Commercial
7.1.3.
Industrial
8.
Global Portable Power
Market Estimates & Forecast Trend Analysis, by Region
8.1. Global Portable Power Market Revenue (US$ Million) Estimates and
Forecasts, by Region, 2021 - 2034
8.1.1.
North America
8.1.2.
Europe
8.1.3.
Asia Pacific
8.1.4.
Middle East & Africa
8.1.5.
Latin America
9.
North America Portable
Power Market: Estimates & Forecast Trend Analysis
9.1. North America Portable Power Market Assessments & Key Findings
9.1.1.
North America Portable Power
Market Introduction
9.1.2.
North America Portable Power
Market Size Estimates and Forecast (US$ Million) (2021 - 2034)
9.1.2.1.
By Power Source
9.1.2.2.
By Capacity
9.1.2.3.
By Application
9.1.2.4.
By End User
9.1.2.5.
By Country
9.1.2.5.1.
The U.S.
9.1.2.5.2.
Canada
10. Europe Portable Power Market: Estimates & Forecast Trend
Analysis
10.1.
Europe Portable Power Market
Assessments & Key Findings
10.1.1.
Europe Portable Power Market
Introduction
10.1.2.
Europe Portable Power Market
Size Estimates and Forecast (US$ Million) (2021 - 2034)
10.1.2.1.
By Power Source
10.1.2.2.
By Capacity
10.1.2.3.
By Application
10.1.2.4.
By End User
10.1.2.5.
By Country
10.1.2.5.1.
Germany
10.1.2.5.2.
Italy
10.1.2.5.3.
U.K.
10.1.2.5.4.
France
10.1.2.5.5.
Spain
10.1.2.5.6.
Switzerland
10.1.2.5.7.
Rest of Europe
11. Asia Pacific Portable Power Market: Estimates & Forecast Trend
Analysis
11.1.
Asia Pacific Portable Power
Market Assessments & Key Findings
11.1.1.
Asia Pacific Portable Power
Market Introduction
11.1.2.
Asia Pacific Portable Power
Market Size Estimates and Forecast (US$ Million) (2021 - 2034)
11.1.2.1.
By Power Source
11.1.2.2.
By Capacity
11.1.2.3.
By Application
11.1.2.4.
By End User
11.1.2.5.
By Country
11.1.2.5.1.
China
11.1.2.5.2.
Japan
11.1.2.5.3.
India
11.1.2.5.4.
Australia
11.1.2.5.5.
South Korea
11.1.2.5.6.
Rest of Asia Pacific
12. Middle East & Africa Portable Power Market: Estimates &
Forecast Trend Analysis
12.1.
Middle East & Africa
Portable Power Market Assessments & Key Findings
12.1.1.
Middle East & Africa
Portable Power Market Introduction
12.1.2.
Middle East & Africa
Portable Power Market Size Estimates and Forecast (US$ Million) (2021 - 2034)
12.1.2.1.
By Power Source
12.1.2.2.
By Capacity
12.1.2.3.
By Application
12.1.2.4.
By End User
12.1.2.5.
By Country
12.1.2.5.1.
UAE
12.1.2.5.2.
Saudi Arabia
12.1.2.5.3.
South Africa
12.1.2.5.4.
Rest of MEA
13. Latin America Portable Power Market: Estimates & Forecast Trend
Analysis
13.1.
Latin America Portable Power
Market Assessments & Key Findings
13.1.1.
Latin America Portable Power
Market Introduction
13.1.2.
Latin America Portable Power
Market Size Estimates and Forecast (US$ Million) (2021 - 2034)
13.1.2.1.
By Power Source
13.1.2.2.
By Capacity
13.1.2.3.
By Application
13.1.2.4.
By End User
13.1.2.5.
By Country
13.1.2.5.1.
Brazil
13.1.2.5.2.
Mexico
13.1.2.5.3.
Argentina
13.1.2.5.4.
Rest of LATAM
14. Competition Landscape
14.1.
Global Portable Power Market
Product Mapping
14.2.
Global Portable Power Market
Concentration Analysis, by Leading Players / Innovators / Emerging Players /
New Entrants
14.3.
Global Portable Power Market
Tier Structure Analysis
14.4.
Global Portable Power Market
Concentration & Company Market Shares (%) Analysis, 2025
15. Company Profiles
15.1.
EcoFlow Inc.
15.1.1.
Company Overview & Key
Stats
15.1.2.
Financial Performance &
KPIs
15.1.3.
Product Portfolio
15.1.4.
SWOT Analysis
15.1.5.
Business Strategy & Recent
Developments
*Similar details would be provided for all
the players mentioned below
15.2.
BLUETTI
15.3.
Jackery Inc.
15.4.
Goal Zero
15.5.
Anker Innovations Limited
15.6.
Zendure
15.7.
DJI
15.8.
Duracell Inc.
15.9.
Milwaukee Tool
15.10.
Pecron
15.11.
Lion Energy
15.12.
ROCKPALS
15.13.
Renogy
15.14.
ALLPOWERS Industrial
International Limited
15.15.
Westinghouse Electric
Corporation
15.16.
Others
16. Research Findings & Conclusion
17. Assumptions & Acronyms Used
18. Research Methodology
18.1.
External Databases
18.2.
Internal Proprietary Database
18.3.
Primary Research
18.4.
Secondary Research
18.5.
Assumptions
18.6.
Limitations
18.7. Report FAQs
Our Research Methodology
"Insight without rigor is just noise."
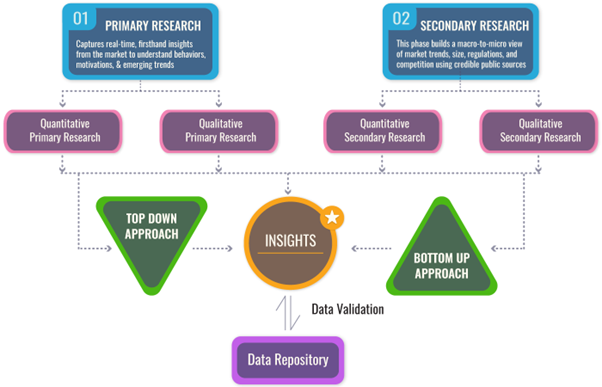
We follow a comprehensive, multi-phase research framework designed to deliver accurate, strategic, and decision-ready intelligence. Our process integrates primary and secondary research , both quantitative and qualitative , along with dual modeling techniques ( top-down and bottom-up) and a final layer of validation through our proprietary in-house repository.
PRIMARY RESEARCH
Primary research captures real-time, firsthand insights from the market to understand behaviors, motivations, and emerging trends.
1. Quantitative Primary Research
Objective: Generate statistically significant data directly from market participants.
Approaches:- Structured surveys with customers, distributors, and field agents
- Mobile-based data collection for point-of-sale audits and usage behavior
- Phone-based interviews (CATI) for market sizing and product feedback
- Online polling around industry events and digital campaigns
- Purchase frequency by customer type
- Channel performance across geographies
- Feature demand by application or demographic
2. Qualitative Primary Research
Objective: Explore decision-making drivers, pain points, and market readiness.
Approaches:- In-depth interviews (IDIs) with executives, product managers, and key decision-makers
- Focus groups among end users and early adopters
- Site visits and observational research for consumer products
- Informal field-level discussions for regional and cultural nuances
SECONDARY RESEARCH
This phase helps establish a macro-to-micro understanding of market trends, size, regulation, and competitive dynamics, sourced from credible and public domain information.
1. Quantitative Secondary Research
Objective: Model market value and segment-level forecasts based on published data.
Sources include:- Financial reports and investor summaries
- Government trade data, customs records, and regulatory statistics
- Industry association publications and economic databases
- Channel performance and pricing data from marketplace listings
- Revenue splits, pricing trends, and CAGR estimates
- Supply-side capacity and volume tracking
- Investment analysis and funding benchmarks
2. Qualitative Secondary Research
Objective: Capture strategic direction, innovation signals, and behavioral trends.
Sources include:- Company announcements, roadmaps, and product pipelines
- Publicly available whitepapers, conference abstracts, and academic research
- Regulatory body publications and policy briefs
- Social and media sentiment scanning for early-stage shifts
- Strategic shifts in market positioning
- Unmet needs and white spaces
- Regulatory triggers and compliance impact
DUAL MODELING: TOP-DOWN + BOTTOM-UP
To ensure robust market estimation, we apply two complementary sizing approaches:
Top-Down Modeling:- Start with broader industry value (e.g., global or regional TAM)
- Apply filters by segment, geography, end-user, or use case
- Adjust with primary insights and validation benchmarks
- Ideal for investor-grade market scans and opportunity mapping
- Aggregate from the ground up using sales volumes, pricing, and unit economics
- Use internal modeling templates aligned with stakeholder data
- Incorporate distributor-level or region-specific inputs
- Most accurate for emerging segments and granular sub-markets
DATA VALIDATION: IN-HOUSE REPOSITORY
We close the loop with proprietary data intelligence built from ongoing projects, industry monitoring, and historical benchmarking. This repository includes:
- Multi-sector market and pricing models
- Key trendlines from past interviews and forecasts
- Benchmarked adoption rates, churn patterns, and ROI indicators
- Industry-specific deviation flags and cross-check logic
- Catches inconsistencies early
- Aligns projections across studies
- Enables consistent, high-trust deliverables