
Power-to-X Market Size and Forecast (2025–2033), Global and Regional Growth, Trend, Share, and Industry Analysis Report Coverage: By Technology (Alkaline Water Electrolysis, Proton Exchange Membrane, Solid Oxide Electrolysis), By End-use (Industry, Transport, Commercial, Others), By Application (Power-to-Hydrogen, Power-to-Ammonia, Power-to-Methane, Power-to-Methanol, Others), and Geography
2026-02-17
Energy & Power
Ekta Chaurasia (Team Lead)
Description
Power-to-X Market Overview
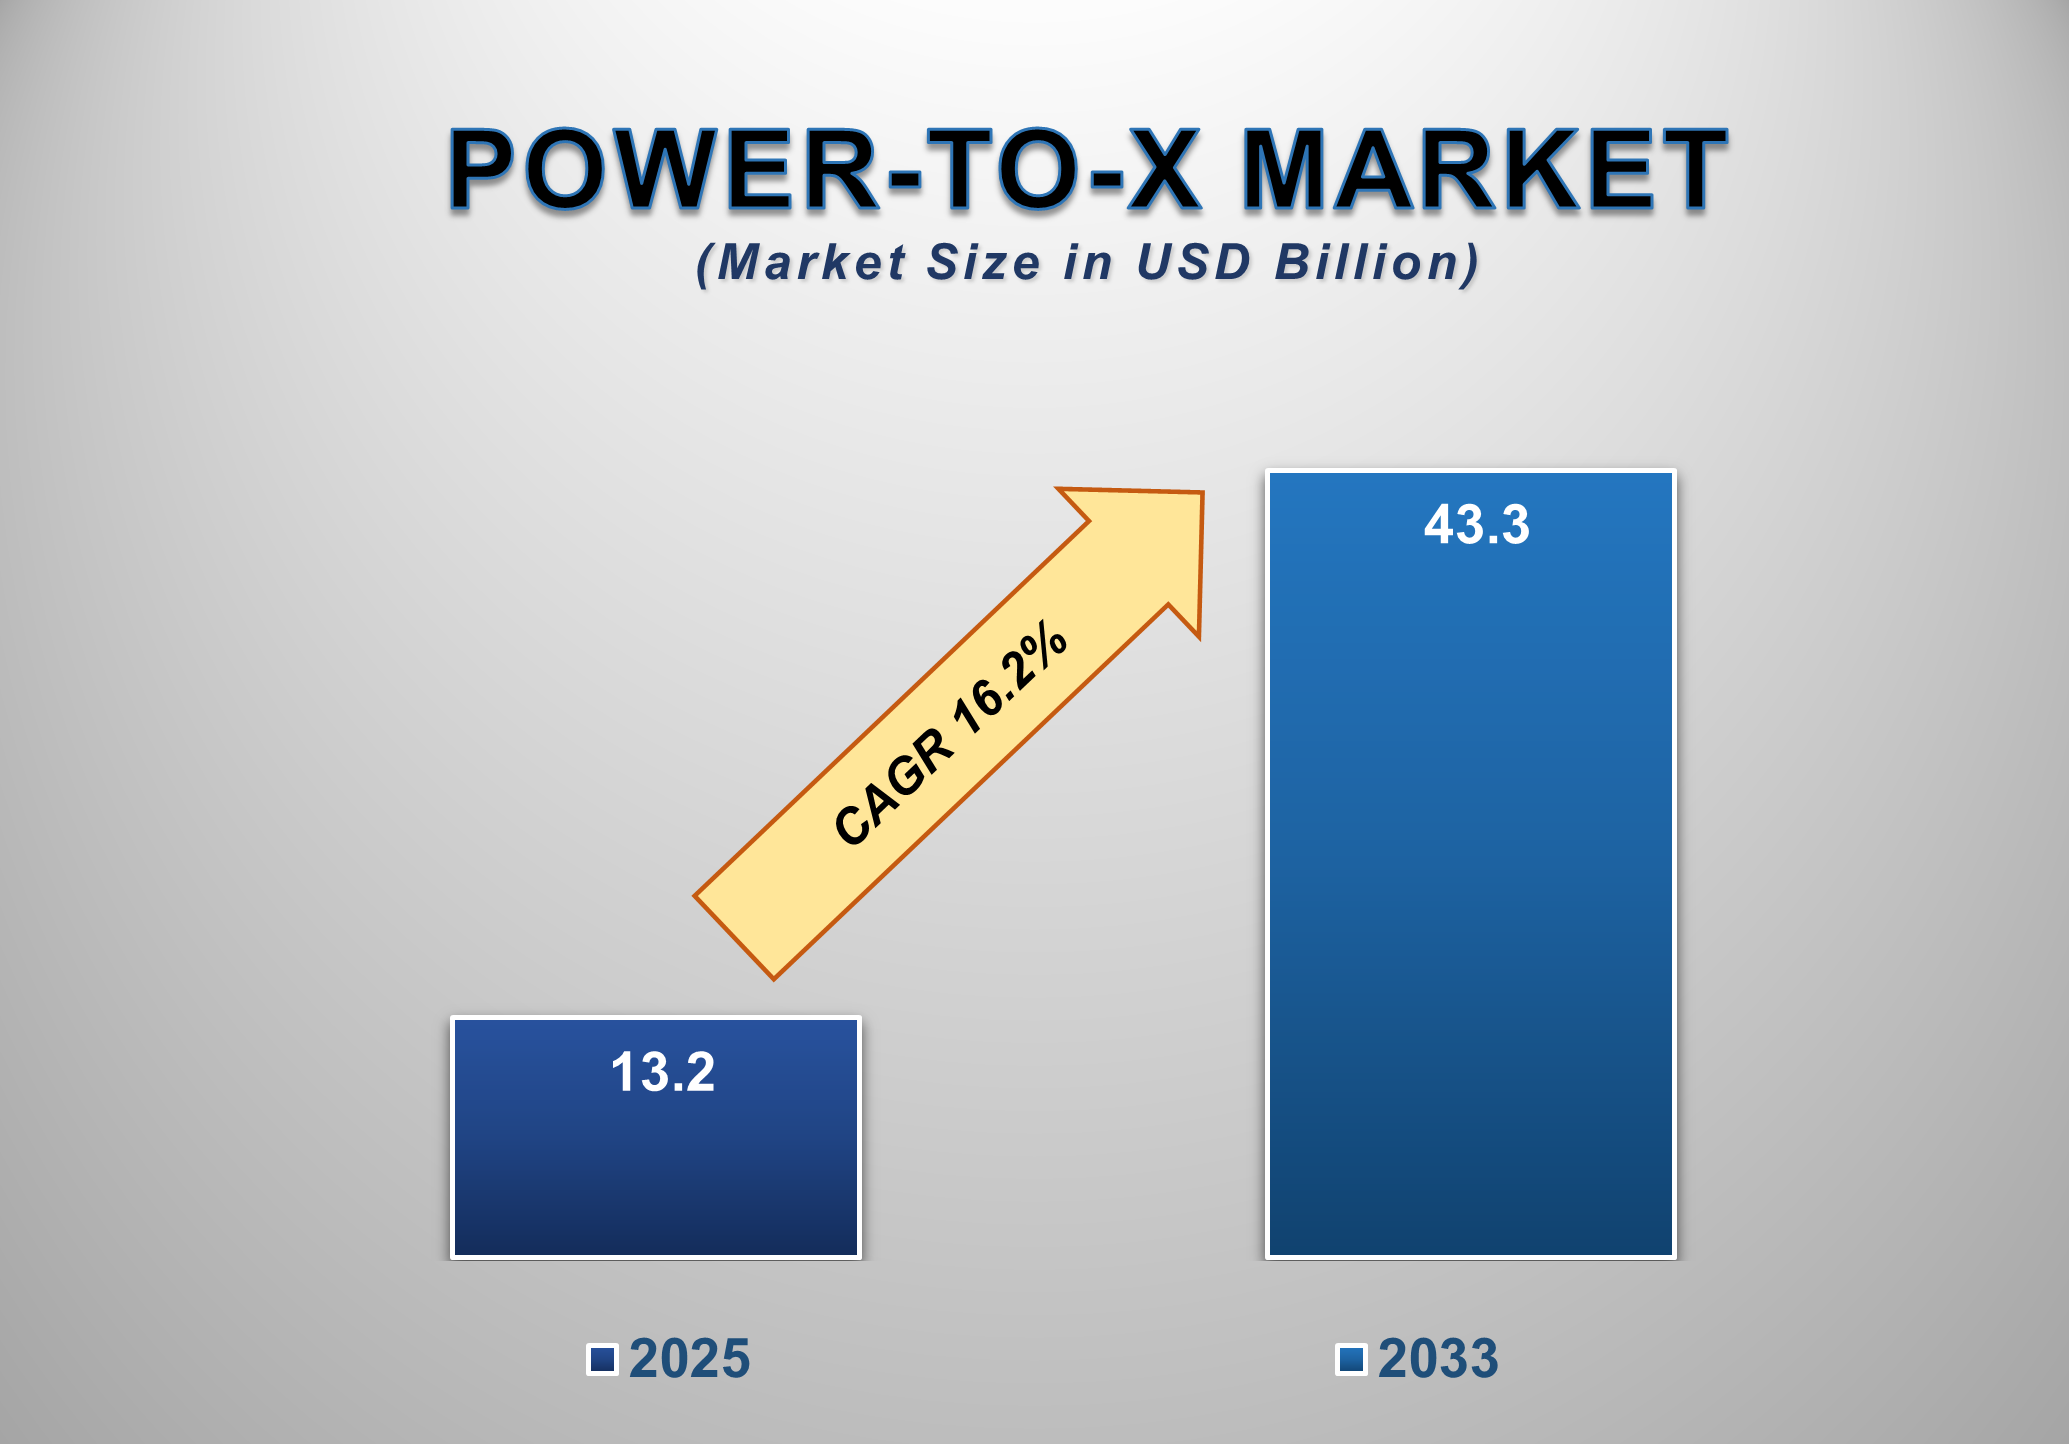
The global Power-to-X (PtX) Market is emerging as a cornerstone of the global energy transition, enabling the conversion of renewable electricity into low-carbon fuels, chemicals, and energy carriers. Power-to-X technologies play a critical role in decarbonizing hard-to-abate sectors such as heavy industry, long-haul transport, power generation, and chemical manufacturing. In 2025, the global Power-to-X market is valued at USD 13.2 billion and is projected to reach USD 43.3 billion by 2033, growing at a strong CAGR of 16.2% during the forecast period.
Market growth is primarily driven
by accelerating renewable energy deployment, rising investments in green
hydrogen infrastructure, and stringent climate policies aimed at achieving
net-zero emissions. Power-to-X enables long-term energy storage, sector coupling,
and renewable energy balancing by converting excess electricity into storable
and transportable molecules such as hydrogen, ammonia, methane, and methanol.
These fuels can be utilized across multiple end-use sectors, supporting deep
decarbonization goals.
Power-to-X Market Drivers
and Opportunities
Rising Global Focus on
Decarbonization and Net-Zero Targets Is Driving Power-to-X Adoption
The accelerating global push toward decarbonization and net-zero
emissions targets is a key driver of growth in the Power-to-X market.
Governments worldwide are implementing ambitious climate policies aimed at
reducing greenhouse gas emissions across power generation, transportation, and
industrial sectors. Power-to-X technologies offer a viable pathway to
decarbonize sectors where direct electrification is technically or economically
challenging. Heavy industries such as steel, cement, chemicals, and refining
require high-temperature heat and energy-dense fuels, which renewable
electricity alone cannot fully replace. Power-to-X enables these industries to
utilize green hydrogen and synthetic fuels produced from renewable power,
significantly reducing carbon footprints. In addition, PtX fuels can be stored
seasonally and transported over long distances, addressing intermittency
challenges associated with wind and solar energy.
Policy mechanisms such as carbon pricing, renewable fuel mandates,
and government subsidies are further accelerating PtX adoption. As countries
commit to long-term climate neutrality goals, Power-to-X is increasingly viewed
as a strategic technology essential for achieving deep and sustainable
decarbonization.
Rapid Expansion of Renewable Energy and Grid Balancing Needs
Is Accelerating Market Growth
The rapid global expansion of renewable energy capacity is another
major driver supporting the Power-to-X market. As wind and solar installations
grow, grid operators face increasing challenges related to intermittency,
curtailment, and energy balancing. Power-to-X technologies enable the
conversion of surplus renewable electricity into chemical energy, allowing
excess power to be stored and used when demand exceeds supply. This capability
is particularly important in regions with high renewable penetration, where
curtailment of renewable power leads to economic losses. By converting excess
electricity into hydrogen or synthetic fuels, Power-to-X systems enhance grid
flexibility and improve the overall efficiency of renewable energy systems.
Utilities, energy developers, and governments are increasingly integrating PtX
into national energy strategies to stabilize grids and support long-term energy
storage. As renewable capacity continues to expand globally, the need for
scalable and flexible energy conversion solutions will further drive Power-to-X
market growth.
Industrial Decarbonization and Green Hydrogen Economy Are
Creating Significant Opportunities
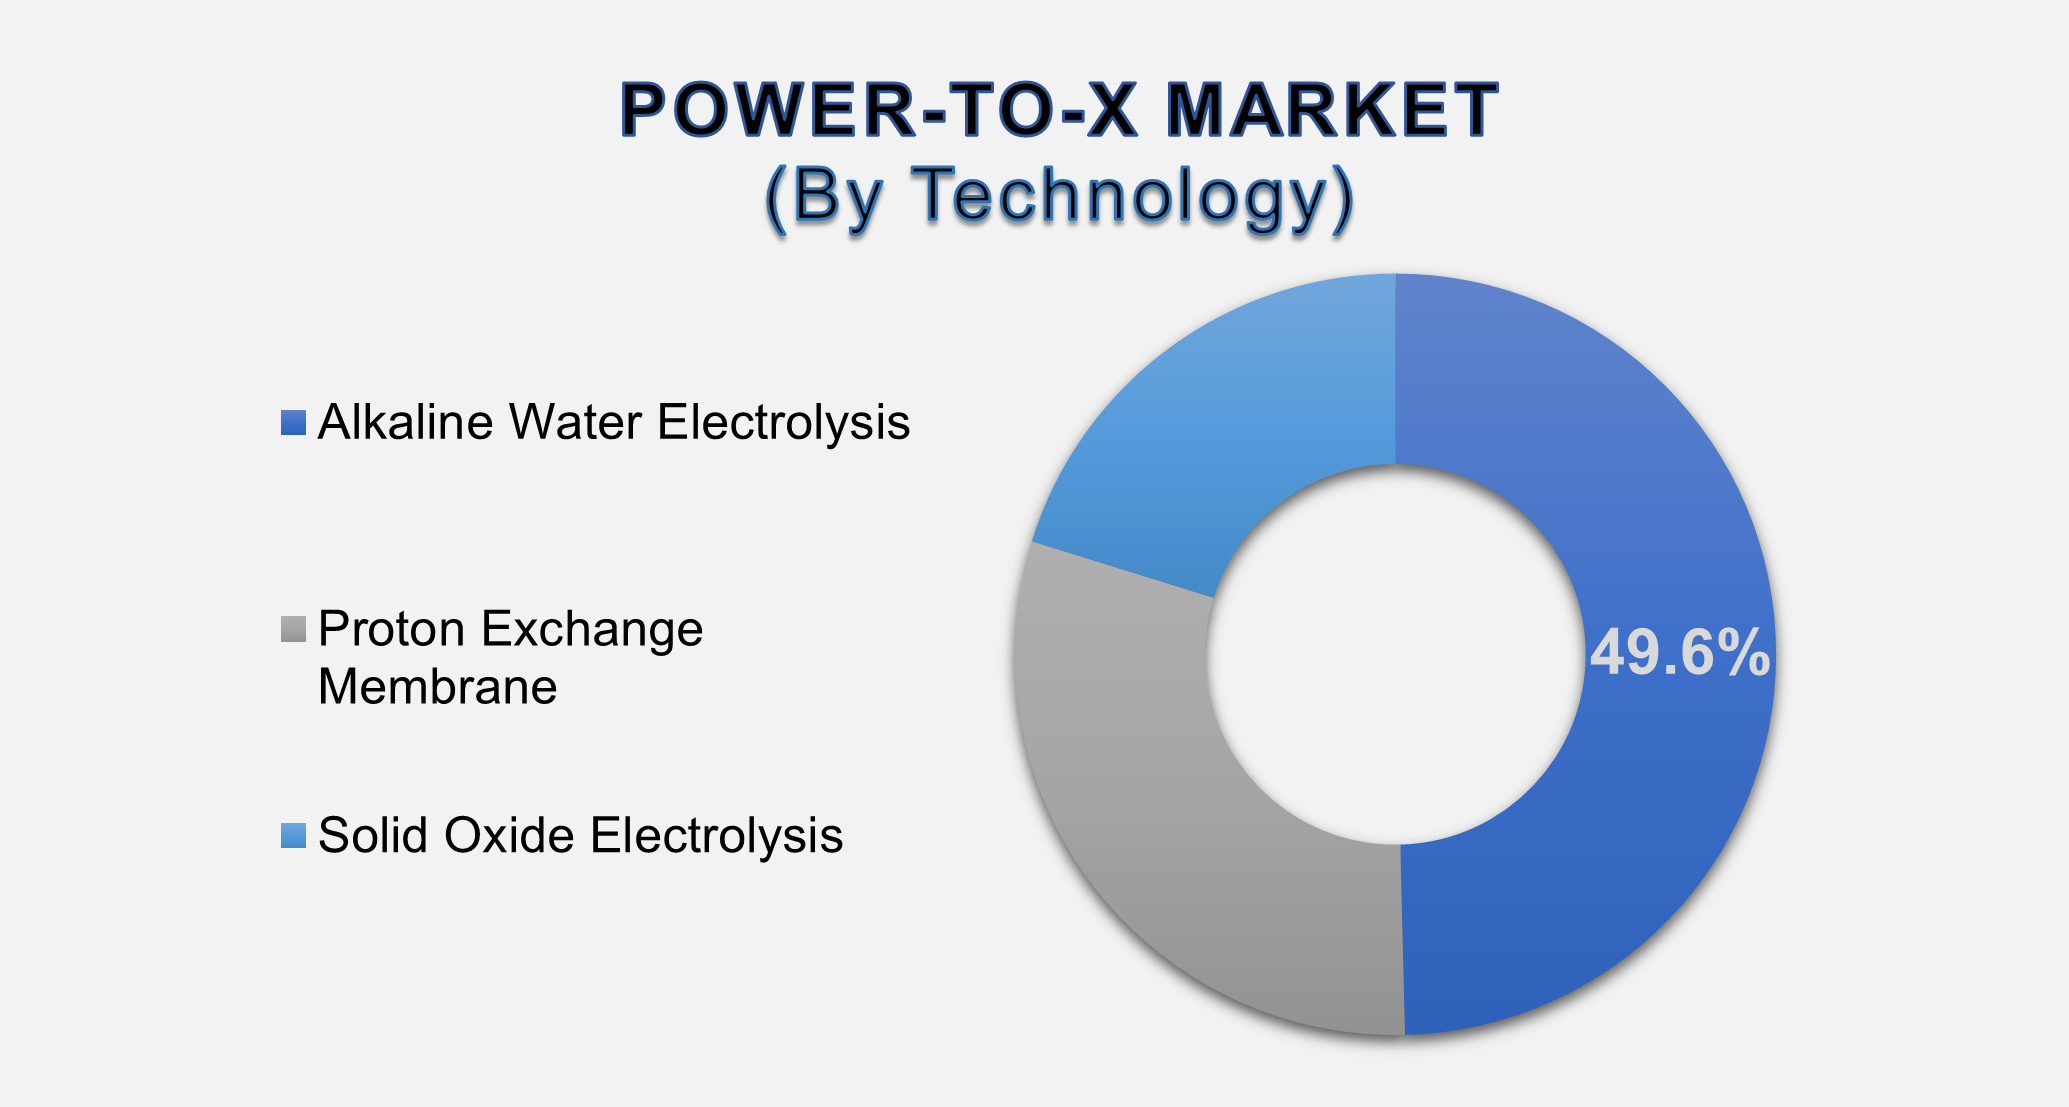
The emergence of the green hydrogen economy presents significant growth opportunities for the Power-to-X market. Power-to-Hydrogen applications account for 49.6% of the market, highlighting hydrogen’s role as the primary output of PtX systems. Green hydrogen serves as a feedstock for ammonia, methanol, and synthetic fuels, as well as a direct energy carrier for industrial and transport applications. Industries such as chemicals, fertilizers, refining, and steelmaking are increasingly adopting green hydrogen to replace fossil-based hydrogen and fuels. Power-to-Ammonia and Power-to-Methanol pathways are gaining momentum as they enable the production of low-carbon fuels and chemical intermediates compatible with existing infrastructure. As global demand for sustainable fuels rises, integrated PtX hubs combining renewable energy, electrolysis, and downstream conversion processes are expected to proliferate. These developments create long-term growth opportunities for technology providers, energy companies, and industrial players across the Power-to-X value chainPower-to-X Market Scope
|
Report Attributes |
Description |
|
Market Size in 2025 |
USD 13.2 Billion |
|
Market Forecast in 2035 |
USD 43.3 Billion |
|
CAGR % 2025-2035 |
16.2% |
|
Base Year |
2024 |
|
Historic Data |
2020-2024 |
|
Forecast Period |
2025-2035 |
|
Report USP |
Production, Consumption,
Company Share, Company Heatmap, Company Production Capacity, Growth Factors,
and more |
|
Segments Covered |
●
Technology,
End-use, Application |
|
Regional Scope |
●
North America, ●
Europe, ●
APAC, ●
Latin America ●
Middle East and
Africa |
|
Country Scope |
1)
U.S. 2)
Canada 3)
Germany 4)
UK 5)
France 6)
Spain 7)
Italy 8)
Switzerland 9)
China 10)
Japan 11)
India 12)
Australia 13)
South Korea 14)
Brazil 15)
Mexico 16)
Argentina 17)
South Africa 18)
Saudi Arabia 19)
UAE |
Power-to-X Market Report
Segmentation Analysis
The Global Power-to-X Market
Industry Analysis Is Segmented By Technology, End-use, Application, and by
Region.
Power-to-Hydrogen Segment Accounted for the Largest Market
Share in the Global Power-to-X Market
The
Power-to-Hydrogen segment accounted for the largest share of the global
Power-to-X market, contributing 34.9% of total revenue. This dominance reflects
hydrogen’s versatility as an energy carrier, feedstock, and storage medium.
Green hydrogen produced via electrolysis is increasingly used in industrial
processes, mobility applications, and power generation. Hydrogen serves as the
primary input for downstream PtX pathways such as ammonia, methanol, and
synthetic fuels, reinforcing its central role in the PtX ecosystem. As hydrogen
infrastructure expands globally, the Power-to-Hydrogen segment is expected to
maintain its leading position.
Alkaline
Water Electrolysis Segment Holds a Significant Share by Technology
The alkaline water electrolysis segment holds a significant share of the market, supported by its technological maturity, cost-effectiveness, and large-scale deployment capability. Alkaline systems are widely used in industrial hydrogen production and large PtX projects due to proven reliability and lower capital costs. While PEM and solid oxide technologies are gaining traction, alkaline electrolysis remains the preferred choice for many commercial PtX installations.
The Industrial
End-use Segment Dominated the Global Power-to-X Market
The
industrial segment dominates the Power-to-X market by end-use, driven by strong
demand from energy-intensive industries seeking low-carbon alternatives.
Industrial users adopt PtX solutions to decarbonize production processes,
comply with emissions regulations, and improve sustainability credentials.
Steelmaking, chemical manufacturing, and refining industries are early adopters
of Power-to-X technologies, supporting steady demand growth. As industrial
decarbonization accelerates, this segment will continue to anchor market
expansion.
The following segments are
part of an in-depth analysis of the global Power-to-X market:
|
Market Segments |
|
|
By Technology |
●
Alkaline Water
Electrolysis ●
Proton Exchange
Membrane ●
Solid Oxide
Electrolysis |
|
By End User |
●
Industry ●
Transport ●
Commercial ●
Others |
|
By Application |
●
Power-to-Hydrogen ●
Power-to-Ammonia ●
Power-to-Methane ●
Power-to-Methanol ●
Others |
Power-to-X Market Share
Analysis by Region
North America is
anticipated to hold the biggest portion of the Power-to-X Market globally
throughout the forecast period.
North America accounted for 36.9%
of the global Power-to-X market, supported by strong policy support,
large-scale hydrogen projects, and significant investments in renewable energy
and clean fuel infrastructure. The United States leads regional growth through
federal funding initiatives and industrial decarbonization programs.
Asia Pacific is expected to
register the highest CAGR during the forecast period, driven by aggressive
clean energy targets, expanding hydrogen strategies, and great industrial
demand. China, Japan, South Korea, and Australia are investing heavily in PtX
technologies to support energy security and emissions reduction goals.
Power-to-X Market
Competition Landscape Analysis
The global Power-to-X market is
moderately consolidated, with competition focused on technology innovation,
project scale, and system efficiency. Leading players are investing in
large-scale electrolysis projects, strategic partnerships, and integrated PtX
solutions to strengthen market positioning.
Global Power-to-X Market
Recent Developments News:
- In June 2024 – Danske Commodities A/S, an Equinor
subsidiary, was appointed as the electricity optimization partner for the
Kassø Power-to-X facility in southern Denmark, which is being developed by
European Energy A/S.
- In September 2023 – European Energy A/S completed
the sale of its 49% stake in a combined Power-to-X asset to Mitsui &
Co. The asset comprises a 304-MW solar farm and an associated e-methanol
production facility in Kassø, Denmark.
- In July 2023 – LEAG (Lausitz Energie Bergbau AG),
Germany's second-largest energy supplier, announced plans for a Power-to-X
project to produce hydrogen, store waste heat, generate electricity, and
supply hydrogen for buses.
- In March 2023 – Hitachi Energy and P2X Solutions
partnered to electrify Finland's first industrial-scale green hydrogen
production plant. Hitachi Energy will supply the main electrical system,
including substations, transformers, and power quality optimization
systems.
- In January 2021 – MAN Energy Solutions acquired 99%
of the shares of H-TEC SYSTEMS, a Germany-based manufacturer of PEM
electrolyzers for hydrogen production.
The Global Power-to-X Market Is
Dominated by a Few Large Companies, such as
●
Siemens Energy
●
Linde
●
Air Liquide
●
Air Products and
Chemicals
●
ITM Power
●
Nel ASA
●
Hydrogenics
●
Thyssenkrupp
●
Sunfire
●
Mitsubishi Power
●
McPhy Energy
●
Plug Power
●
Ballard Power Systems
●
Toshiba Energy Systems
●
Green Hydrogen Systems
●
Enapter
●
Haldor Topsoe
●
BASF
●
Ørsted
●
Engie
●
Neste
● Others
Frequently Asked Questions
Ekta Chaurasia (Team Lead)
Ekta Chaurasia is a highly experienced Team Lead at M2Square Consultancy with over 7 years of expertise in market research, strategic consulting, competitive benchmarking, and business intelligence solutions. She specializes in ICT, semiconductors & electronics, automotive & transportation, and industrial machinery markets.
She leads end-to-end global research projects focused on market trends, industry analysis, growth forecasting, customer insights, and strategic decision-making. Known for her analytical leadership and industry expertise, Ekta helps businesses uncover growth opportunities, evaluate competitive landscapes, and stay ahead in rapidly evolving markets through accurate and insight-driven research.
1. Global Power-to-X Market
Introduction and Market Overview
1.1.
Objectives
of the Study
1.2.
Global
Power-to-X Market Scope and Market Estimation
1.2.1.Global Power-to-X Overall
Market Size (US$ Bn), Market CAGR (%), Market forecast (2025 - 2033)
1.2.2.Global Power-to-X Market
Revenue Share (%) and Growth Rate (Y-o-Y) from 2020 - 2033
1.3.
Market
Segmentation
1.3.1.Technology of Global Power-to-X
Market
1.3.2.End User of Global Power-to-X
Market
1.3.3.Application of Global Power-to-X
Market
1.3.4.Region of Global Power-to-X
Market
2. Executive
Summary
2.1.
Demand
Side Trends
2.2.
Key
Market Trends
2.3.
Market
Demand (US$ Bn) Analysis 2020 – 2024 and Forecast, 2025 – 2033
2.4.
Demand
and Opportunity Assessment
2.5.
Key
Developments
2.6.
Overview
of Tariff, Regulatory Landscape and Standards
2.7.
Market
Entry Strategies
2.8.
Market
Dynamics
2.8.1.Drivers
2.8.2.Limitations
2.8.3.Opportunities
2.8.4.Impact Analysis of Drivers
and Restraints
2.9.
Porter’s
Five Forces Analysis
2.10.
PEST
Analysis
3. Global
Power-to-X Market Estimates
& Historical Trend Analysis (2020 - 2024)
4. Global
Power-to-X Market Estimates
& Forecast Trend Analysis, by Technology
4.1.
Global
Power-to-X Market Revenue (US$ Bn) Estimates and Forecasts, by Technology, 2020
- 2033
4.1.1.Alkaline Water
Electrolysis
4.1.2.Proton Exchange Membrane
4.1.3.Solid Oxide Electrolysis
5. Global
Power-to-X Market Estimates
& Forecast Trend Analysis, by End User
5.1.
Global
Power-to-X Market Revenue (US$ Bn) Estimates and Forecasts, by End User, 2020 -
2033
5.1.1.Industry
5.1.2.Transport
5.1.3.Commercial
5.1.4.Others
6. Global
Power-to-X Market Estimates
& Forecast Trend Analysis, by Application
6.1.
Global
Power-to-X Market Revenue (US$ Bn) Estimates and Forecasts, by Application,
2020 - 2033
6.1.1.Power-to-Hydrogen
6.1.2.Power-to-Ammonia
6.1.3.Power-to-Methane
6.1.4.Power-to-Methanol
6.1.5.Others
7. Global
Power-to-X Market Estimates
& Forecast Trend Analysis, by Region
7.1.
Global
Power-to-X Market Revenue (US$ Bn) Estimates and Forecasts, by Region, 2020 - 2033
7.1.1.North America
7.1.2.Europe
7.1.3.Asia Pacific
7.1.4.Middle East & Africa
7.1.5.Latin America
8. North America Power-to-X
Market: Estimates & Forecast Trend
Analysis
8.1.
North
America Power-to-X Market Assessments & Key Findings
8.1.1.North America Power-to-X
Market Introduction
8.1.2.North America Power-to-X
Market Size Estimates and Forecast (US$ Billion) (2020 - 2033)
8.1.2.1. By Technology
8.1.2.2. By End User
8.1.2.3. By Application
8.1.2.4.
By
Country
8.1.2.4.1. The U.S.
8.1.2.4.2. Canada
9. Europe Power-to-X
Market: Estimates & Forecast Trend
Analysis
9.1.
Europe
Power-to-X Market Assessments & Key Findings
9.1.1.Europe Power-to-X Market
Introduction
9.1.2.Europe Power-to-X Market
Size Estimates and Forecast (US$ Billion) (2020 - 2033)
9.1.2.1. By Technology
9.1.2.2. By End User
9.1.2.3. By Application
9.1.2.4.
By
Country
9.1.2.4.1.
Germany
9.1.2.4.2.
Italy
9.1.2.4.3.
U.K.
9.1.2.4.4.
France
9.1.2.4.5.
Spain
9.1.2.4.6.
Switzerland
9.1.2.4.7. Rest
of Europe
10. Asia Pacific Power-to-X
Market: Estimates & Forecast Trend
Analysis
10.1.
Asia
Pacific Market Assessments & Key Findings
10.1.1.
Asia
Pacific Power-to-X Market Introduction
10.1.2.
Asia
Pacific Power-to-X Market Size Estimates and Forecast (US$ Billion) (2020 - 2033)
10.1.2.1. By Technology
10.1.2.2. By End User
10.1.2.3. By Application
10.1.2.4.
By
Country
10.1.2.4.1. China
10.1.2.4.2. Japan
10.1.2.4.3. India
10.1.2.4.4. Australia
10.1.2.4.5. South Korea
10.1.2.4.6. Rest of Asia Pacific
11. Middle East & Africa Power-to-X
Market: Estimates & Forecast Trend
Analysis
11.1.
Middle
East & Africa Market Assessments & Key Findings
11.1.1.
Middle East & Africa Power-to-X Market Introduction
11.1.2.
Middle East & Africa Power-to-X Market Size Estimates and
Forecast (US$ Billion) (2020 - 2033)
11.1.2.1. By Technology
11.1.2.2. By End User
11.1.2.3. By Application
11.1.2.4.
By
Country
11.1.2.4.1. UAE
11.1.2.4.2. Saudi
Arabia
11.1.2.4.3. South
Africa
11.1.2.4.4. Rest
of MEA
12. Latin America
Power-to-X Market: Estimates &
Forecast Trend Analysis
12.1.
Latin
America Market Assessments & Key Findings
12.1.1.
Latin
America Power-to-X Market Introduction
12.1.2.
Latin
America Power-to-X Market Size Estimates and Forecast (US$ Billion) (2020 - 2033)
12.1.2.1. By Technology
12.1.2.2. By End User
12.1.2.3. By Application
12.1.2.4.
By
Country
12.1.2.4.1. Brazil
12.1.2.4.2. Argentina
12.1.2.4.3. Mexico
12.1.2.4.4. Rest
of LATAM
13. Country Wise Market:
Introduction
14.
Competition
Landscape
14.1.
Global
Power-to-X Market Product Mapping
14.2.
Global
Power-to-X Market Concentration Analysis, by Leading Players / Innovators /
Emerging Players / New Entrants
14.3.
Global
Power-to-X Market Tier Structure Analysis
14.4.
Global
Power-to-X Market Concentration & Company Market Shares (%) Analysis, 2024
15.
Company
Profiles
15.1.
Siemens Energy
15.1.1.
Company
Overview & Key Stats
15.1.2.
Financial
Performance & KPIs
15.1.3.
Product
Portfolio
15.1.4.
SWOT
Analysis
15.1.5.
Business
Strategy & Recent Developments
* Similar details would be provided for all the players
mentioned below
15.2. Linde
15.3. Air
Liquide
15.4. Air
Products and Chemicals
15.5. ITM
Power
15.6. Nel ASA
15.7. Hydrogenics
15.8. Thyssenkrupp
15.9. Sunfire
15.10. Mitsubishi
Power
15.11. McPhy
Energy
15.12. Plug
Power
15.13. Ballard
Power Systems
15.14. Toshiba
Energy Systems
15.15. Green
Hydrogen Systems
15.16. Enapter
15.17. Haldor
Topsoe
15.18. BASF
15.19. Orsted
15.20. Engie
15.21. Neste
15.22. Others
16. Research
Methodology
16.1.
External
Transportations / Databases
16.2.
Internal
Proprietary Database
16.3.
Primary
Research
16.4.
Secondary
Research
16.5.
Assumptions
16.6.
Limitations
16.7.
Report
FAQs
17. Research
Findings & Conclusion
Our Research Methodology
"Insight without rigor is just noise."
We follow a comprehensive, multi-phase research framework designed to deliver accurate, strategic, and decision-ready intelligence. Our process integrates primary and secondary research , both quantitative and qualitative , along with dual modeling techniques ( top-down and bottom-up) and a final layer of validation through our proprietary in-house repository.
PRIMARY RESEARCH
Primary research captures real-time, firsthand insights from the market to understand behaviors, motivations, and emerging trends.
1. Quantitative Primary Research
Objective: Generate statistically significant data directly from market participants.
Approaches:- Structured surveys with customers, distributors, and field agents
- Mobile-based data collection for point-of-sale audits and usage behavior
- Phone-based interviews (CATI) for market sizing and product feedback
- Online polling around industry events and digital campaigns
- Purchase frequency by customer type
- Channel performance across geographies
- Feature demand by application or demographic
2. Qualitative Primary Research
Objective: Explore decision-making drivers, pain points, and market readiness.
Approaches:- In-depth interviews (IDIs) with executives, product managers, and key decision-makers
- Focus groups among end users and early adopters
- Site visits and observational research for consumer products
- Informal field-level discussions for regional and cultural nuances
SECONDARY RESEARCH
This phase helps establish a macro-to-micro understanding of market trends, size, regulation, and competitive dynamics, sourced from credible and public domain information.
1. Quantitative Secondary Research
Objective: Model market value and segment-level forecasts based on published data.
Sources include:- Financial reports and investor summaries
- Government trade data, customs records, and regulatory statistics
- Industry association publications and economic databases
- Channel performance and pricing data from marketplace listings
- Revenue splits, pricing trends, and CAGR estimates
- Supply-side capacity and volume tracking
- Investment analysis and funding benchmarks
2. Qualitative Secondary Research
Objective: Capture strategic direction, innovation signals, and behavioral trends.
Sources include:- Company announcements, roadmaps, and product pipelines
- Publicly available whitepapers, conference abstracts, and academic research
- Regulatory body publications and policy briefs
- Social and media sentiment scanning for early-stage shifts
- Strategic shifts in market positioning
- Unmet needs and white spaces
- Regulatory triggers and compliance impact

DUAL MODELING: TOP-DOWN + BOTTOM-UP
To ensure robust market estimation, we apply two complementary sizing approaches:
Top-Down Modeling:- Start with broader industry value (e.g., global or regional TAM)
- Apply filters by segment, geography, end-user, or use case
- Adjust with primary insights and validation benchmarks
- Ideal for investor-grade market scans and opportunity mapping
- Aggregate from the ground up using sales volumes, pricing, and unit economics
- Use internal modeling templates aligned with stakeholder data
- Incorporate distributor-level or region-specific inputs
- Most accurate for emerging segments and granular sub-markets
DATA VALIDATION: IN-HOUSE REPOSITORY
We close the loop with proprietary data intelligence built from ongoing projects, industry monitoring, and historical benchmarking. This repository includes:
- Multi-sector market and pricing models
- Key trendlines from past interviews and forecasts
- Benchmarked adoption rates, churn patterns, and ROI indicators
- Industry-specific deviation flags and cross-check logic
- Catches inconsistencies early
- Aligns projections across studies
- Enables consistent, high-trust deliverables