
Printed Tape Market Size and Forecast (2025–2033), Global and Regional Growth, Trend, Share and Industry Analysis Report Coverage: By Material (Polypropylene, Polyvinyl Chloride, Others), By End-use (Food & Beverage, Consumer Durables, Transportation & Logistics, others), and Geography
2025-12-18
Packaging Industry
Jaya Bundele (Research Analyst)
Description
Printed
Tape Market Overview
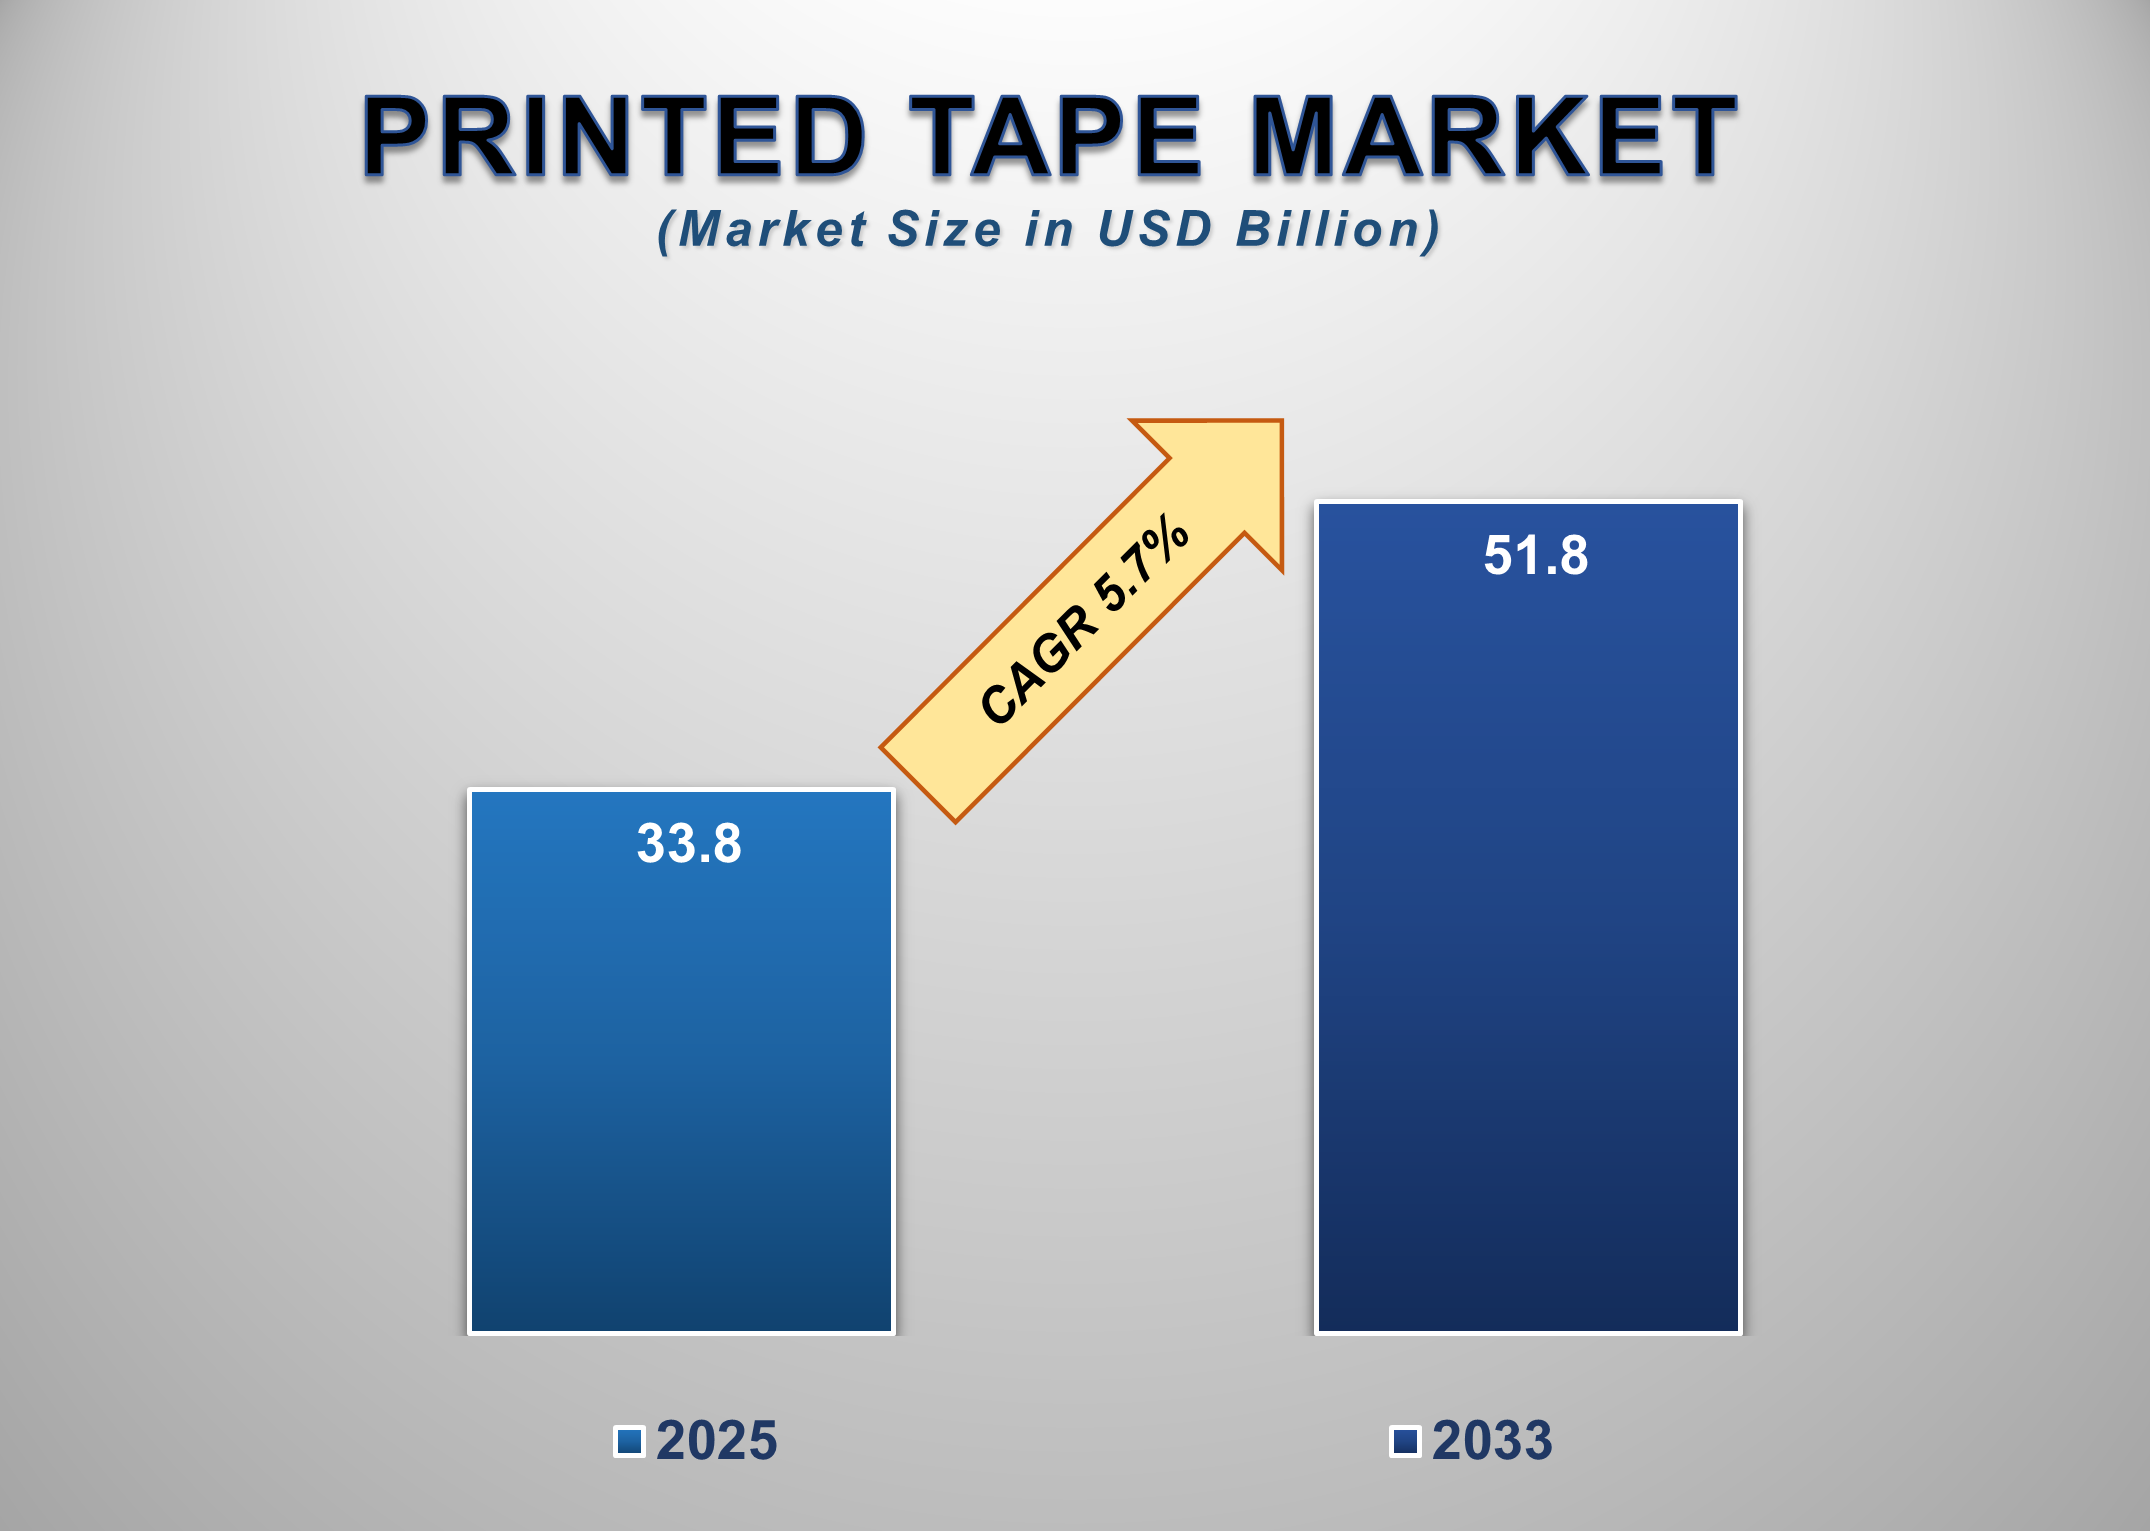
The global Printed Tape Market is witnessing steady expansion as industries increasingly prioritize branded packaging, traceability, product differentiation, and regulatory-compliant labeling. Valued at USD 33.8 billion in 2025, the market is projected to reach USD 51.8 billion by 2033, reflecting a CAGR of 5.7% during the forecast period. Printed tapes used for sealing, branding, identification, safety messaging, and logistics operations have become integral across manufacturing, retail, e-commerce, and distribution channels. The surge in global goods movement, growth of digital commerce platforms, and rise of automated packaging processes are accelerating adoption, especially in fast-moving sectors like food & beverages and transportation & logistics.
Printed tapes also serve as an
economical branding solution compared to pre-printed packaging boxes, allowing
companies to enhance visibility without increasing packaging complexity. The
ability to integrate barcodes, QR codes, batch details, and security features
is further elevating demand across compliance-heavy industries.
Printed
Tape Market Drivers and Opportunities
Rising Need for Branded and
Tamper-Evident Packaging Is Driving the Printed Tape Market Growth
Brand recognition and
reputational consistency across supply chains have become critical for
companies operating in increasingly competitive global markets. Printed tapes
offer a cost-effective and prominent surface for branding, logo placement, and
promotional messaging without requiring changes in primary packaging. This
feature makes them highly attractive to mid-sized and large enterprises seeking
packaging uniformity at scale. As consumer purchase decisions become more
influenced by recognizable packaging, businesses across food & beverage,
FMCG, electronics, and e-commerce sectors are adopting printed tapes to
reinforce brand identity during transit. Tamper-evident and security-integrated
printed tapes are another major growth driver, especially in pharmaceuticals,
electronics, and high-value consumer goods. The ability to incorporate
anti-counterfeit patterns, batch numbers, holographic prints, and void
messaging enhances shipment integrity while meeting regulatory compliance
requirements. E-commerce penetration continues to surge worldwide, increasing
parcel volumes and heightening the need for secure, traceable, and visually
distinct packaging. Printing technologies such as flexography, digital
printing, and UV-cured inks further enable high-resolution customization, color
accuracy, and rapid changeovers, making short-run and on-demand printing more
viable for brands. As supply chains globalize and product authentication
becomes more complex, the combined value proposition of branding, security, and
cost-efficiency is driving sustained adoption of printed tapes across
industries.
Expansion of E-commerce and
Logistics Networks Is Fueling Demand for Printed Tape Worldwide
The global expansion of
e-commerce platforms, parcel delivery services, and third-party logistics
networks is significantly boosting demand for printed tapes. With billions of
packages shipped annually, companies are increasingly utilizing printed tapes for
brand visibility, package tracking, and handling instructions. As customers
expect faster deliveries and enhanced unboxing experiences, logistics-dependent
industries are leveraging printed tapes to improve operational efficiency and
brand connection. Printed tapes help logistics operators convey essential
information such as “Fragile,” “Handle with Care,” or directional arrows,
reducing product damage and improving warehouse handling accuracy. Moreover,
the rise of automated sorting systems in distribution centers requires clear
visual cues and scannable elements on packaging; printed tapes serve as an
optimal solution by integrating barcodes and QR codes that support traceability
at each touchpoint.
Sustainability trends are also
reshaping the logistics industry’s use of tapes. Many companies are
transitioning to recyclable polypropylene and eco-friendly water-based inks.
These advancements align with global commitments to green packaging and help reduce
environmental impact without compromising performance. As global shipping
volumes continue to grow, driven by cross-border e-commerce, retail
modernization, and digital marketplaces, the need for durable, informative, and
brand-enhancing printed tapes is expected to rise substantially through 2033.
Growing Adoption of Printed
Tape Solutions in Emerging Manufacturing Economies Is Creating Significant
Market Opportunities Globally
Emerging economies in
Asia-Pacific, Latin America, and Eastern Europe are witnessing accelerated
industrialization, growth in manufacturing output, and expansion of
export-driven sectors, all contributing to expanding opportunities for printed
tape manufacturers. As factories modernize and adopt automated packaging lines,
printed tapes are increasingly relied upon for identification, branding, and
compliance labeling across high-volume industries such as food processing,
consumer durables, automotive components, and textiles. In regions like
Southeast Asia and India, rapid urbanization and the proliferation of modern
retail chains are driving the demand for packaged goods, consequently
increasing tape consumption. Small and medium-sized enterprises (SMEs) are also
transitioning from generic sealing tape to customized printed solutions to
enhance product differentiation and reduce counterfeiting risks. Government
policies that promote domestic manufacturing, including Make in India, Thailand
4.0, and Vietnam’s industrial expansion programs, further amplify demand for
supply chain packaging materials. As international trade volumes rise,
exporters in emerging markets use printed tapes to comply with
destination-country labeling norms and improve shipment identification for
logistics partners. The growing availability of low-cost digital printing
solutions and local converting facilities is enabling faster turnaround times
and improved customization capabilities. Collectively, these trends position
emerging economies as attractive markets for capacity expansion, partnerships,
and product diversification within the printed tape industry.
Printed Tape Market Scope
|
Report Attributes |
Description |
|
Market Size in 2025 |
USD 33.8 Billion |
|
Market Forecast in 2033 |
USD 51.8 Billion |
|
CAGR % 2025-2033 |
5.7% |
|
Base Year |
2024 |
|
Historic Data |
2020-2024 |
|
Forecast Period |
2025-2033 |
|
Report USP |
Production, Consumption,
Company Share, Company Heatmap, Company Production Capacity, Growth Factors,
and more |
|
Segments Covered |
●
By Material, By
End-use |
|
Regional Scope |
●
North America ●
Europe ●
APAC ●
Latin America ●
Middle East and
Africa |
|
Country Scope |
1)
U.S. 2)
Canada 3)
Germany 4)
UK 5)
France 6)
Spain 7)
Italy 8)
Switzerland 9)
China 10)
Japan 11)
India 12)
Australia 13)
South Korea 14)
Brazil 15)
Mexico 16)
Argentina 17)
South Africa 18)
Saudi Arabia 19)
UAE |
Printed Tape Market Report Segmentation Analysis
Based on segmentation, the
Printed Tape Market is categorized by Material, by End-use, and by Region.
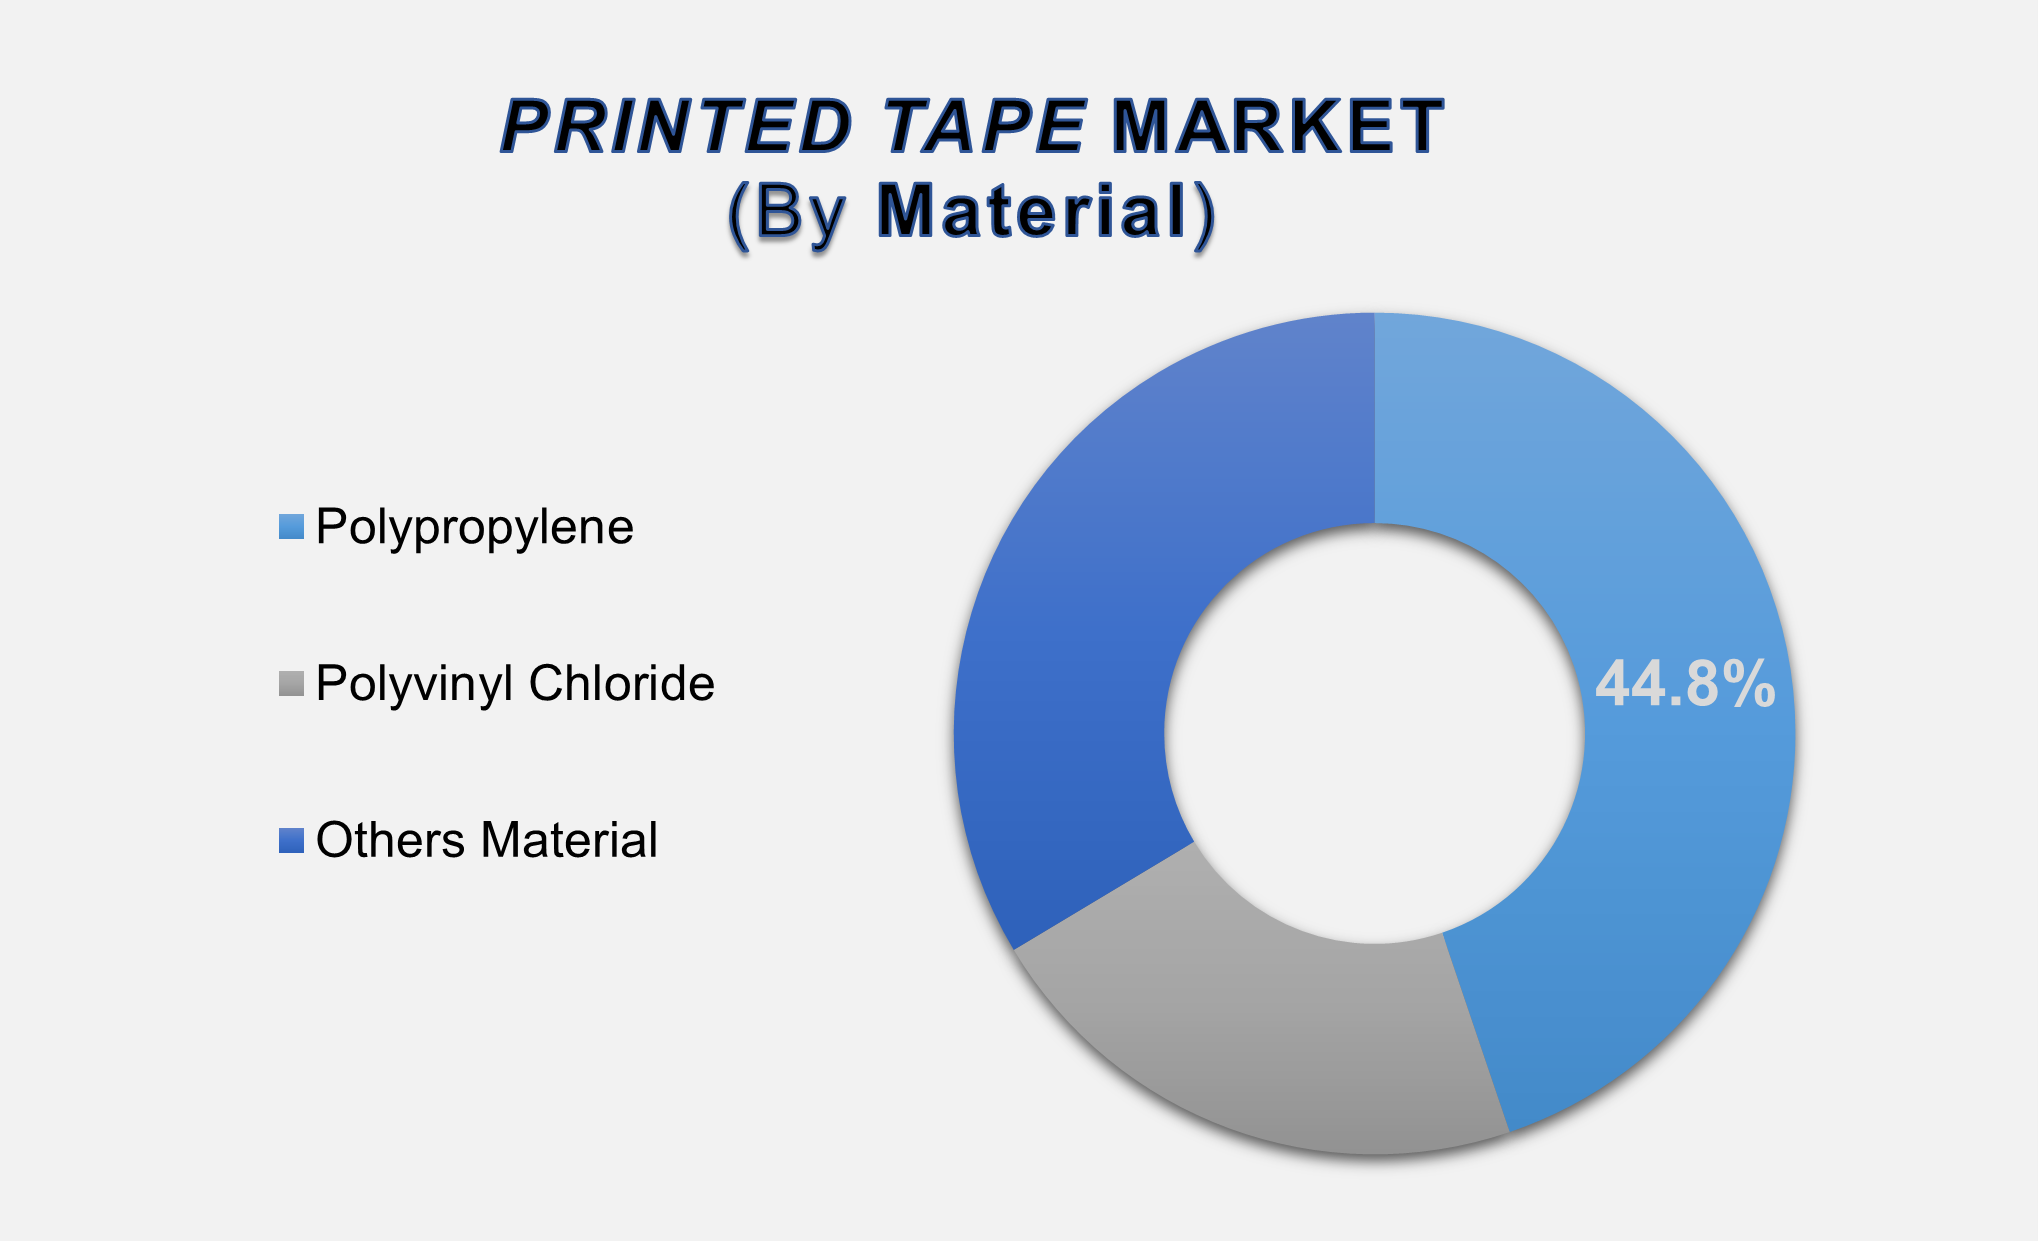
The Polypropylene Segment
Accounted for the Largest Market Share in the Global Printed Tape Market
The polypropylene segment, contributing 44.8% of the global market, remains the leading material due to its excellent tensile strength, moisture resistance, affordability, and compatibility with high-resolution printing processes. Polypropylene tapes are widely used for carton sealing, branding, and product identification across high-volume industries such as food & beverage, electronics, and consumer goods. Their ability to support vibrant colors and maintain adhesive consistency across varying temperatures makes them suitable for both manual and automated packaging lines. As sustainability becomes increasingly central to packaging decisions, polypropylene’s recyclability further strengthens its market position. Continuous advancements in BOPP films, water-based inks, and adhesive technologies are enhancing durability and visual sharpness, boosting adoption across retail and logistics. With growing industrial output and e-commerce activity, demand for polypropylene-printed tapes is expected to remain dominant throughout the forecast period.
Food & Beverage Segment
Accounted for the Largest Share in the Global Printed Tape Market
The food & beverage sector
represents the largest end-use category, driven by the need for branded
packaging, batch identification, and clear handling instructions across
distribution chains. As packaged food consumption rises globally, especially in
APAC and North America, manufacturers are increasingly adopting printed tapes
to improve product visibility, enhance operational traceability, and support
temperature-sensitive logistics. Printed tapes are frequently used to display
safety warnings, freshness indicators, and regulatory compliance details. For
FMCG brands with high market competition, printed sealing tapes serve as a
low-cost, high-visibility branding tool that strengthens shelf presence and
customer recall. The expanding penetration of ready-to-eat meals, beverages,
and processed foods—coupled with rapid growth in modern retail and e-commerce
grocery delivery—is further amplifying tape usage. This segment will continue
to dominate, supported by stringent food labeling requirements and continuous innovation
in moisture-resistant and tamper-evident tape formats.
The following segments are
part of an in-depth analysis of the global Printed Tape Market:
|
Market
Segments |
|
|
By Material |
●
Polypropylene ●
Polyvinyl Chloride ●
Others Material |
|
By End Use |
●
Food & Beverage ●
Consumer Durables ●
Transportation &
Logistics ●
Others End Use |
Printed
Tape Market Share Analysis by Region
The
Asia Pacific region is projected to hold the largest share of the global
Printed Tape market over the forecast period.
Asia-Pacific accounted for 49.4%
of the global printed tape market, making it the largest and most influential
regional segment. APAC's leadership is underpinned by high manufacturing
activity, strong export volumes, and rapid growth in packaging-intensive
sectors like food processing, consumer durables, and transportation &
logistics. China, India, Indonesia, and Vietnam are major contributors, with
massive production ecosystems and extensive use of printed tapes for branding,
shipment labeling, and material handling. Competitive labor costs, availability
of raw materials, and strong investment inflows into industrial automation
strengthen the region’s dominance. Growing adoption of modern retail and the
booming e-commerce sector further expands demand for high-quality printed
tapes.
Meanwhile, North America is
expected to witness the fastest CAGR, driven by stringent quality standards,
technological upgrades in printing, and demand for sustainable packaging.
Europe remains a mature market with an emphasis on eco-friendly materials and
regulatory-compliant labeling.
Printed Tape Market Competition Landscape Analysis
The Printed Tape Market is moderately fragmented, with
global players competing alongside regional manufacturers offering customized
and cost-efficient solutions. Leading companies focus on expanding production
capabilities, launching eco-friendly adhesive technologies, and integrating
advanced printing methods such as UV digital and flexographic systems.
Strategic partnerships with logistics providers, packaging converters, and FMCG
companies are common to strengthen market penetration.
Global Printed Tape Market Recent Developments News:
- In
September 2024, Shurtape
Technologies, LLC, acquired
Preferred Finishing Technologies, LLC, a specialist in inkjet dye
sublimation printing and fabric finishing. This strategic acquisition
formalizes and strengthens the companies' long-standing 15-year
partnership, expanding Shurtape's capabilities in advanced textile
manufacturing.
- In
August 2024, Shurtape Technologies, LLC, redesigned its premium DC 181 HVAC
tape to feature red lettering on a metallic film background. This product
enhancement directly addresses inspector preferences for "red-letter
tape" during HVAC system inspections, improving compliance visibility
and market alignment.
The Global Printed Tape Market is dominated by a few
large companies, such as
●
3M Company
●
Avery Dennison
●
Brady Corporation
●
CCL Industries
●
HellermannTyton
●
Panduit
●
Seton Identification
Products
●
Tesa SE
●
Uline
●
Weber Packaging
●
Stamptech
●
Nadco Tapes &
Labels
●
Jet Label
●
Pacproinc
●
Walle
● Other Prominent Players
Frequently Asked Questions
Jaya Bundele (Research Analyst)
Jaya Bundele is a skilled Research Analyst with 4+ years of experience in market intelligence, consumer insights, competitive analysis, and industry forecasting across the consumer goods, agriculture, and food & beverage sectors. She specializes in market sizing, trend analysis, growth opportunity mapping, and strategic secondary research for global and regional markets.
Her expertise lies in transforming complex industry data into actionable business strategies that help organizations identify emerging trends, understand customer behavior, and gain a competitive edge. With a strong focus on data-driven insights, business intelligence, and future market trends, Jaya delivers high-quality research solutions aligned with evolving industry demands and market dynamics.
1. Global Printed Tape Market
Introduction and Market Overview
1.1.
Objectives
of the Study
1.2.
Global
Printed Tape Market Scope and Market Estimation
1.2.1.Global Printed Tape Overall
Market Size (US$ Bn), Market CAGR (%), Market forecast (2025 - 2033)
1.2.2.Global Printed Tape Market
Revenue Share (%) and Growth Rate (Y-o-Y) from 2020 - 2033
1.3.
Market
Segmentation
1.3.1.Material of Global Printed
Tape Market
1.3.2.End Use of Global Printed
Tape Market
1.3.3.Region of Global Printed
Tape Market
2. Executive
Summary
2.1.
Demand
Side Trends
2.2.
Key
Market Trends
2.3.
Market
Demand (US$ Bn) Analysis 2020 – 2024 and Forecast, 2025 – 2033
2.4.
Demand
and Opportunity Assessment
2.5.
Demand
Supply Scenario
2.6.
Market
Dynamics
2.6.1.Drivers
2.6.2.Limitations
2.6.3.Opportunities
2.6.4.Impact Analysis of Drivers
and Restraints
2.7.
Emerging
Trends for Printed Tape Market
2.8.
Porter’s
Five Forces Analysis
2.9.
PEST
Analysis
2.10.
Key
Regulation
3. Global
Printed Tape Market Estimates
& Historical Trend Analysis (2020 - 2024)
4. Global
Printed Tape Market Estimates
& Forecast Trend Analysis, by Material
4.1.
Global
Printed Tape Market Revenue (US$ Bn) Estimates and Forecasts, by Material, 2020
- 2033
4.1.1.Polypropylene
4.1.2.Polyvinyl Chloride
4.1.3.Others Material
5. Global
Printed Tape Market Estimates
& Forecast Trend Analysis, by End Use
5.1.
Global
Printed Tape Market Revenue (US$ Bn) Estimates and Forecasts, by End Use, 2020
- 2033
5.1.1.Food & Beverage
5.1.2.Consumer Durables
5.1.3.Transportation &
Logistics
5.1.4.Others End Use
6. Global
Printed Tape Market Estimates
& Forecast Trend Analysis, by Region
6.1.
Global
Printed Tape Market Revenue (US$ Bn) Estimates and Forecasts, by Region, 2020 -
2033
6.1.1.North America
6.1.2.Europe
6.1.3.Asia Pacific
6.1.4.Middle East & Africa
6.1.5.Latin America
7. North America Printed
Tape Market: Estimates & Forecast
Trend Analysis
7.1.
North
America Printed Tape Market Assessments & Key Findings
7.1.1.North America Printed Tape
Market Introduction
7.1.2.North America Printed Tape
Market Size Estimates and Forecast (US$ Billion) (2020 - 2033)
7.1.2.1. By Material
7.1.2.2. By End Use
7.1.2.3.
By
Country
7.1.2.3.1. The U.S.
7.1.2.3.2. Canada
8. Europe Printed
Tape Market: Estimates & Forecast
Trend Analysis
8.1.
Europe
Printed Tape Market Assessments & Key Findings
8.1.1.Europe Printed Tape Market
Introduction
8.1.2.Europe Printed Tape Market
Size Estimates and Forecast (US$ Billion) (2020 - 2033)
8.1.2.1. By Material
8.1.2.2. By End Use
8.1.2.3.
By
Country
8.1.2.3.1.
Germany
8.1.2.3.2.
Italy
8.1.2.3.3.
U.K.
8.1.2.3.4.
France
8.1.2.3.5.
Spain
8.1.2.3.6.
Switzerland
8.1.2.3.7. Rest
of Europe
8.1.2.3.8.
9. Asia Pacific Printed
Tape Market: Estimates & Forecast
Trend Analysis
9.1.
Asia
Pacific Market Assessments & Key Findings
9.1.1.Asia Pacific Printed Tape
Market Introduction
9.1.2.Asia Pacific Printed Tape
Market Size Estimates and Forecast (US$ Billion) (2020 - 2033)
9.1.2.1. By Material
9.1.2.2. By End Use
9.1.2.3.
By
Country
9.1.2.3.1.
China
9.1.2.3.2.
Japan
9.1.2.3.3.
India
9.1.2.3.4.
Australia
9.1.2.3.5.
South
Korea
9.1.2.3.6. Rest of Asia Pacific
10. Middle East & Africa Printed
Tape Market: Estimates & Forecast
Trend Analysis
10.1.
Middle
East & Africa Market Assessments & Key Findings
10.1.1.
Middle East & Africa Printed Tape Market Introduction
10.1.2.
Middle East & Africa Printed Tape Market Size Estimates
and Forecast (US$ Billion) (2020 - 2033)
10.1.2.1. By Material
10.1.2.2. By End Use
10.1.2.3.
By
Country
10.1.2.3.1. UAE
10.1.2.3.2. Saudi
Arabia
10.1.2.3.3. South
Africa
10.1.2.3.4. Rest
of MEA
11. Latin America
Printed Tape Market: Estimates &
Forecast Trend Analysis
11.1.
Latin
America Market Assessments & Key Findings
11.1.1.
Latin
America Printed Tape Market Introduction
11.1.2.
Latin
America Printed Tape Market Size Estimates and Forecast (US$ Billion) (2020 - 2033)
11.1.2.1. By Material
11.1.2.2. By End Use
11.1.2.3.
By
Country
11.1.2.3.1. Brazil
11.1.2.3.2. Argentina
11.1.2.3.3. Mexico
11.1.2.3.4. Rest
of LATAM
12. Country Wise Market:
Introduction
13.
Competition
Landscape
13.1.
Global
Printed Tape Market Material Mapping
13.2.
Global
Printed Tape Market Concentration Analysis, by Leading Players / Innovators /
Emerging Players / New Entrants
13.3.
Global
Printed Tape Market Tier Structure Analysis
13.4.
Global
Printed Tape Market Concentration & Company Market Shares (%) Analysis, 2024
14.
Company
Profiles
14.1.
3M
14.1.1.
Company
Overview & Key Stats
14.1.2.
Financial
Performance & KPIs
14.1.3.
Material
Portfolio
14.1.4.
SWOT
Analysis
14.1.5.
Business
Strategy & Recent Developments
* Similar details would be provided for all the players
mentioned below
14.2. Avery
Dennison
14.3. Brady
Corporation
14.4. CCL
Industries
14.5. HellermannTyton
14.6. Panduit
14.7. Seton
Identification Products
14.8. Tesa SE
14.9. Uline
14.10. Weber
Packaging
14.11. Stamptech
14.12. Nadco
Tapes & Labels
14.13. Jet
Label
14.14. Pacproinc
14.15. Walle
14.16. Others
15. Research
Methodology
15.1.
External
Transportations / Databases
15.2.
Internal
Proprietary Database
15.3.
Primary
Research
15.4.
Secondary
Research
15.5.
Assumptions
15.6.
Limitations
15.7.
Report
FAQs
16. Research
Findings & Conclusion
Our Research Methodology
"Insight without rigor is just noise."
We follow a comprehensive, multi-phase research framework designed to deliver accurate, strategic, and decision-ready intelligence. Our process integrates primary and secondary research , both quantitative and qualitative , along with dual modeling techniques ( top-down and bottom-up) and a final layer of validation through our proprietary in-house repository.
PRIMARY RESEARCH
Primary research captures real-time, firsthand insights from the market to understand behaviors, motivations, and emerging trends.
1. Quantitative Primary Research
Objective: Generate statistically significant data directly from market participants.
Approaches:- Structured surveys with customers, distributors, and field agents
- Mobile-based data collection for point-of-sale audits and usage behavior
- Phone-based interviews (CATI) for market sizing and product feedback
- Online polling around industry events and digital campaigns
- Purchase frequency by customer type
- Channel performance across geographies
- Feature demand by application or demographic
2. Qualitative Primary Research
Objective: Explore decision-making drivers, pain points, and market readiness.
Approaches:- In-depth interviews (IDIs) with executives, product managers, and key decision-makers
- Focus groups among end users and early adopters
- Site visits and observational research for consumer products
- Informal field-level discussions for regional and cultural nuances
SECONDARY RESEARCH
This phase helps establish a macro-to-micro understanding of market trends, size, regulation, and competitive dynamics, sourced from credible and public domain information.
1. Quantitative Secondary Research
Objective: Model market value and segment-level forecasts based on published data.
Sources include:- Financial reports and investor summaries
- Government trade data, customs records, and regulatory statistics
- Industry association publications and economic databases
- Channel performance and pricing data from marketplace listings
- Revenue splits, pricing trends, and CAGR estimates
- Supply-side capacity and volume tracking
- Investment analysis and funding benchmarks
2. Qualitative Secondary Research
Objective: Capture strategic direction, innovation signals, and behavioral trends.
Sources include:- Company announcements, roadmaps, and product pipelines
- Publicly available whitepapers, conference abstracts, and academic research
- Regulatory body publications and policy briefs
- Social and media sentiment scanning for early-stage shifts
- Strategic shifts in market positioning
- Unmet needs and white spaces
- Regulatory triggers and compliance impact

DUAL MODELING: TOP-DOWN + BOTTOM-UP
To ensure robust market estimation, we apply two complementary sizing approaches:
Top-Down Modeling:- Start with broader industry value (e.g., global or regional TAM)
- Apply filters by segment, geography, end-user, or use case
- Adjust with primary insights and validation benchmarks
- Ideal for investor-grade market scans and opportunity mapping
- Aggregate from the ground up using sales volumes, pricing, and unit economics
- Use internal modeling templates aligned with stakeholder data
- Incorporate distributor-level or region-specific inputs
- Most accurate for emerging segments and granular sub-markets
DATA VALIDATION: IN-HOUSE REPOSITORY
We close the loop with proprietary data intelligence built from ongoing projects, industry monitoring, and historical benchmarking. This repository includes:
- Multi-sector market and pricing models
- Key trendlines from past interviews and forecasts
- Benchmarked adoption rates, churn patterns, and ROI indicators
- Industry-specific deviation flags and cross-check logic
- Catches inconsistencies early
- Aligns projections across studies
- Enables consistent, high-trust deliverables