
Reverse Logistics Market Size and Forecast (2020 - 2033), Global and Regional Growth, Trend, Share, and Industry Analysis Report Coverage: By Return Type (Repairs & Returns, Commercial Returns, End-of-Life Returns and Recalls), By Service (Returns Management, Refurbishment, Remanufacturing, Packaging and Others), By End-User (E-commerce, Automotive, Pharmaceutical, Consumer Electronics, Retail and Others), and Geography
2025-12-02
Automotive & Transportation (Mobility)
Ekta Chaurasia (Team Lead)
Description
Reverse Logistics Market Overview
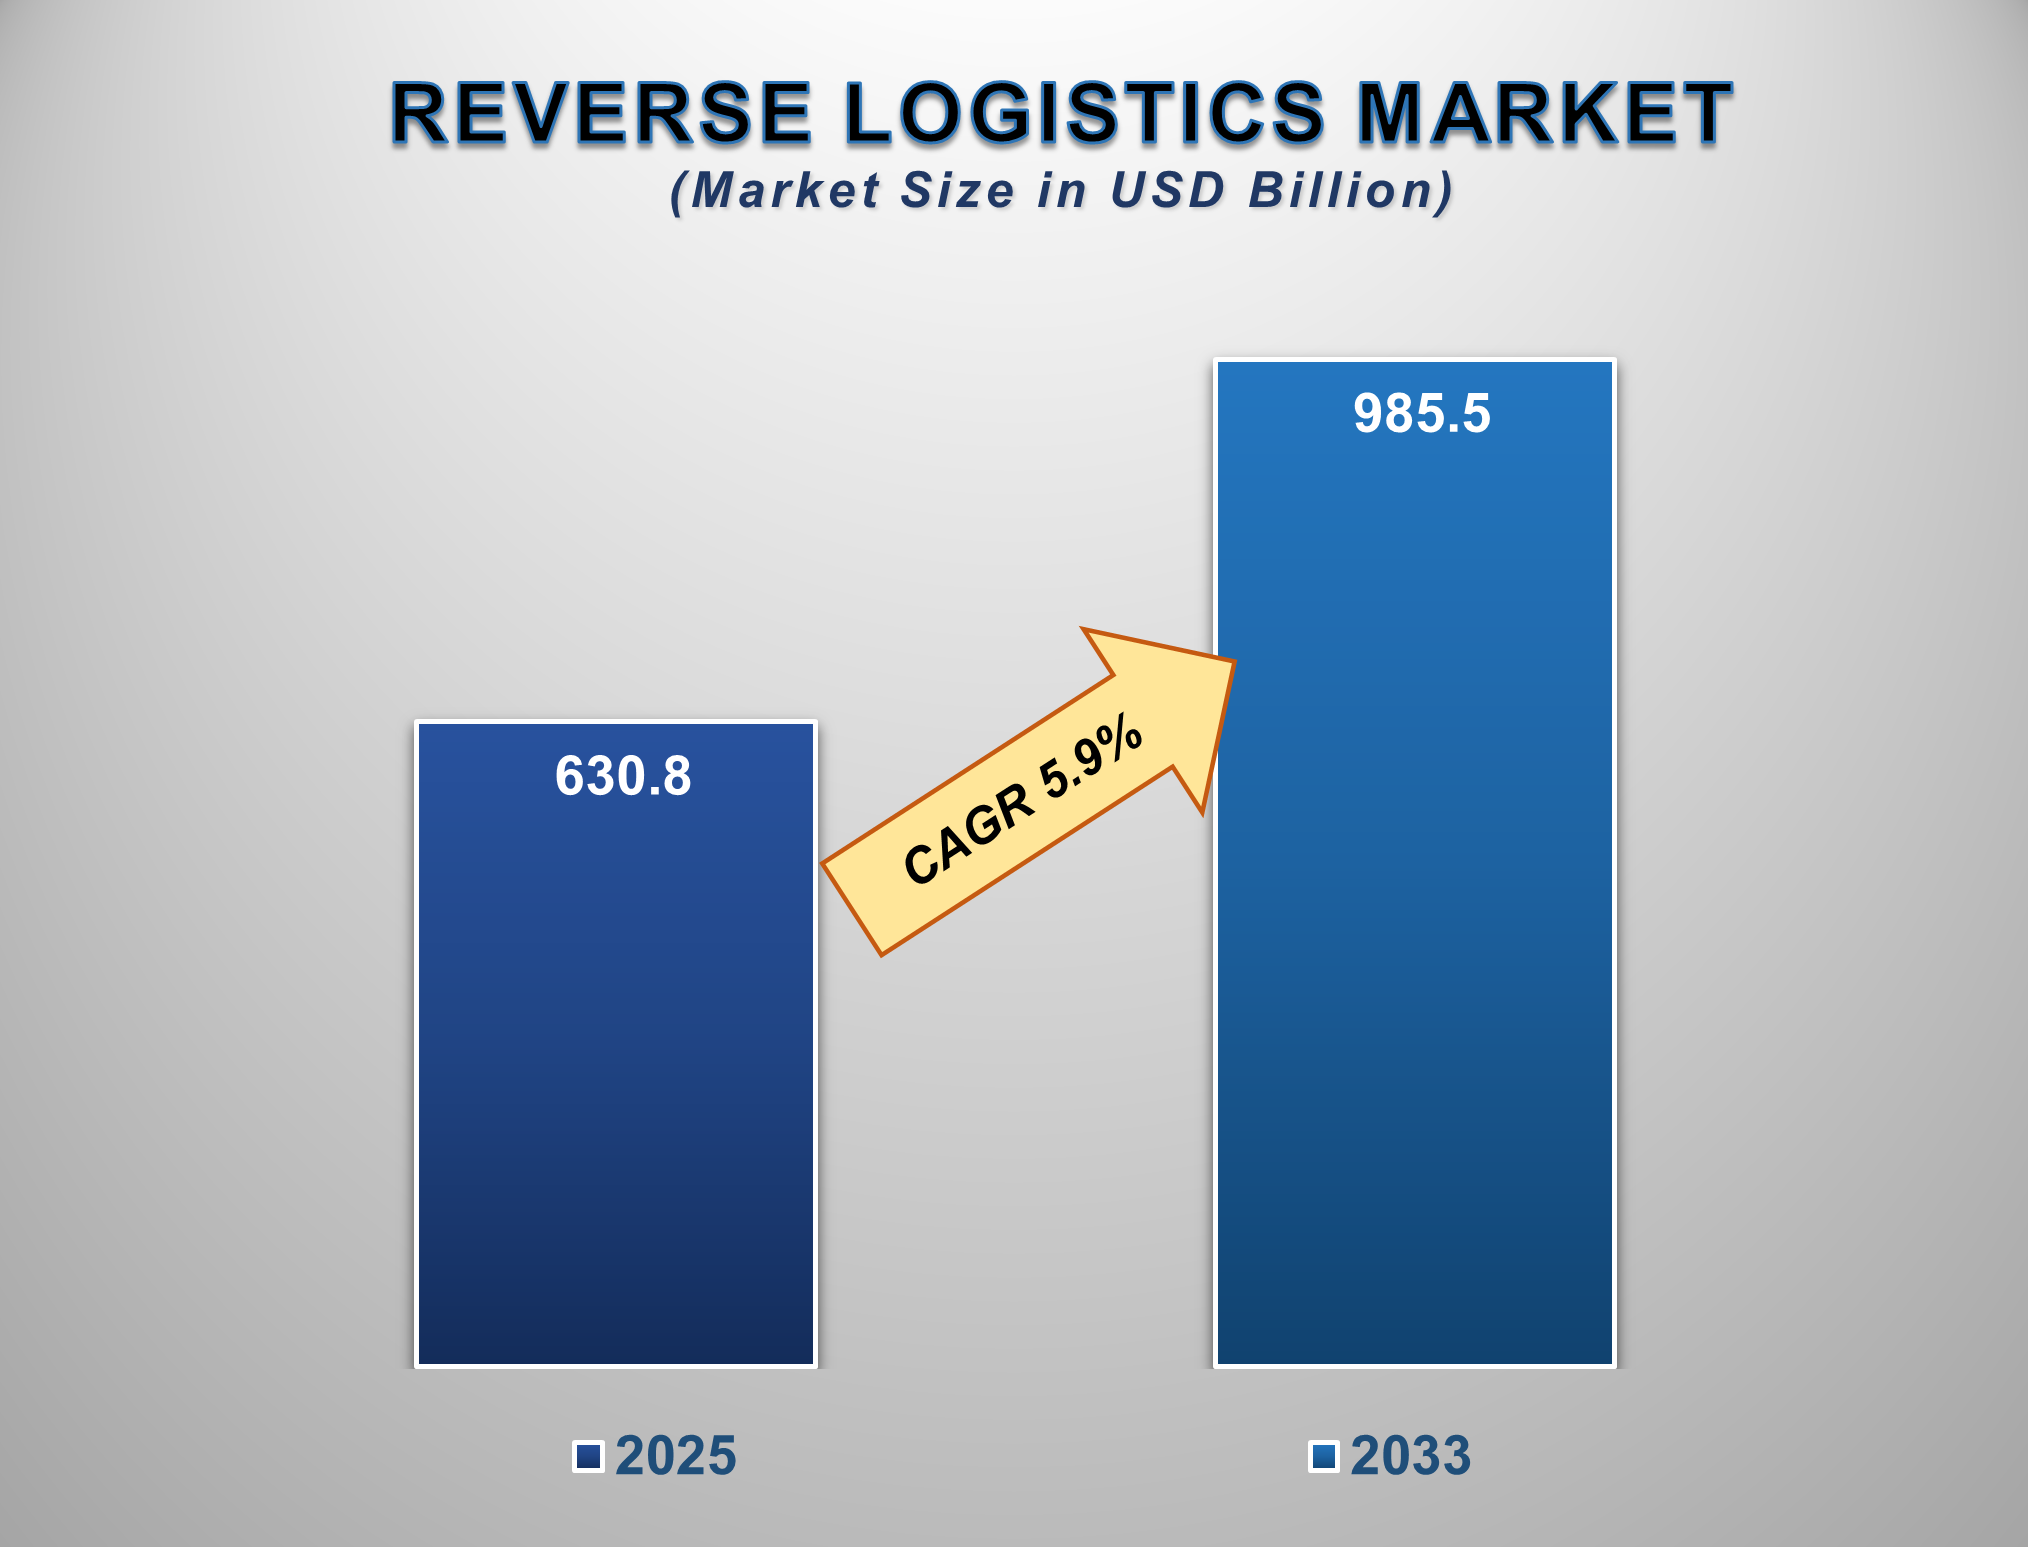
The Reverse Logistics Market is poised for a period of robust and strategic growth from 2025 to 2033, fueled by the explosive expansion of e-commerce, rising consumer expectations for returns, stringent environmental regulations, and the growing economic imperative of value recovery from returned goods. The market is projected to be valued at approximately USD 630.8 billion in 2025 and is forecasted to reach nearly USD 985.5 billion by 2033, exhibiting a compound annual growth rate (CAGR) of 5.9% during this period.
Reverse logistics encompasses all operations
related to the reverse flow of products from their final destination for the
purpose of capturing value, returns management, or proper disposal. This
includes processes for returns management, remanufacturing, refurbishment,
recycling, and resale. The market's significant expansion is primarily driven
by the global e-commerce boom, which has fundamentally increased the volume of
product returns, making efficient reverse logistics a critical competitive
differentiator.
Furthermore, increasing consumer awareness of
sustainability and circular economy principles is pushing companies to adopt
responsible end-of-life product management practices. Supportive government
regulations regarding e-waste and product disposal, coupled with the
significant cost savings and revenue generation opportunities from recovered
assets, are significantly contributing to market growth. North America
currently holds a significant market share due to its mature e-commerce sector
and high consumption rates, while the Asia-Pacific region is expected to
witness the fastest growth, driven by its rapidly expanding online retail
markets and increasing manufacturing activities.
Reverse
Logistics Market Drivers and Opportunities
The Exponential Growth of E-commerce and
Evolving Consumer Return Policies is the Primary Market Driver
The relentless growth of the global e-commerce
sector is the most powerful force propelling the reverse logistics market. The
convenience of online shopping inherently leads to a higher rate of product
returns compared to brick-and-mortar retail, driven by factors such as
"bracketing" (ordering multiple sizes), products not matching
descriptions, and simple buyer's remorse. In highly competitive markets,
retailers have adopted liberal and free return policies to attract and retain
customers, further increasing the volume of reverse flows. This has transformed
reverse logistics from a cost-centric, back-office function into a strategic
front-office priority. Efficient and hassle-free returns are now a key factor
in customer loyalty and repurchase decisions. The sheer scale of returned
goods, spanning from electronics and apparel to furniture, creates an immense
operational and financial burden, making the optimization of reverse logistics
processes essential for profitability and customer satisfaction.
The global e-commerce market continues its
meteoric rise, fundamentally reshaping retail and consumer behavior. In 2024, worldwide e-commerce sales are estimated to exceed
$6.3 trillion, accounting for over 21% of total retail sales. This figure is
projected to grow to over $8.1 trillion by 2027. This growth is underpinned by
increasing internet and smartphone penetration, secure digital payment systems,
and the post-pandemic normalization of online shopping. The Asia-Pacific region
leads in market share, driven by giants like China and India, but significant
growth is observed across North America and Europe. This data underscores the
immense scale of the digital marketplace and highlights the corresponding
logistical challenge and opportunity presented
by the parallel surge in product returns, which can range from 20% to over 30%
of all e-commerce sales, depending on the
product category.
The Imperative of Sustainability and the
Circular Economy is Driving Strategic Adoption
The global push towards sustainability and the
formalization of circular economy models is a powerful catalyst for the reverse
logistics market. Businesses are facing increasing pressure from consumers,
investors, and regulators to minimize their environmental footprint and
demonstrate corporate social responsibility. Effective reverse logistics is the
operational backbone of the circular economy, enabling the recovery,
refurbishment, and reintegration of products and materials back into the supply
chain. This process reduces waste sent to landfills, conserves raw materials,
and lowers the carbon emissions associated with manufacturing new products.
Legislation, such as Extended Producer Responsibility (EPR) laws, which hold
manufacturers accountable for the entire lifecycle of their products, including
end-of-life disposal, is compelling industries to invest in sophisticated
reverse logistics networks. This shift transforms returned or end-of-life
products from liabilities into valuable assets for material recovery and
sustainable practice.
The Emergence of Advanced Technologies and
the Value of Secondary Markets Present Significant Opportunities
The strategic integration of technology and the
development of robust resale channels are creating significant growth frontiers
for the reverse logistics market. Key opportunities lie in the application of
advanced technologies like Artificial Intelligence (AI) and the Internet of
Things (IoT) to optimize reverse supply chains. AI-powered systems can automate
returns authorization, determine the optimal disposition (e.g., restock,
refurbish, recycle), and dynamically route products, thereby reducing processing
costs and time. IoT sensors can track returned assets and monitor their
condition in transit. Furthermore, the burgeoning secondary market for
refurbished and open-box goods, particularly in high-value categories like
consumer electronics, represents a massive revenue-generating opportunity. For
logistics providers and retailers, investing in automation for warehouse
sorting, developing AI-driven analytics platforms for returns management, and
building dedicated sales channels for refurbished products are key strategies
to capture untapped market potential and turn reverse logistics into a profit
center.
Reverse Logistics Market
Scope
|
Report Attributes |
Description |
|
Market Size in 2025 |
USD 630.8 Billion |
|
Market Forecast in 2033 |
USD 985.5 Billion |
|
CAGR % 2025-2033 |
5.9% |
|
Base Year |
2024 |
|
Historic Data |
2020-2024 |
|
Forecast Period |
2025-2033 |
|
Report USP |
Product Portfolio,
Technological Analysis, Company Market Share, Company Heatmap, Pricing
Analysis, Growth Factors, and more |
|
Segments Covered |
●
By Return Type ●
By Service ●
By End-user |
|
Regional Scope |
●
North America, ●
Europe, ●
APAC, ●
Latin America ●
Middle East and
Africa |
|
Country Scope |
1)
U.S. 2)
Canada 3)
Germany 4)
UK 5)
France 6)
Spain 7)
Italy 8)
Switzerland 9)
China 10)
Japan 11)
India 12)
Australia 13)
South Korea 14)
Brazil 15)
Mexico 16)
Argentina 17)
South Africa 18)
Saudi Arabia 19)
UAE |
Reverse Logistics Market
Report Segmentation Analysis
The global Reverse Logistics
Market industry analysis is segmented by Return Type, by Service, by End-User,
and by Region.
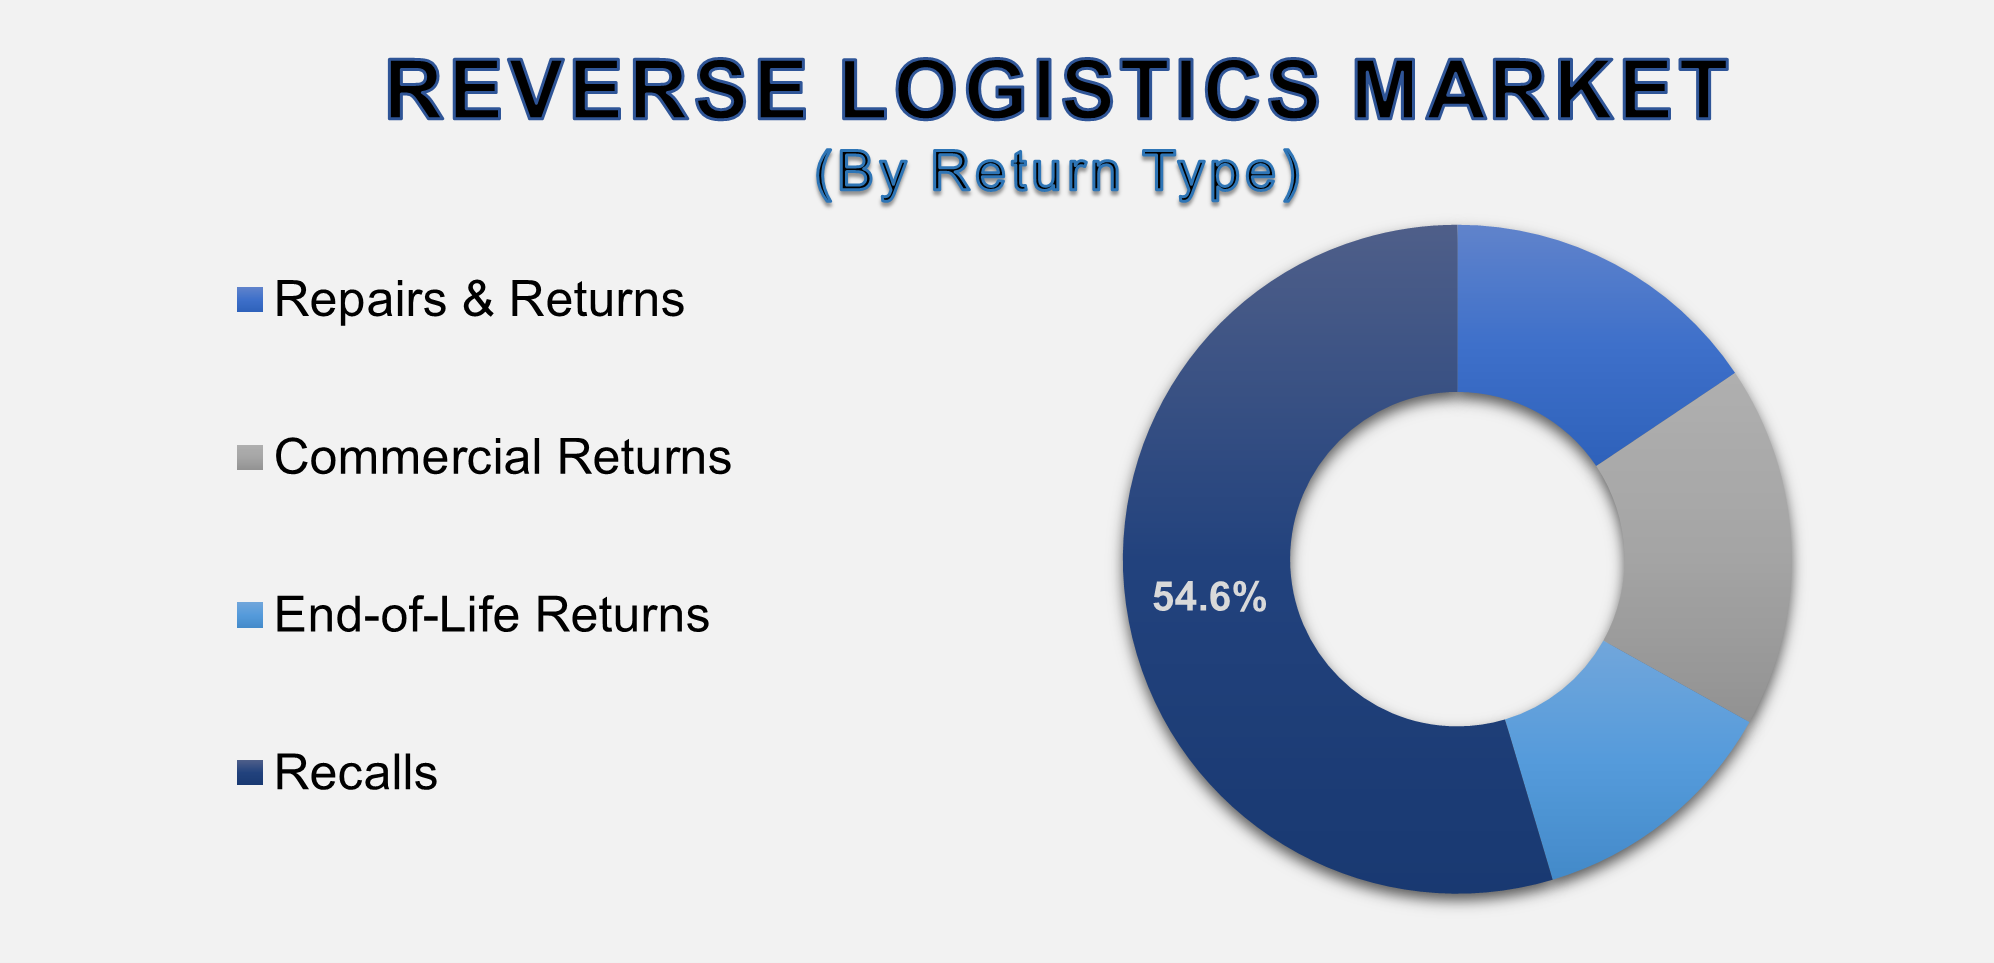
The Recalls Return Type segment is anticipated to
command a significant market share in 2025
The Return Type segment is categorized
into Repairs & Returns, Commercial Returns, End-of-Life Returns, and
Recalls. The recalls segment holds a substantial and critical share of the
market due to the high-stakes and complex nature of the process. Product
recalls, whether mandated by regulatory bodies or initiated voluntarily by
manufacturers, involve the coordinated reverse flow of potentially millions of
units from distributors, retailers, and consumers. This process is logistically
intensive, requiring meticulous tracking, specialized handling (especially for
hazardous or defective goods), and often, destruction or complex remediation.
The high costs associated with managing a recall, coupled with the severe
reputational and legal risks of mishandling, compel companies to rely on expert
reverse logistics providers. The critical importance of efficiency, compliance,
and transparency in recall management ensures this segment remains a major and
high-value component of the reverse logistics market.
The Refurbishment Service segment is projected to
grow at a significant CAGR.
The Service segment includes Returns Management,
Refurbishment, Remanufacturing, Packaging, and Others. The refurbishment
service segment's projected significant growth is directly linked to the
powerful economic and environmental logic of the circular economy.
Refurbishment involves restoring a returned product to a like-new condition,
often with updated software or replaced components, so it can be resold in
secondary markets. This process captures significant value from products that
would otherwise be sold at a deep discount or written off as a loss. The
growing consumer acceptance of certified refurbished goods, particularly in the
electronics sector (smartphones, laptops, tablets), is creating a massive and
profitable market. For companies, investing in refurbishment capabilities not
only generates new revenue streams but also enhances brand sustainability
credentials and reduces environmental waste, making it one of the most dynamic
and fast-growing service areas.
The E-commerce end-user
segment is projected to witness the highest growth rate.
The End-User segment is divided into E-commerce,
Automotive, Pharmaceutical, Consumer Electronics, and Retail. The E-commerce
segment's position as the fastest-growing channel is a direct consequence of
the sector's overall expansion and its inherent high-return nature. As
detailed in the market drivers, the volume of returns in e-commerce is immense
and continues to grow in lockstep with online sales. E-commerce companies and
the brands that sell through them are under immense pressure to manage returns
efficiently to protect margins and customer loyalty. This has led to massive
investment in dedicated returns processing centers, sophisticated returns
management software, and partnerships with third-party logistics (3PL)
providers specializing in reverse logistics. The continuous innovation in
"return-to-shelf" speed and the development of seamless return
experiences are powerful forces propelling the explosive growth of reverse
logistics services within the e-commerce industry.
The following segments are part of an in-depth analysis of
the global Reverse Logistics Market:
|
Market
Segments |
|
|
By Return Type |
●
Repairs &
Returns ●
Commercial Returns ●
End-of-Life Returns ●
Recalls |
|
By Service |
●
Returns Management ●
Refurbishment ●
Remanufacturing ●
Packaging ●
Others |
|
By End-user |
●
E-commerce ●
Automotive ●
Pharmaceutical ●
Consumer Electronics ●
Retail ●
Others |
Reverse Logistics Market
Share Analysis by Region
The North America region
is anticipated to hold the largest portion of the Reverse Logistics Market
globally throughout the forecast period.
North America's dominance is attributed to its
massive and mature e-commerce landscape, high consumer purchasing power, and a
well-developed logistics infrastructure. The region has a strong culture of
liberal return policies, which drives a consistently high volume of reverse
flows. Furthermore, the presence of major global retailers and e-commerce
giants, coupled with a stringent regulatory environment for product safety and
recalls (e.g., by the Consumer Product Safety Commission), creates a sustained
demand for sophisticated reverse logistics services. The high level of
technological adoption among logistics providers in North America to manage
these complex processes efficiently solidifies its leading position.
The United States, in particular, is the world's
largest single market for reverse logistics. The country's vast geography,
concentrated consumer base, and highly competitive retail environment make
returns management a critical business function. Major investments in
automation and AI for returns processing are often pioneered in the U.S.
market. The well-established secondary market for refurbished electronics and
other goods also provides a strong economic incentive for efficient value
recovery processes, ensuring a continuous demand for advanced reverse logistics
solutions.
Reverse Logistics Market
Competition Landscape Analysis
The global reverse logistics
market is fragmented and competitive, featuring a mix of global logistics
giants, specialized third-party logistics (3PL) providers, and in-house
operations of large retailers. Competition is intensifying and centers on service
reliability, technological capability, geographic reach, and industry-specific
expertise. Key strategies include significant investment in technology
platforms for returns visibility and management, strategic acquisitions to gain
new capabilities or geographic footholds, and the development of value-added
services like refurbishment and recommerce. The market also sees increasing
competition from tech startups offering AI-driven returns optimization software
and platform-based solutions that connect retailers with logistics networks.
Global Reverse Logistics
Market Recent Developments News:
- In January 2025, UPS announced the expansion of its
dedicated returns facilities across Europe, integrating AI-based sorting
to accelerate processing times for e-commerce returns.
- In November 2024, Optoro, a leading returns
technology platform, partnered with a major European fashion retailer to
implement a data-driven returns solution that increased the resale value of returned goods by 20%.
- In July 2024, Apple Inc. reported a record quarter
for its refurbished products division, highlighting the growing
profitability and consumer demand for certified pre-owned devices,
underpinned by its efficient reverse logistics operations.
- In September 2024, FedEx Corp. launched a new suite of circular
logistics services, focusing on the consolidation and sustainable
processing of end-of-life electronics for corporate clients.
The Global Reverse Logistics Market Is Dominated by a Few
Large Companies, such as
●
United Parcel Service,
Inc. (UPS)
●
FedEx Corporation
●
Deutsche Post DHL
Group
●
XPO Logistics, Inc.
●
GXO Logistics, Inc.
●
Kintetsu World
Express, Inc.
●
Optoro, Inc.
●
Reverse Logistics
Group
●
Liquidity Services,
Inc.
●
Arrow Electronics,
Inc.
●
Hub Group
●
C.H. Robinson
●
Ryder System, Inc.
●
Pitney Bowes Inc.
● Flexport Inc.
Frequently Asked Questions
Ekta Chaurasia (Team Lead)
Ekta Chaurasia is a highly experienced Team Lead at M2Square Consultancy with over 7 years of expertise in market research, strategic consulting, competitive benchmarking, and business intelligence solutions. She specializes in ICT, semiconductors & electronics, automotive & transportation, and industrial machinery markets.
She leads end-to-end global research projects focused on market trends, industry analysis, growth forecasting, customer insights, and strategic decision-making. Known for her analytical leadership and industry expertise, Ekta helps businesses uncover growth opportunities, evaluate competitive landscapes, and stay ahead in rapidly evolving markets through accurate and insight-driven research.
1. Global Reverse Logistics
Market Introduction and Market Overview
1.1.
Objectives
of the Study
1.2.
Global
Reverse Logistics Market Scope and Market Estimation
1.2.1.Global Electronic Toll
Collection Overall Market Size (US$ Bn), Market CAGR (%), Market forecast (2025
- 2033)
1.2.2.Global Reverse Logistics
Market Revenue Share (%) and Growth Rate (Y-o-Y) from 2020 - 2033
1.3.
Market
Segmentation
1.3.1.Return Type of Global Reverse
Logistics Market
1.3.2.Service of Global Reverse
Logistics Market
1.3.3.End-user of Global Reverse
Logistics Market
1.3.4.Region of Global Reverse
Logistics Market
2.
Executive Summary
2.1.
Demand
Side Trends
2.2.
Key
Market Trends
2.3.
Market
Demand (US$ Bn) Analysis 2020 – 2024 and forecast, 2025 – 2033
2.4.
Demand
and Opportunity Assessment
2.5.
Key
Developments
2.6.
Market
Entry Strategies
2.7.
Market
Dynamics
2.7.1.Drivers
2.7.2.Limitations
2.7.3.Opportunities
2.7.4.Impact Analysis of Drivers
and Restraints
2.8.
Porter’s
Five Forces Analysis
2.9.
PEST
Analysis
3. Global
Reverse Logistics Market Estimates
& Historical Trend Analysis (2020 - 2024)
4. Global
Reverse Logistics Market Estimates
& Forecast Trend Analysis, by Return Type
4.1.
Global
Reverse Logistics Market Revenue (US$ Bn) Estimates and Forecasts, by Return
Type, 2020 - 2033
4.1.1.Repairs & Returns
4.1.2.Commercial Returns
4.1.3.End-of-Life Returns
4.1.4.Recalls
5. Global
Reverse Logistics Market Estimates
& Forecast Trend Analysis, by Service
5.1.
Global
Reverse Logistics Market Revenue (US$ Bn) Estimates and Forecasts, by Service, 2020
- 2033
5.1.1.Returns Management
5.1.2.Refurbishment
5.1.3.Remanufacturing
5.1.4.Packaging
5.1.5.Others
6. Global
Reverse Logistics Market Estimates
& Forecast Trend Analysis, by End-user
6.1.
Global
Reverse Logistics Market Revenue (US$ Bn) Estimates and Forecasts, by End-user
2020 - 2033
6.1.1.E-commerce
6.1.2.Automotive
6.1.3.Pharmaceutical
6.1.4.Consumer Electronics
6.1.5.Retail
6.1.6.Others
7. Global
Reverse Logistics Market Estimates
& Forecast Trend Analysis, by region
7.1.
Global
Reverse Logistics Market Revenue (US$ Bn) Estimates and Forecasts, by region, 2020
- 2033
7.1.1.North America
7.1.2.Europe
7.1.3.Asia Pacific
7.1.4.Middle East & Africa
7.1.5.Latin America
8. North America Reverse
Logistics Market: Estimates &
Forecast Trend Analysis
8.1. North America Reverse
Logistics Market Assessments & Key Findings
8.1.1.North America Reverse
Logistics Market Introduction
8.1.2.North America Reverse
Logistics Market Size Estimates and Forecast (US$ Billion) (2020 - 2033)
8.1.2.1.
By Return Type
8.1.2.2.
By Service
8.1.2.3.
By End-user
8.1.2.4. By Country
8.1.2.4.1. The U.S.
8.1.2.4.2. Canada
9. Europe Reverse
Logistics Market: Estimates &
Forecast Trend Analysis
9.1. Europe Reverse Logistics
Market Assessments & Key Findings
9.1.1.Europe Reverse Logistics
Market Introduction
9.1.2.Europe Reverse Logistics
Market Size Estimates and Forecast (US$ Billion) (2020 - 2033)
9.1.2.1.
By Return Type
9.1.2.2.
By Service
9.1.2.3.
By End-user
9.1.2.4. By Country
9.1.2.4.1.
Germany
9.1.2.4.2.
Italy
9.1.2.4.3.
U.K.
9.1.2.4.4.
France
9.1.2.4.5.
Spain
9.1.2.4.6.
Switzerland
9.1.2.4.7. Rest
of Europe
10. Asia Pacific Reverse
Logistics Market: Estimates &
Forecast Trend Analysis
10.1. Asia Pacific Market
Assessments & Key Findings
10.1.1.
Asia
Pacific Reverse Logistics Market Introduction
10.1.2.
Asia
Pacific Reverse Logistics Market Size Estimates and Forecast (US$ Billion) (2020
- 2033)
10.1.2.1.
By Return Type
10.1.2.2.
By Service
10.1.2.3.
By End-user
10.1.2.4. By Country
10.1.2.4.1. China
10.1.2.4.2. Japan
10.1.2.4.3. India
10.1.2.4.4. Australia
10.1.2.4.5. South Korea
10.1.2.4.6. Rest of Asia Pacific
11. Middle East & Africa Reverse
Logistics Market: Estimates &
Forecast Trend Analysis
11.1. Middle East & Africa
Market Assessments & Key Findings
11.1.1. Middle
East & Africa
Reverse Logistics Market Introduction
11.1.2. Middle
East & Africa
Reverse Logistics Market Size Estimates and Forecast (US$ Billion) (2020 - 2033)
11.1.2.1.
By Return Type
11.1.2.2.
By Service
11.1.2.3.
By End-user
11.1.2.4. By Country
11.1.2.4.1. UAE
11.1.2.4.2. Saudi
Arabia
11.1.2.4.3. South
Africa
11.1.2.4.4. Rest
of MEA
12. Latin America
Reverse Logistics Market: Estimates
& Forecast Trend Analysis
12.1. Latin America Market
Assessments & Key Findings
12.1.1. Latin America Reverse
Logistics Market Introduction
12.1.2. Latin America Reverse
Logistics Market Size Estimates and Forecast (US$ Billion) (2020 - 2033)
12.1.2.1.
By Return Type
12.1.2.2.
By Service
12.1.2.3.
By End-user
12.1.2.4. By Country
12.1.2.4.1. Brazil
12.1.2.4.2. Argentina
12.1.2.4.3. Mexico
12.1.2.4.4. Rest
of LATAM
13.
Country
Wise Market: Introduction
14.
Competition
Landscape
14.1. Global Reverse Logistics
Market Product Mapping
14.2. Global Reverse Logistics
Market Concentration Analysis, by Leading Players / Innovators / Emerging
Players / New Entrants
14.3. Global Reverse Logistics
Market Tier Structure Analysis
14.4. Global Reverse Logistics
Market Concentration & Company Market Shares (%) Analysis, 2024
15.
Company
Profiles
15.1.
United Parcel Service, Inc. (UPS)
15.1.1.
Company
Overview & Key Stats
15.1.2.
Financial
Performance & KPIs
15.1.3.
Product
Portfolio
15.1.4.
SWOT
Analysis
15.1.5.
Business
Strategy & Recent Developments
* Similar details would be provided for all the players
mentioned below
15.2.
FedEx Corporation
15.3.
Deutsche Post DHL Group
15.4.
XPO Logistics, Inc.
15.5.
GXO Logistics, Inc.
15.6.
Kintetsu World Express, Inc.
15.7.
Optoro, Inc.
15.8.
Reverse Logistics Group
15.9.
Liquidity Services, Inc.
15.10.
Arrow Electronics, Inc.
15.11.
Hub Group
15.12.
C.H. Robinson
15.13.
Ryder System, Inc.
15.14.
Pitney Bowes Inc.
15.15.
Flexport Inc.
16. Research
Methodology
16.1. External Transportations /
Databases
16.2. Internal Proprietary
Database
16.3. Primary Research
16.4. Secondary Research
16.5. Assumptions
16.6. Limitations
16.7. Report FAQs
17. Research
Findings & Conclusion
Our Research Methodology
"Insight without rigor is just noise."
We follow a comprehensive, multi-phase research framework designed to deliver accurate, strategic, and decision-ready intelligence. Our process integrates primary and secondary research , both quantitative and qualitative , along with dual modeling techniques ( top-down and bottom-up) and a final layer of validation through our proprietary in-house repository.
PRIMARY RESEARCH
Primary research captures real-time, firsthand insights from the market to understand behaviors, motivations, and emerging trends.
1. Quantitative Primary Research
Objective: Generate statistically significant data directly from market participants.
Approaches:- Structured surveys with customers, distributors, and field agents
- Mobile-based data collection for point-of-sale audits and usage behavior
- Phone-based interviews (CATI) for market sizing and product feedback
- Online polling around industry events and digital campaigns
- Purchase frequency by customer type
- Channel performance across geographies
- Feature demand by application or demographic
2. Qualitative Primary Research
Objective: Explore decision-making drivers, pain points, and market readiness.
Approaches:- In-depth interviews (IDIs) with executives, product managers, and key decision-makers
- Focus groups among end users and early adopters
- Site visits and observational research for consumer products
- Informal field-level discussions for regional and cultural nuances
SECONDARY RESEARCH
This phase helps establish a macro-to-micro understanding of market trends, size, regulation, and competitive dynamics, sourced from credible and public domain information.
1. Quantitative Secondary Research
Objective: Model market value and segment-level forecasts based on published data.
Sources include:- Financial reports and investor summaries
- Government trade data, customs records, and regulatory statistics
- Industry association publications and economic databases
- Channel performance and pricing data from marketplace listings
- Revenue splits, pricing trends, and CAGR estimates
- Supply-side capacity and volume tracking
- Investment analysis and funding benchmarks
2. Qualitative Secondary Research
Objective: Capture strategic direction, innovation signals, and behavioral trends.
Sources include:- Company announcements, roadmaps, and product pipelines
- Publicly available whitepapers, conference abstracts, and academic research
- Regulatory body publications and policy briefs
- Social and media sentiment scanning for early-stage shifts
- Strategic shifts in market positioning
- Unmet needs and white spaces
- Regulatory triggers and compliance impact

DUAL MODELING: TOP-DOWN + BOTTOM-UP
To ensure robust market estimation, we apply two complementary sizing approaches:
Top-Down Modeling:- Start with broader industry value (e.g., global or regional TAM)
- Apply filters by segment, geography, end-user, or use case
- Adjust with primary insights and validation benchmarks
- Ideal for investor-grade market scans and opportunity mapping
- Aggregate from the ground up using sales volumes, pricing, and unit economics
- Use internal modeling templates aligned with stakeholder data
- Incorporate distributor-level or region-specific inputs
- Most accurate for emerging segments and granular sub-markets
DATA VALIDATION: IN-HOUSE REPOSITORY
We close the loop with proprietary data intelligence built from ongoing projects, industry monitoring, and historical benchmarking. This repository includes:
- Multi-sector market and pricing models
- Key trendlines from past interviews and forecasts
- Benchmarked adoption rates, churn patterns, and ROI indicators
- Industry-specific deviation flags and cross-check logic
- Catches inconsistencies early
- Aligns projections across studies
- Enables consistent, high-trust deliverables