
Sand Control Solutions Market Size and Forecast (2026–2034), Global and Regional Growth, Trend, Share and Industry Analysis Report Coverage; By Technique (Gravel Pack, Frac Pack, Sand Screens, Chemical Consolidation, Others); By Well Type (Onshore, Offshore); By Application (Oil Wells, Gas Wells, Others); By End User (Oil & Gas Operators, Service Companies, Others), and Geography
2026-04-27
Energy & Power
Ekta Chaurasia (Team Lead)
Description
Sand Control Solutions Market
Overview
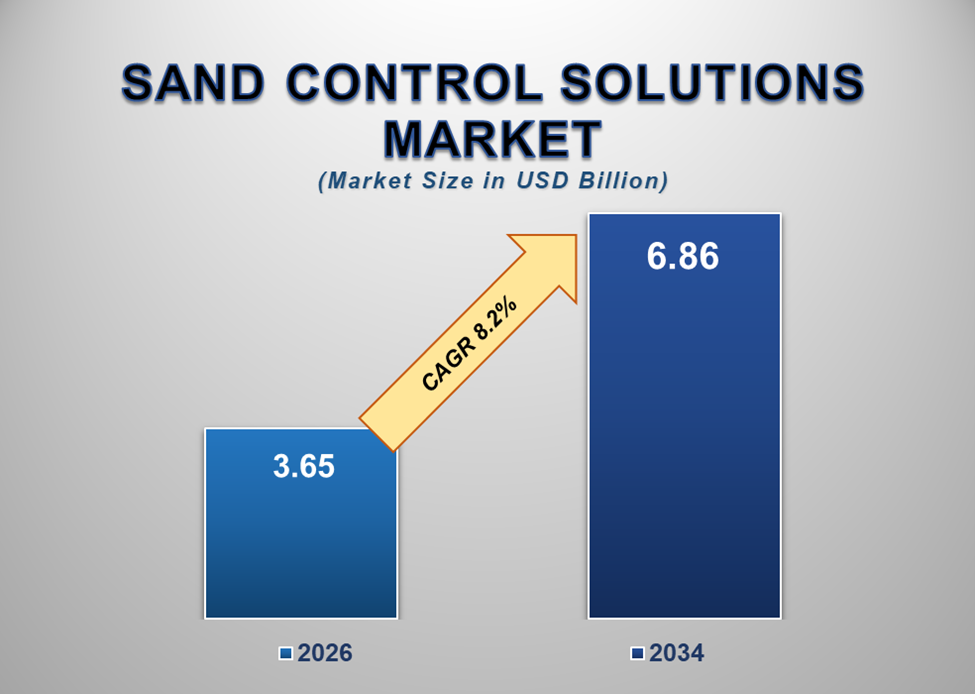
The global Sand
Control Solutions market was valued at USD 3.65 billion in 2026 and
is projected to reach USD 6.86 billion by 2034, expanding at a CAGR of 8.2%
during the forecast period. The market growth is primarily driven by
increasing oil and gas exploration activities, rising demand for enhanced oil
recovery (EOR), and the need to improve well productivity and longevity. Sand
control solutions play a critical role in maintaining the structural integrity
of wells and preventing production losses caused by sand ingress.
Sand production
is a common challenge in oil and gas extraction, particularly in unconsolidated
or weakly consolidated reservoirs. The influx of sand into wellbores can lead
to equipment damage, reduced production efficiency, and increased operational
costs. Sand control solutions are designed to prevent the migration of
formation sand while allowing hydrocarbons to flow efficiently.
These solutions
include a range of techniques and technologies such as gravel packing, sand
screens, frac packing, and chemical consolidation. Each method is selected
based on reservoir characteristics, well conditions, and production
requirements.
With the increasing complexity of oil and gas reservoirs, especially in deepwater and unconventional fields, the demand for advanced sand control solutions is rising. Operators are focusing on optimizing production while minimizing downtime and maintenance costs. As global energy demand continues to grow, the sand control solutions market is expected to witness steady expansion through 2034.
Sand Control Solutions Market Drivers
and Opportunities
Increasing
Oil & Gas Exploration and Production Activities Are Driving Market Growth
The expansion of
oil and gas exploration and production activities is one of the primary drivers
of the sand control solutions market. As global energy demand continues to
rise, oil and gas companies are investing in the development of new fields,
including unconventional and offshore reserves.
Many of these
reservoirs are characterized by loose or unconsolidated formations that are
prone to sand production. Without effective sand control measures, these wells
can experience significant operational challenges, including equipment failure
and reduced output.
Sand control solutions are essential for ensuring stable and efficient production. By preventing sand ingress, these technologies help maintain well integrity and extend the operational life of wells. As exploration activities continue to expand, particularly in challenging environments, the demand for sand control solutions is expected to increase significantly.
Rising Focus
on Enhanced Oil Recovery (EOR) Techniques Is Fueling Market Expansion
Enhanced oil
recovery (EOR) techniques are gaining prominence as operators seek to maximize
production from existing fields. EOR methods such as water flooding, gas
injection, and chemical injection can increase reservoir pressure and improve
hydrocarbon recovery.
However, these
processes can also exacerbate sand production issues, making effective sand
control solutions even more critical. The integration of sand control
technologies with EOR operations ensures that increased production does not
compromise well integrity.
Additionally, the growing need to optimize production from mature oil fields is driving the adoption of advanced sand control methods. Operators are investing in technologies that enhance recovery rates while minimizing operational risks.
Technological
Advancements in Downhole Solutions Present Significant Opportunities
Technological
innovation is creating significant growth opportunities in the sand control
solutions market. Advances in materials, design, and engineering are leading to
the development of more efficient and durable sand control systems.
Modern sand
screens are designed with high-strength materials and advanced filtration
capabilities, enabling them to withstand harsh downhole conditions. Similarly,
improvements in gravel packing techniques are enhancing the effectiveness of
sand control operations.
The integration
of digital technologies and real-time monitoring systems is also transforming
the market. Operators can now monitor well conditions and optimize sand control
strategies in real time, improving operational efficiency and reducing costs.
As technology continues to evolve, the adoption of advanced sand control solutions is expected to increase, creating new opportunities for market growth.
Sand Control Solutions Market Scope
|
Report Attributes |
Description |
|
Market Size
in 2026 |
USD 3.65 Billion |
|
Market
Forecast in 2034 |
USD 6.86 Billion |
|
CAGR %
2026-2034 |
8.2% |
|
Base Year |
2025 |
|
Historic
Data |
2021-2025 |
|
Forecast
Period |
2026-2034 |
|
Report USP |
Production, Consumption,
Company Share, Company Heatmap, Company Production, Service Type, Growth
Factors and more |
|
Segments
Covered |
∙ By Technique |
|
Regional
Scope |
● North America |
|
Country
Scope |
U.S. |
Sand Control Solutions Market Report
Segmentation Analysis
The global sand control solutions market
industry analysis is segmented by technique, by well type, by application, by
end user, and by region.
Gravel Pack Segment Is Expected to
Dominate the Market During the Forecast Period
The gravel pack segment accounted for approximately 34.9% of the global market, making it the dominant category. Gravel packing is widely used due to its effectiveness in controlling sand production while maintaining high flow rates.
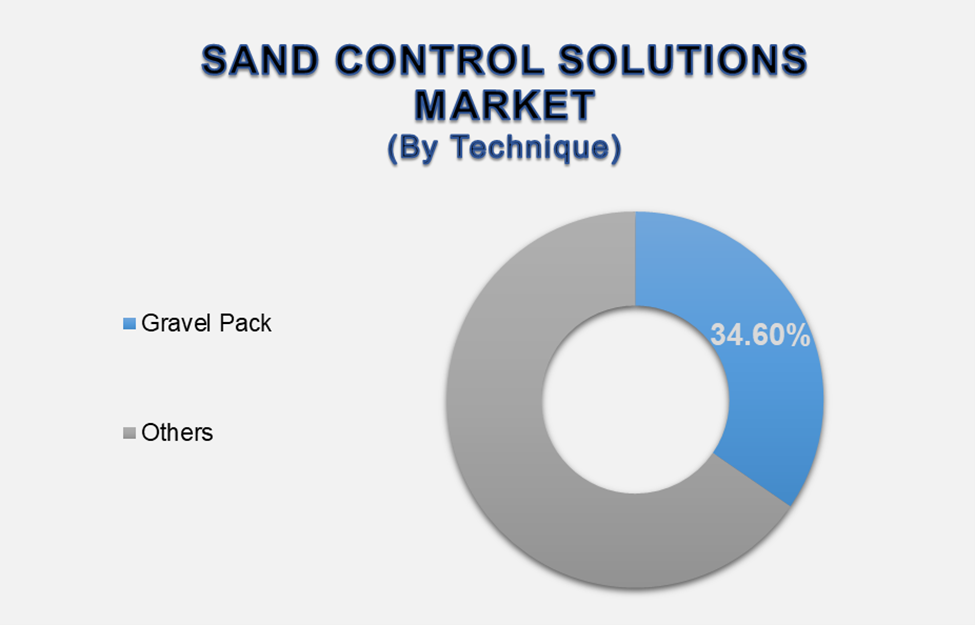
This technique involves placing a layer of gravel around the well screen to filter out formation sand. It is particularly effective in unconsolidated formations and is commonly used in both onshore and offshore wells.
Onshore
Segment Is Expected to Lead the Market by Well Type
Onshore wells dominate the market due to the large number of land-based oil and gas operations globally. These wells often require sand control solutions to ensure efficient production.
Oil Wells
Segment Is Expected to Dominate the Application Market
Oil wells represent the largest application segment due to the higher prevalence of sand production issues in oil reservoirs compared to gas wells.
Oil & Gas
Operators Segment Is Expected to Dominate the End User Market
Oil and gas operators hold the largest share, as they are directly responsible for well development and production activities.
The following segments are part of an in-depth analysis of the global Sand Control Solutions market:
|
Market Segments |
|
|
By
Technique |
∙
Gravel Pack |
|
By Well Type |
∙
Onshore |
|
By Application |
∙
Oil Wells |
|
By
End User |
∙
Oil & Gas Operators |
Sand Control
Solutions Market Share Analysis By Region
North America is
projected to hold the largest share of the global sand control solutions market
over the forecast period.
North America
accounted for approximately 36.5% of the global market in 2026, driven
by extensive shale oil and gas activities and advanced drilling technologies.
The Middle East & Africa region is expected to register the highest CAGR during the forecast period due to increasing investments in oilfield development and enhanced recovery projects.
Sand Control
Solutions Market Competition Landscape Analysis
The market is highly competitive, with companies focusing on technological innovation, service efficiency, and strategic partnerships to strengthen their market position.
Global Sand
Control Solutions Market Recent Developments News:
∙ In March 2026
– Advanced sand control systems with improved durability were introduced.
∙ In November 2025 – Oilfield service companies expanded their sand control
service portfolios.
∙ In August 2025 – Integration of digital monitoring technologies enhanced
well-performance optimization.
The Global Sand Control Solutions Market
is dominated by a few large companies, such as
∙ Schlumberger Limited
∙ Halliburton Company
∙ Baker Hughes Company
∙ Weatherford International
∙ NOV Inc.
∙ Superior Energy Services
∙ Tendeka
∙ Packers Plus Energy Services
∙ Interwell
∙ Variperm
∙ Others
Frequently Asked Questions
Ekta Chaurasia (Team Lead)
Ekta Chaurasia is a highly experienced Team Lead at M2Square Consultancy with over 7 years of expertise in market research, strategic consulting, competitive benchmarking, and business intelligence solutions. She specializes in ICT, semiconductors & electronics, automotive & transportation, and industrial machinery markets.
She leads end-to-end global research projects focused on market trends, industry analysis, growth forecasting, customer insights, and strategic decision-making. Known for her analytical leadership and industry expertise, Ekta helps businesses uncover growth opportunities, evaluate competitive landscapes, and stay ahead in rapidly evolving markets through accurate and insight-driven research.
1.
Global Sand Control
Solutions Market Introduction and Market Overview
1.1. Objectives of the Study
1.2. Global Sand Control Solutions Market Scope and Market Estimation
1.2.1.
Global Sand Control Solutions
Overall Market Size (US$ Million), Market CAGR (%), Market Forecast (2026 -
2034)
1.2.2.
Global Sand Control Solutions
Market Revenue Share (%) and Growth Rate (Y-o-Y) from 2021 - 2034
1.3. Market Segmentation
1.3.1.
Technique of Global Sand
Control Solutions Market
1.3.2.
Well Type of Global Sand
Control Solutions Market
1.3.3.
Application of Global Sand
Control Solutions Market
1.3.4.
End User of Global Sand Control
Solutions Market
1.3.5.
Region of Global Sand Control
Solutions Market
2.
Executive Summary
2.1. Demand Side Trends
2.2. Key Market Trends
2.3. Market Demand (US$ Million) Analysis 2021 – 2025 and Forecast, 2026
– 2034
2.4. Demand and Opportunity Assessment
2.5. Key Developments
2.6. Overview of Tariff, Regulatory Landscape and Standards
2.7. Market Entry Strategies
2.8. Market Dynamics
2.8.1.
Drivers
2.8.2.
Limitations
2.8.3.
Opportunities
2.8.4.
Impact Analysis of Drivers and
Restraints
2.9. Porter’s Five Forces Analysis
2.10.
PEST Analysis
3.
Global Sand Control
Solutions Market Estimates & Historical Trend Analysis (2021 - 2025)
4.
Global Sand Control
Solutions Market Estimates & Forecast Trend Analysis, by Technique
4.1. Global Sand Control Solutions Market Revenue (US$ Million) Estimates
and Forecasts, by Technique, 2021 - 2034
4.1.1.
Gravel Pack
4.1.2.
Frac Pack
4.1.3.
Sand Screens
4.1.4.
Chemical Consolidation
4.1.5.
Others
5.
Global Sand Control
Solutions Market Estimates & Forecast Trend Analysis, by Well Type
5.1. Global Sand Control Solutions Market Revenue (US$ Million) Estimates
and Forecasts, by Well Type, 2021 - 2034
5.1.1.
Onshore
5.1.2.
Offshore
6.
Global Sand Control
Solutions Market Estimates & Forecast Trend Analysis, by Application
6.1. Global Sand Control Solutions Market Revenue (US$ Million) Estimates
and Forecasts, by Application, 2021 - 2034
6.1.1.
Oil Wells
6.1.2.
Gas Wells
6.1.3.
Others
7.
Global Sand Control
Solutions Market Estimates & Forecast Trend Analysis, by End User
7.1. Global Sand Control Solutions Market Revenue (US$ Million) Estimates
and Forecasts, by End User, 2021 - 2034
7.1.1.
Oil & Gas Operators
7.1.2.
Service Companies
7.1.3.
Others
8.
Global Sand Control
Solutions Market Estimates & Forecast Trend Analysis, by Region
8.1. Global Sand Control Solutions Market Revenue (US$ Million) Estimates
and Forecasts, by Region, 2021 - 2034
8.1.1.
North America
8.1.2.
Europe
8.1.3.
Asia Pacific
8.1.4.
Middle East & Africa
8.1.5.
Latin America
9.
North America Sand
Control Solutions Market: Estimates & Forecast Trend Analysis
9.1. North America Sand Control Solutions Market Assessments & Key
Findings
9.1.1.
North America Sand Control
Solutions Market Introduction
9.1.2.
North America Sand Control
Solutions Market Size Estimates and Forecast (US$ Million) (2021 - 2034)
9.1.2.1.
By Technique
9.1.2.2.
By Well Type
9.1.2.3.
By Application
9.1.2.4.
By End User
9.1.2.5.
By Country
9.1.2.5.1.
The U.S.
9.1.2.5.2.
Canada
10. Europe Sand Control Solutions Market: Estimates & Forecast Trend
Analysis
10.1.
Europe Sand Control Solutions
Market Assessments & Key Findings
10.1.1.
Europe Sand Control Solutions
Market Introduction
10.1.2.
Europe Sand Control Solutions
Market Size Estimates and Forecast (US$ Million) (2021 - 2034)
10.1.2.1.
By Technique
10.1.2.2.
By Well Type
10.1.2.3.
By Application
10.1.2.4.
By End User
10.1.2.5.
By Country
10.1.2.5.1.
Germany
10.1.2.5.2.
Italy
10.1.2.5.3.
U.K.
10.1.2.5.4.
France
10.1.2.5.5.
Spain
10.1.2.5.6.
Switzerland
10.1.2.5.7.
Rest of Europe
11. Asia Pacific Sand Control Solutions Market: Estimates & Forecast
Trend Analysis
11.1.
Asia Pacific Market Assessments
& Key Findings
11.1.1.
Asia Pacific Sand Control
Solutions Market Introduction
11.1.2.
Asia Pacific Sand Control
Solutions Market Size Estimates and Forecast (US$ Million) (2021 - 2034)
11.1.2.1.
By Technique
11.1.2.2.
By Well Type
11.1.2.3.
By Application
11.1.2.4.
By End User
11.1.2.5.
By Country
11.1.2.5.1.
China
11.1.2.5.2.
Japan
11.1.2.5.3.
India
11.1.2.5.4.
Australia
11.1.2.5.5.
South Korea
11.1.2.5.6.
Rest of Asia Pacific
12. Middle East & Africa Sand Control Solutions Market: Estimates
& Forecast Trend Analysis
12.1.
Middle East & Africa Market
Assessments & Key Findings
12.1.1.
Middle East & Africa Sand
Control Solutions Market Introduction
12.1.2.
Middle East & Africa Sand
Control Solutions Market Size Estimates and Forecast (US$ Million) (2021 -
2034)
12.1.2.1.
By Technique
12.1.2.2.
By Well Type
12.1.2.3.
By Application
12.1.2.4.
By End User
12.1.2.5.
By Country
12.1.2.5.1.
UAE
12.1.2.5.2.
Saudi Arabia
12.1.2.5.3.
South Africa
12.1.2.5.4.
Rest of MEA
13. Latin America Sand Control Solutions Market: Estimates &
Forecast Trend Analysis
13.1.
Latin America Market Assessments
& Key Findings
13.1.1.
Latin America Sand Control
Solutions Market Introduction
13.1.2.
Latin America Sand Control
Solutions Market Size Estimates and Forecast (US$ Million) (2021 - 2034)
13.1.2.1.
By Technique
13.1.2.2.
By Well Type
13.1.2.3.
By Application
13.1.2.4.
By End User
13.1.2.5.
By Country
13.1.2.5.1.
Brazil
13.1.2.5.2.
Mexico
13.1.2.5.3.
Argentina
13.1.2.5.4.
Rest of LATAM
14. Competition Landscape
14.1.
Global Sand Control Solutions
Market Product Mapping
14.2.
Global Sand Control Solutions
Market Concentration Analysis, by Leading Players / Innovators / Emerging
Players / New Entrants
14.3.
Global Sand Control Solutions
Market Tier Structure Analysis
14.4.
Global Sand Control Solutions
Market Concentration & Company Market Shares (%) Analysis, 2025
15. Company Profiles
15.1.
Schlumberger Limited
15.1.1.
Company Overview & Key
Stats
15.1.2.
Financial Performance &
KPIs
15.1.3.
Product Portfolio
15.1.4.
SWOT Analysis
15.1.5.
Business Strategy & Recent
Developments
*Similar details would be provided for all
the players mentioned below
15.2.
Halliburton Company
15.3.
Baker Hughes Company
15.4.
Weatherford International
15.5.
NOV Inc.
15.6.
Superior Energy Services
15.7.
Tendeka
15.8.
Packers Plus Energy Services
15.9.
Interwell
15.10.
Variperm
15.11.
Others
16. Research Findings & Conclusion
17. Assumption & Acronyms Used
18. Research Methodology
18.1.
External Databases
18.2.
Internal Proprietary Database
18.3.
Primary Research
18.4.
Secondary Research
18.5.
Assumptions
18.6.
Limitations
18.7.
Report FAQs
Our Research Methodology
"Insight without rigor is just noise."
We follow a comprehensive, multi-phase research framework designed to deliver accurate, strategic, and decision-ready intelligence. Our process integrates primary and secondary research , both quantitative and qualitative , along with dual modeling techniques ( top-down and bottom-up) and a final layer of validation through our proprietary in-house repository.
PRIMARY RESEARCH
Primary research captures real-time, firsthand insights from the market to understand behaviors, motivations, and emerging trends.
1. Quantitative Primary Research
Objective: Generate statistically significant data directly from market participants.
Approaches:- Structured surveys with customers, distributors, and field agents
- Mobile-based data collection for point-of-sale audits and usage behavior
- Phone-based interviews (CATI) for market sizing and product feedback
- Online polling around industry events and digital campaigns
- Purchase frequency by customer type
- Channel performance across geographies
- Feature demand by application or demographic
2. Qualitative Primary Research
Objective: Explore decision-making drivers, pain points, and market readiness.
Approaches:- In-depth interviews (IDIs) with executives, product managers, and key decision-makers
- Focus groups among end users and early adopters
- Site visits and observational research for consumer products
- Informal field-level discussions for regional and cultural nuances
SECONDARY RESEARCH
This phase helps establish a macro-to-micro understanding of market trends, size, regulation, and competitive dynamics, sourced from credible and public domain information.
1. Quantitative Secondary Research
Objective: Model market value and segment-level forecasts based on published data.
Sources include:- Financial reports and investor summaries
- Government trade data, customs records, and regulatory statistics
- Industry association publications and economic databases
- Channel performance and pricing data from marketplace listings
- Revenue splits, pricing trends, and CAGR estimates
- Supply-side capacity and volume tracking
- Investment analysis and funding benchmarks
2. Qualitative Secondary Research
Objective: Capture strategic direction, innovation signals, and behavioral trends.
Sources include:- Company announcements, roadmaps, and product pipelines
- Publicly available whitepapers, conference abstracts, and academic research
- Regulatory body publications and policy briefs
- Social and media sentiment scanning for early-stage shifts
- Strategic shifts in market positioning
- Unmet needs and white spaces
- Regulatory triggers and compliance impact

DUAL MODELING: TOP-DOWN + BOTTOM-UP
To ensure robust market estimation, we apply two complementary sizing approaches:
Top-Down Modeling:- Start with broader industry value (e.g., global or regional TAM)
- Apply filters by segment, geography, end-user, or use case
- Adjust with primary insights and validation benchmarks
- Ideal for investor-grade market scans and opportunity mapping
- Aggregate from the ground up using sales volumes, pricing, and unit economics
- Use internal modeling templates aligned with stakeholder data
- Incorporate distributor-level or region-specific inputs
- Most accurate for emerging segments and granular sub-markets
DATA VALIDATION: IN-HOUSE REPOSITORY
We close the loop with proprietary data intelligence built from ongoing projects, industry monitoring, and historical benchmarking. This repository includes:
- Multi-sector market and pricing models
- Key trendlines from past interviews and forecasts
- Benchmarked adoption rates, churn patterns, and ROI indicators
- Industry-specific deviation flags and cross-check logic
- Catches inconsistencies early
- Aligns projections across studies
- Enables consistent, high-trust deliverables