
Smart Hospitality Market Size and Forecast (2020 - 2033), Global and Regional Growth, Trend, Share and Industry Analysis Report Coverage; By Component: (Software and Services); By Deployment (Cloud-Based and On-Premise); By Hotel Type (Business Hotels, Heritage and Boutique Hotels, Resorts and Spas, Luxury Hotels, Cruises, Luxury Yachts and Others) and Geography
2025-11-03
ICT
Ekta Chaurasia (Team Lead)
Description
Smart Hospitality Market Overview
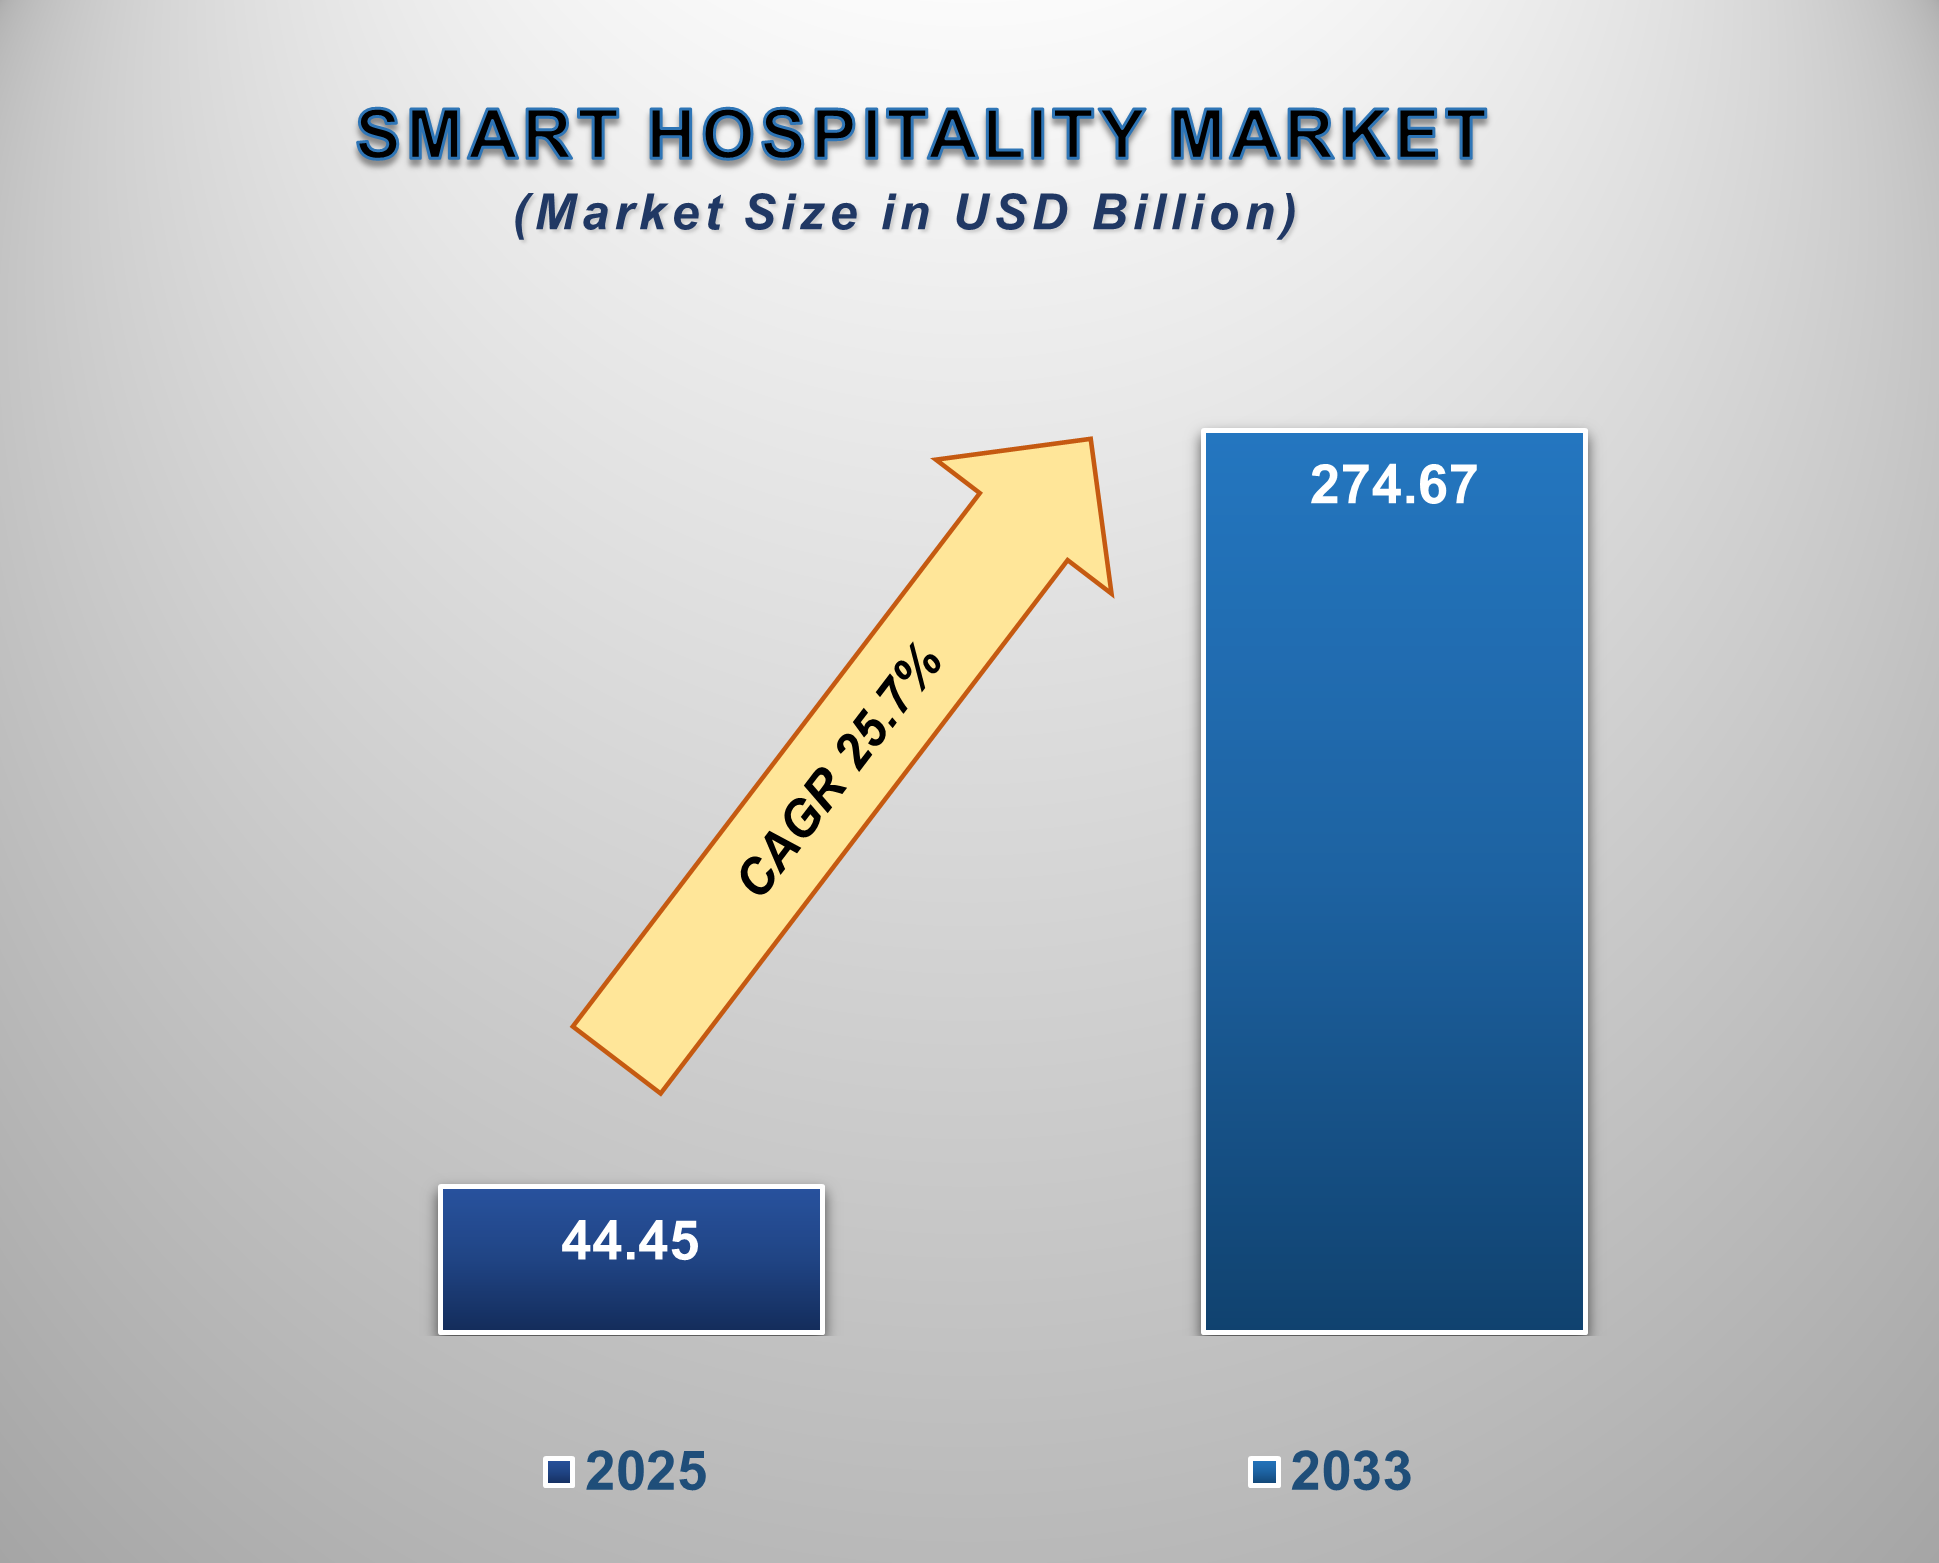
The Global Smart Hospitality Market is undergoing a significant transformation, driven by the integration of advanced technologies to enhance guest experience, optimize operational efficiency, and meet the rising demand for personalized and contactless services. Valued at USD 44.45 billion in 2025, the market is projected to reach USD 274.67 billion by 2033, growing at a CAGR of 25.7% during the forecast period.
The Global Smart Hospitality
Market refers to the market encompassing advanced technology solutions and
services designed to enhance the operations, management, and guest experiences
within the hospitality industry. The Global Smart Hospitality Market is all
about leveraging digital, automated, and IoT-enabled solutions to modernize the
hospitality sector and deliver superior guest experiences. The Global Smart
Hospitality Market is a rapidly evolving sector leveraging advanced
technologies to enhance guest experiences, optimize operations, and improve
efficiency within the hospitality industry. The global smart hospitality market
is experiencing rapid growth, driven by advancements in technology and evolving
consumer expectations.
Smart Hospitality Market
Drivers and Opportunities
Demand for Personalized Guest Experiences is anticipated to
lift the Smart Hospitality market growth during the forecast period
The demand for personalized guest
experiences is a significant driver of the global smart hospitality market,
influencing its rapid growth and technological advancements. Personalization in
hospitality involves tailoring services and amenities to individual guest
preferences, enhancing satisfaction and loyalty. This trend is propelled by
advancements in Internet of Things (IoT) technologies, artificial intelligence
(AI), and data analytics, enabling hotels to offer customized experiences that
meet the evolving expectations of modern travelers. Hotels are leveraging data
analytics and AI to understand guest preferences and behaviors, allowing them
to offer personalized services such as customized room settings, tailored
recommendations for dining and activities, and personalized communication.
Furthermore, the integration of smart technologies enables hotels to streamline
operations and improve efficiency, which contributes to cost savings and
enhanced service delivery. As guests increasingly expect personalized and
seamless experiences, the adoption of smart hospitality solutions is becoming
essential for hotels aiming to stay competitive in the market.
Adoption of Contactless and Mobile-First Solutions is a vital
driver for influencing the growth of the global Smart Hospitality market
The
pervasive adoption of contactless and mobile-first solutions is a primary
catalyst driving the lucrative growth of the Global Smart Hospitality Market,
as these technologies directly address modern guest demands for convenience,
efficiency, and safety while simultaneously optimizing hotel operations. This
movement encompasses everything from mobile check-in/out and digital key
delivery to in-app service requests and QR code-based ordering, all of which
streamline the guest journey. A key statistical driver is the sheer reliance on
mobile devices for travel: currently, more than a third of hotel bookings are
made on mobile, a figure that dramatically jumps to 80% for last-minute
bookings, compelling hoteliers to adopt a mobile-first strategy. Major chains
have validated this approach with tangible results; for instance, Hilton's
Digital Key program has been used for over 150 million room entries globally,
reducing check-in time by an average of seven minutes per guest while
maintaining high satisfaction. By automating front-desk tasks, hotels can
reallocate staff to value-adding concierge services, and the digital nature of
these interactions provides vast amounts of data for hyper-personalization,
which, in turn, boosts guest satisfaction scores by as much as 25% within six
months of implementation, establishing a powerful feedback loop for market
expansion.
Integration of Artificial Intelligence (AI) and Internet of
Things (IoT) is poised to create significant opportunities in the global Smart
Hospitality market
The convergence of Artificial
Intelligence (AI) and the Internet of Things (IoT) is set to generate a
profoundly lucrative opportunity for the Global Smart Antenna Market, primarily
by driving demand for advanced, self-optimizing wireless communication systems,
particularly with the global rollout of 5G networks. This integration elevates
smart antennas from passive components to intelligent network assets capable of
real-time, dynamic performance adjustment. For example, the need to support the
massive projected growth of connected devices, with forecasts suggesting the
number of global IoT devices could exceed 75 billion by 2025, directly propels
the smart antenna market. AI-powered smart antennas use machine learning to
execute real-time beamforming optimization, directing radio frequency (RF)
energy precisely to individual IoT devices (like sensors in a smart city or
components in an autonomous vehicle), minimizing interference, and maximizing
spectral efficiency. This intelligence is crucial for complex, high-demand
scenarios like vehicle-to-everything (V2X) communication, where continuous,
low-latency connectivity is non-negotiable. Furthermore, AI enables Predictive
Network Management, allowing antennas to anticipate traffic patterns and
interference sources across large IoT networks, thus proactively adjusting
antenna behavior to prevent connectivity issues. This symbiotic relationship
between AI, the data-generating IoT, and the enhanced capabilities of smart
antennas creates a foundation for highly efficient, reliable, and
energy-conscious wireless infrastructure, cementing their vital role in
next-generation applications.
Smart Hospitality Market Scope
|
Report Attributes |
Description |
|
Market Size in 2025 |
USD 44.45 Billion |
|
Market Forecast in 2033 |
USD 274.67 Billion |
|
CAGR % 2025-2033 |
25.7% |
|
Base Year |
2024 |
|
Historic Data |
2020-2024 |
|
Forecast Period |
2025-2033 |
|
Report USP |
Production, Consumption, Company Share, Company Heatmap, Company
Production, Service Type, Growth Factors and more |
|
Segments Covered |
●
By Component ●
By Deployment ●
By Hotel Type |
|
Regional Scope |
●
North America ●
Europe ●
APAC ●
Latin America ●
Middle East and Africa |
|
Country Scope |
1)
U.S. 2)
Canada 3)
U.K. 4)
Germany 5)
France 6)
Italy 7)
Spain 8)
Netherlands 9)
China 10)
India 11)
Japan 12)
South Korea 13)
Australia 14)
Mexico 15)
Brazil 16)
Argentina 17)
Saudi Arabia 18)
UAE 19)
Egypt 20) South Africa |
Smart Hospitality Market Report Segmentation Analysis
The global Smart Hospitality
Market industry analysis is segmented by Component, Deployment, Hotel Type, and
Region.
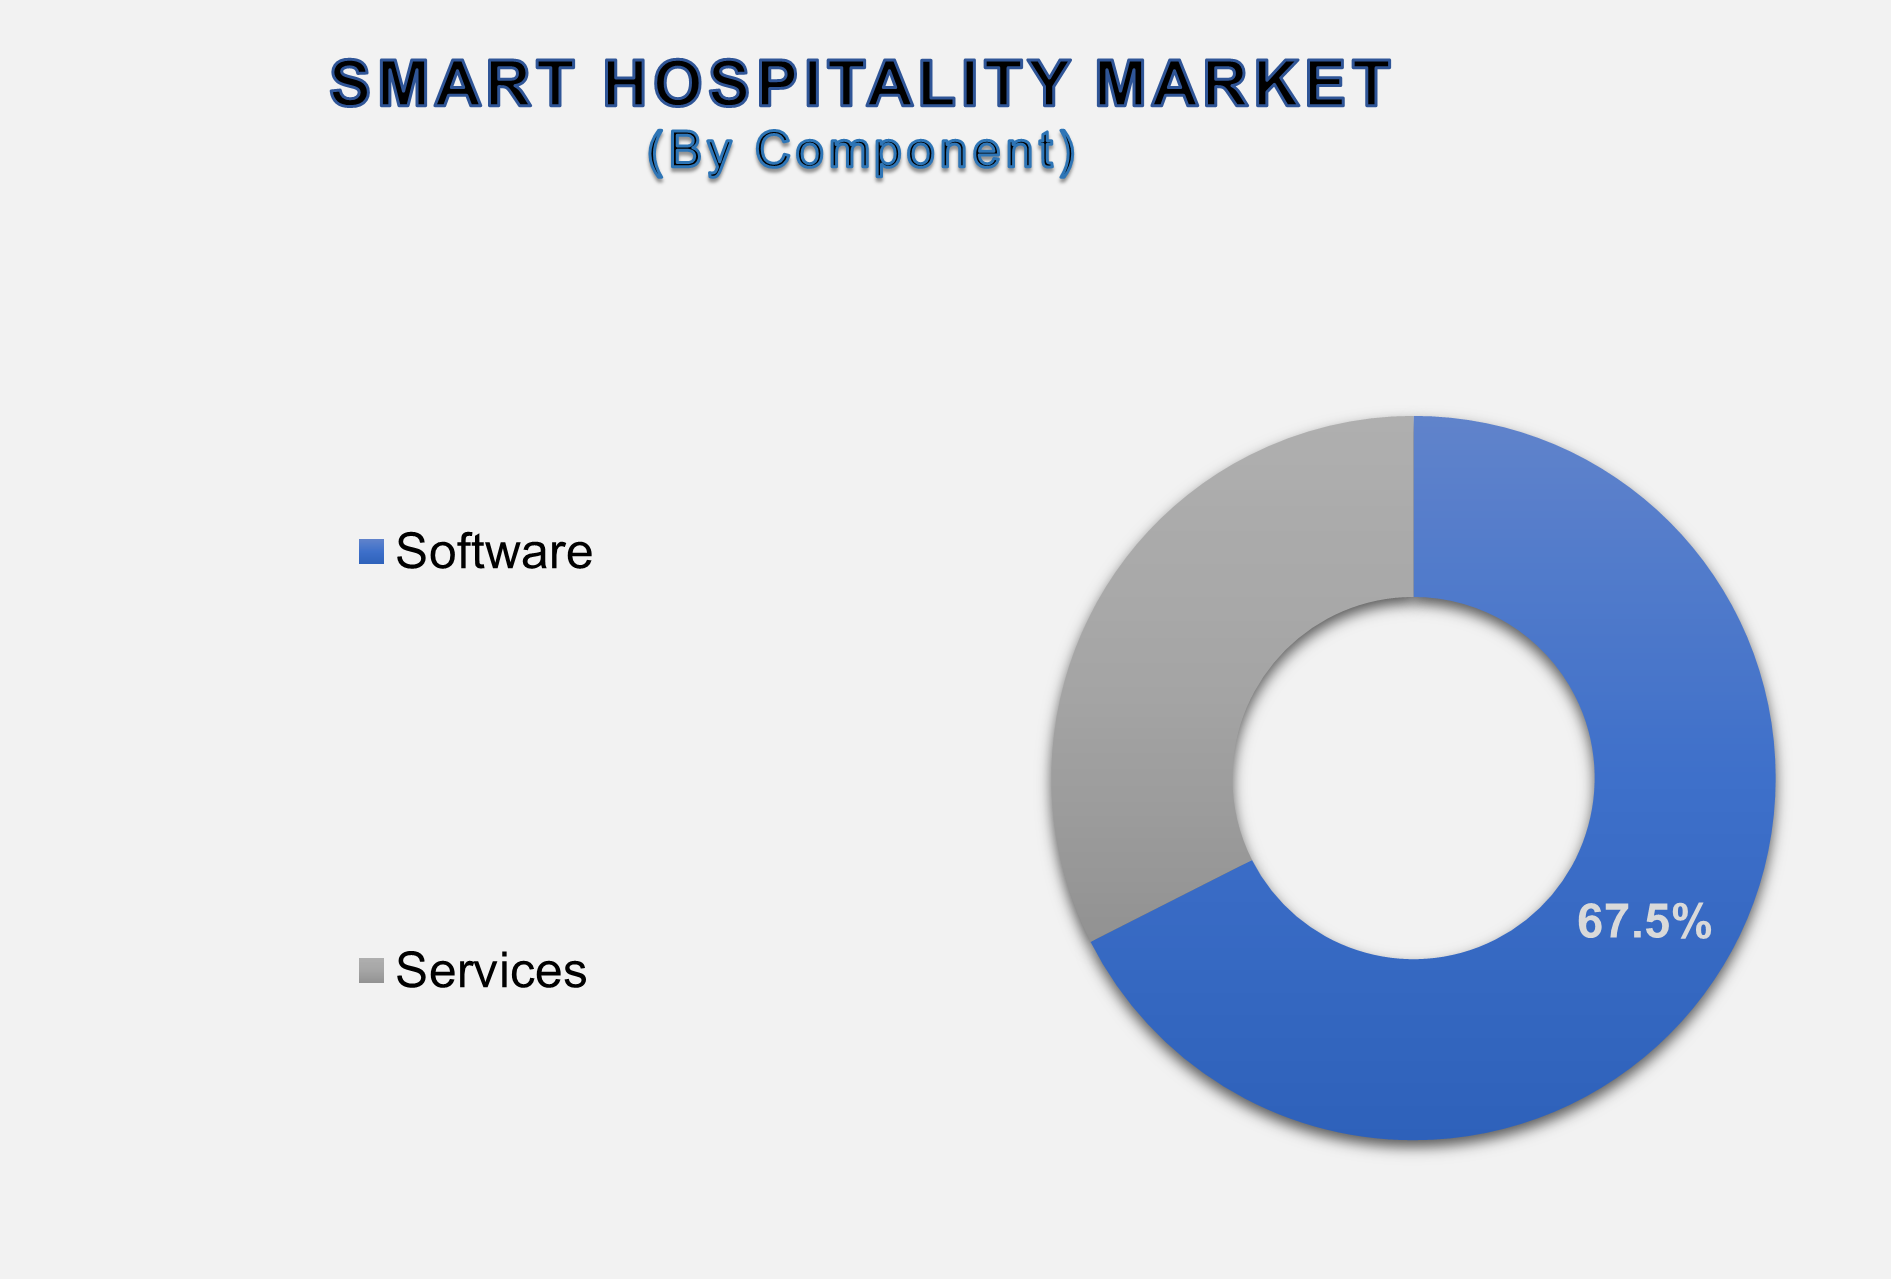
Software Dominates the Component Segment
By Component, the Smart Hospitality market is segmented into Software (Property Management System (PMS), Guest Experience Management System, Integrated Security Management, Facility Management Software/Hotel Building Automation System (HBAS), Network Management Software, Point of Sale (POS) Software, Hotel Operation Management, Revenue Management, Room Automation and Control System and Others) and Services (Professional and Managed). The software component holds the largest market share of the total revenue in 2024. This dominance is attributed to the widespread adoption of hotel management software, including property management systems (PMS), guest experience management tools, and integrated security systems, which enhance operational efficiency and guest satisfaction.
Cloud holds the highest share of the Deployment Segment
On the basis of Deployment, the
market is bifurcated into Cloud-Based and On-Premise. The cloud-based segment
holds a dominant position in the market, driven by its flexibility,
scalability, and cost-effectiveness. Cloud solutions enable remote access, real-time
updates, and integration with Internet of Things (IoT) and Artificial
Intelligence (AI) technologies, enhancing operational agility and guest
experience. The cloud segment is expected to continue its robust growth
trajectory, driven by the increasing integration of IoT, AI, and cloud-based
solutions within the hospitality industry. These technologies enable
personalized guest experiences, streamlined operations, and improved energy
efficiency.
Business Hotel Segment Leads by Hotel Type
In terms of Hotel Type, the Smart
Hospitality market is segmented into Business Hotels, Heritage and Boutique
Hotels, Resorts and Spas, Luxury Hotels, Cruises, Luxury Yachts, and Others.
Business Hotels establishments cater primarily to business travelers and are
the largest adopters of smart hospitality solutions. The integration of
technologies such as mobile check-ins, automated room controls, and data
analytics enhances operational efficiency and meets the high expectations of
corporate clients.
The following segments are part of an
in-depth analysis of the global Smart Hospitality Market:
|
Market Segments |
|
|
By Component
|
●
Software o
Property Management
System (PMS) o
Guest Experience
Management System o
Integrated Security
Management o
Facility Management
Software/Hotel Building Automation System (HBAS) o
Network Management
Software o
Point of Sale (POS)
Software o
Hotel Operation
Management o
Revenue Management o
Room Automation and
Control System o
Others ●
Services o
Professional o
Managed |
|
By Deployment
|
●
Cloud-Based ●
On-Premise |
|
By Hotel Type |
●
Business Hotels ●
Heritage and
Boutique Hotels ●
Resorts and Spas ●
Luxury Hotels ●
Cruises ●
Luxury Yachts ●
Others |
Smart Hospitality Market
Share Analysis by Region
The Europe region is projected to hold the largest share of
the global Smart Hospitality Market over the forecast period.
Europe holds the largest share of
the global smart hospitality market, accounting for approximately 33.5%. This
dominance is driven by technological advancements, a well-established digital
infrastructure, and a strong emphasis on enhancing customer experiences through
smart room solutions, energy efficiency, and AI-driven personalization.
Countries like the United Kingdom are leading the way in integrating smart
technologies into hospitality operations. Furthermore, the Asia Pacific region
is poised to experience the highest growth rate in the smart hospitality
market. This growth is driven by rapid urbanization, increasing disposable
incomes, and a burgeoning middle class, leading to higher demand for modern and
tech-enabled hospitality services. Countries like China, India, and Japan are
at the forefront of this expansion, with significant investments in smart hotel
projects and infrastructure development. For instance, India recorded a new
high with 693 hotel projects comprising 88,884 rooms under development during
the January-March 2025 quarter, marking a 19% increase in projects and a 27%
rise in rooms year-on-year.
Global Smart Hospitality
Market Recent Developments News:
- In September
2025, Marriott International expanded its footprint in India through a
partnership with CG Hospitality, launching a new midscale and
upscale-focused brand, Series by Marriott. This collaboration integrates
84 operational Fern Hotels, approximately 6,000 rooms, into Marriott’s
portfolio, supporting rapid growth in the midscale and upscale categories.
- In August 2025, Nightfood Holdings is strategically building an $80 million
portfolio of high-quality hotel assets through a series of acquisitions.
The company is leveraging AI and robotics to enhance service efficiency
and address labor shortages, reflecting the industry's shift towards
automation and smart technologies.
- In December 2024, Pyramid
Global Hospitality's European division, Hamilton Pyramid Europe, merged
with London-based Axiom Hospitality. This merger aims to strengthen their
market position in Europe, combining resources and expertise to offer
enhanced services in the smart hospitality sector.
The Global Smart
Hospitality Market is dominated by a few large companies, such as
●
Honeywell
International Inc.
●
IBM Corporation
●
Cisco Systems, Inc.
●
Oracle Corporation
●
Siemens AG
●
Samsung Electronics
Co., Ltd.
●
Intel Corporation
●
Microsoft Corporation
●
LG Electronics Inc.
●
Schneider Electric SE
●
Johnson Controls
International plc
●
ASSA ABLOY AB
●
Panasonic Corporation
●
Hitachi, Ltd.
●
Zebra Technologies
Corporation
●
Agilysys, Inc.
●
Sabre Corporation
●
Amadeus IT Group
●
NEC Corporation
●
Allegion PLC
● Other Prominent Players
Frequently Asked Questions
Ekta Chaurasia (Team Lead)
Ekta Chaurasia is a highly experienced Team Lead at M2Square Consultancy with over 7 years of expertise in market research, strategic consulting, competitive benchmarking, and business intelligence solutions. She specializes in ICT, semiconductors & electronics, automotive & transportation, and industrial machinery markets.
She leads end-to-end global research projects focused on market trends, industry analysis, growth forecasting, customer insights, and strategic decision-making. Known for her analytical leadership and industry expertise, Ekta helps businesses uncover growth opportunities, evaluate competitive landscapes, and stay ahead in rapidly evolving markets through accurate and insight-driven research.
1.
Global Smart Hospitality Market Introduction and Market Overview
1.1.
Objectives of the Study
1.2.
Global Smart Hospitality Market Scope and Market Estimation
1.2.1.Global Smart
Hospitality Market Overall Market Size (US$ Bn), Market CAGR (%), Market
forecast (2025 - 2033)
1.2.2.Global Smart
Hospitality Market Revenue Share (%) and Growth Rate (Y-o-Y) from 2020 - 2033
1.3.
Market Segmentation
1.3.1.Component of
Global Smart Hospitality Market
1.3.2.Deployment of
Global Smart Hospitality Market
1.3.3.Hotel Type of
Global Smart Hospitality Market
1.3.4.Region of
Global Smart Hospitality Market
2.
Executive
Summary
2.1.
Demand Side Trends
2.2.
Key Market Trends
2.3.
Market Demand (US$ Bn) Analysis 2020 – 2024 and Forecast, 2025 – 2033
2.4.
Demand and Opportunity Assessment
2.5.
Demand Supply Scenario
2.6.
Market Dynamics
2.6.1.Drivers
2.6.2.Limitations
2.6.3.Opportunities
2.6.4.Impact
Analysis of Drivers and Restraints
2.7.
Emerging Trends for Smart Hospitality Market
2.8.
Porter’s Five Forces Analysis
2.9.
PEST Analysis
2.10. Key
Regulation
3.
Global
Smart Hospitality Market Estimates & Historical Trend Analysis (2020 - 2024)
4. Global Smart Hospitality Market Estimates & Forecast Trend Analysis, by Component
4.1.
Global Smart Hospitality Market Revenue (US$ Bn) Estimates and
Forecasts, by Component, 2020 - 2033
4.1.1.Software
4.1.1.1.
Property Management System (PMS)
4.1.1.2.
Guest Experience Management System
4.1.1.3.
Integrated Security Management
4.1.1.4.
Facility Management Software/Hotel Building Automation System
(HBAS)
4.1.1.5.
Network Management Software
4.1.1.6.
Point of Sale (POS) Software
4.1.1.7.
Hotel Operation Management
4.1.1.8.
Revenue Management
4.1.1.9.
Room Automation and Control System
4.1.1.10.
Others
4.1.2.Services
4.1.2.1.
Professional
4.1.2.2.
Managed
5. Global Smart Hospitality Market Estimates & Forecast Trend Analysis, by Deployment
5.1.
Global Smart Hospitality Market Revenue (US$ Bn) Estimates and
Forecasts, by Deployment, 2020 - 2033
5.1.1.Cloud-Based
5.1.2.On-Premise
6. Global Smart Hospitality Market Estimates & Forecast Trend Analysis, by Hotel Type
6.1.
Global Smart Hospitality Market Revenue (US$ Bn) Estimates and
Forecasts, by Hotel Type, 2020 - 2033
6.1.1.Business
Hotels
6.1.2.Heritage and
Boutique Hotels
6.1.3.Resorts and
Spas
6.1.4.Luxury Hotels
6.1.5.Cruises
6.1.6.Luxury Yachts
6.1.7.Others
7.
Global
Smart Hospitality Market Estimates & Forecast Trend Analysis, by Region
1.1.
Global Smart Hospitality Market Revenue (US$ Bn) Estimates and
Forecasts, by Region, 2020 - 2033
1.1.1.North America
1.1.2.Europe
1.1.3.Asia Pacific
1.1.4.Middle East
& Africa
1.1.5.Latin America
8.
North America Smart
Hospitality Market: Estimates &
Forecast Trend Analysis
8.1.
North America Smart Hospitality Market Assessments & Key
Findings
8.1.1.North America
Smart Hospitality Market Introduction
8.1.2.North America
Smart Hospitality Market Size Estimates and Forecast (US$ Billion) (2020 - 2033)
8.1.2.1.
By Component
8.1.2.2.
By Deployment
8.1.2.3.
By Hotel Type
8.1.2.4.
By Country
8.1.2.4.1.
The U.S.
8.1.2.4.2.
Canada
9.
Europe Smart
Hospitality Market: Estimates &
Forecast Trend Analysis
9.1.
Europe Smart Hospitality Market Assessments & Key Findings
9.1.1.Europe Smart
Hospitality Market Introduction
9.1.2.Europe Smart
Hospitality Market Size Estimates and Forecast (US$ Billion) (2020 - 2033)
9.1.2.1.
By Component
9.1.2.2.
By Deployment
9.1.2.3.
By Hotel Type
9.1.2.4.
By Country
9.1.2.4.1.
Germany
9.1.2.4.2.
Italy
9.1.2.4.3.
U.K.
9.1.2.4.4.
France
9.1.2.4.5.
Spain
9.1.2.4.6.
Netherland
9.1.2.4.7.
Rest
of Europe
10.
Asia Pacific Smart
Hospitality Market: Estimates &
Forecast Trend Analysis
10.1. Asia
Pacific Market Assessments & Key Findings
10.1.1.
Asia Pacific Smart Hospitality Market Introduction
10.1.2.
Asia Pacific Smart Hospitality Market Size Estimates and Forecast
(US$ Billion) (2020 - 2033)
10.1.2.1.
By Component
10.1.2.2.
By Deployment
10.1.2.3.
By Hotel Type
10.1.2.4.
By Country
10.1.2.4.1.
China
10.1.2.4.2.
Japan
10.1.2.4.3.
India
10.1.2.4.4.
Australia
10.1.2.4.5.
South Korea
10.1.2.4.6. Rest
of Asia Pacific
11.
Middle East & Africa Smart Hospitality Market:
Estimates & Forecast Trend Analysis
11.1. Middle
East & Africa Market Assessments & Key Findings
11.1.1.
Middle East & Africa Smart
Hospitality Market Introduction
11.1.2.
Middle East & Africa Smart
Hospitality Market Size Estimates and Forecast (US$ Billion) (2020 - 2033)
11.1.2.1.
By Component
11.1.2.2.
By Deployment
11.1.2.3.
By Hotel Type
11.1.2.4.
By Country
11.1.2.4.1.
UAE
11.1.2.4.2.
Saudi Arabia
11.1.2.4.3.
South Africa
11.1.2.4.4. Rest of MEA
12.
Latin America Smart
Hospitality Market: Estimates &
Forecast Trend Analysis
12.1. Latin
America Market Assessments & Key Findings
12.1.1.
Latin America Smart Hospitality Market Introduction
12.1.2.
Latin America Smart Hospitality Market Size Estimates and Forecast
(US$ Billion) (2020 - 2033)
12.1.2.1.
By Component
12.1.2.2.
By Deployment
12.1.2.3.
By Hotel Type
12.1.2.4.
By Country
12.1.2.4.1.
Brazil
12.1.2.4.2.
Mexico
12.1.2.4.3.
Argentina
12.1.2.4.4. Rest of LATAM
13.
Country Wise Market: Introduction
14. Competition
Landscape
14.1. Global
Smart Hospitality Market Product Mapping
14.2. Global
Smart Hospitality Market Concentration Analysis, by Leading Players /
Innovators / Emerging Players / New Entrants
14.3. Global
Smart Hospitality Market Tier Structure Analysis
14.4. Global
Smart Hospitality Market Concentration & Company Market Shares (%)
Analysis, 2024
15. Company
Profiles
15.1. Honeywell International Inc.
15.1.1.
Company Overview & Key Stats
15.1.2.
Financial Performance & KPIs
15.1.3.
Product Portfolio
15.1.4.
SWOT Analysis
15.1.5.
Business Strategy & Recent Developments
*
Similar details would be provided for all the players mentioned below
15.2.
IBM Corporation
15.3.
Cisco Systems, Inc.
15.4.
Oracle Corporation
15.5.
Siemens AG
15.6.
Samsung Electronics Co., Ltd.
15.7.
Intel Corporation
15.8.
Microsoft Corporation
15.9.
LG Electronics Inc.
15.10.
Schneider Electric SE
15.11.
Johnson Controls International plc
15.12.
ASSA ABLOY AB
15.13.
Panasonic Corporation
15.14.
Hitachi, Ltd.
15.15.
Zebra Technologies Corporation
15.16.
Agilysys, Inc.
15.17.
Sabre Corporation
15.18.
Amadeus IT Group
15.19.
NEC Corporation
15.20.
Allegion PLC
15.21.
Other Prominent Players
16.
Research
Methodology
16.1. External
Transportations / Databases
16.2. Internal
Proprietary Database
16.3. Primary
Research
16.4. Secondary
Research
16.5. Assumptions
16.6. Limitations
16.7. Report
FAQs
17.
Research
Findings & Conclusion
Our Research Methodology
"Insight without rigor is just noise."
We follow a comprehensive, multi-phase research framework designed to deliver accurate, strategic, and decision-ready intelligence. Our process integrates primary and secondary research , both quantitative and qualitative , along with dual modeling techniques ( top-down and bottom-up) and a final layer of validation through our proprietary in-house repository.
PRIMARY RESEARCH
Primary research captures real-time, firsthand insights from the market to understand behaviors, motivations, and emerging trends.
1. Quantitative Primary Research
Objective: Generate statistically significant data directly from market participants.
Approaches:- Structured surveys with customers, distributors, and field agents
- Mobile-based data collection for point-of-sale audits and usage behavior
- Phone-based interviews (CATI) for market sizing and product feedback
- Online polling around industry events and digital campaigns
- Purchase frequency by customer type
- Channel performance across geographies
- Feature demand by application or demographic
2. Qualitative Primary Research
Objective: Explore decision-making drivers, pain points, and market readiness.
Approaches:- In-depth interviews (IDIs) with executives, product managers, and key decision-makers
- Focus groups among end users and early adopters
- Site visits and observational research for consumer products
- Informal field-level discussions for regional and cultural nuances
SECONDARY RESEARCH
This phase helps establish a macro-to-micro understanding of market trends, size, regulation, and competitive dynamics, sourced from credible and public domain information.
1. Quantitative Secondary Research
Objective: Model market value and segment-level forecasts based on published data.
Sources include:- Financial reports and investor summaries
- Government trade data, customs records, and regulatory statistics
- Industry association publications and economic databases
- Channel performance and pricing data from marketplace listings
- Revenue splits, pricing trends, and CAGR estimates
- Supply-side capacity and volume tracking
- Investment analysis and funding benchmarks
2. Qualitative Secondary Research
Objective: Capture strategic direction, innovation signals, and behavioral trends.
Sources include:- Company announcements, roadmaps, and product pipelines
- Publicly available whitepapers, conference abstracts, and academic research
- Regulatory body publications and policy briefs
- Social and media sentiment scanning for early-stage shifts
- Strategic shifts in market positioning
- Unmet needs and white spaces
- Regulatory triggers and compliance impact

DUAL MODELING: TOP-DOWN + BOTTOM-UP
To ensure robust market estimation, we apply two complementary sizing approaches:
Top-Down Modeling:- Start with broader industry value (e.g., global or regional TAM)
- Apply filters by segment, geography, end-user, or use case
- Adjust with primary insights and validation benchmarks
- Ideal for investor-grade market scans and opportunity mapping
- Aggregate from the ground up using sales volumes, pricing, and unit economics
- Use internal modeling templates aligned with stakeholder data
- Incorporate distributor-level or region-specific inputs
- Most accurate for emerging segments and granular sub-markets
DATA VALIDATION: IN-HOUSE REPOSITORY
We close the loop with proprietary data intelligence built from ongoing projects, industry monitoring, and historical benchmarking. This repository includes:
- Multi-sector market and pricing models
- Key trendlines from past interviews and forecasts
- Benchmarked adoption rates, churn patterns, and ROI indicators
- Industry-specific deviation flags and cross-check logic
- Catches inconsistencies early
- Aligns projections across studies
- Enables consistent, high-trust deliverables