
Solar Energy Market Size and Forecast (2020 - 2033), Global and Regional Growth, Trend, Share and Industry Analysis Report Coverage; Technology (Photovoltaic Systems and Concentrated Solar Power Systems), Solar Module (Monocrystalline, Polycrystalline, Cadmium Telluride, Amorphous Silicon Cells, and Others), Application (Residential, Commercial, and Industrial), End-Use (Electricity Generation, Lighting, Heating, and Charging), and Geography
2026-02-23
Energy & Power
Ekta Chaurasia (Team Lead)
Description
Solar
Energy Market Overview
The global solar
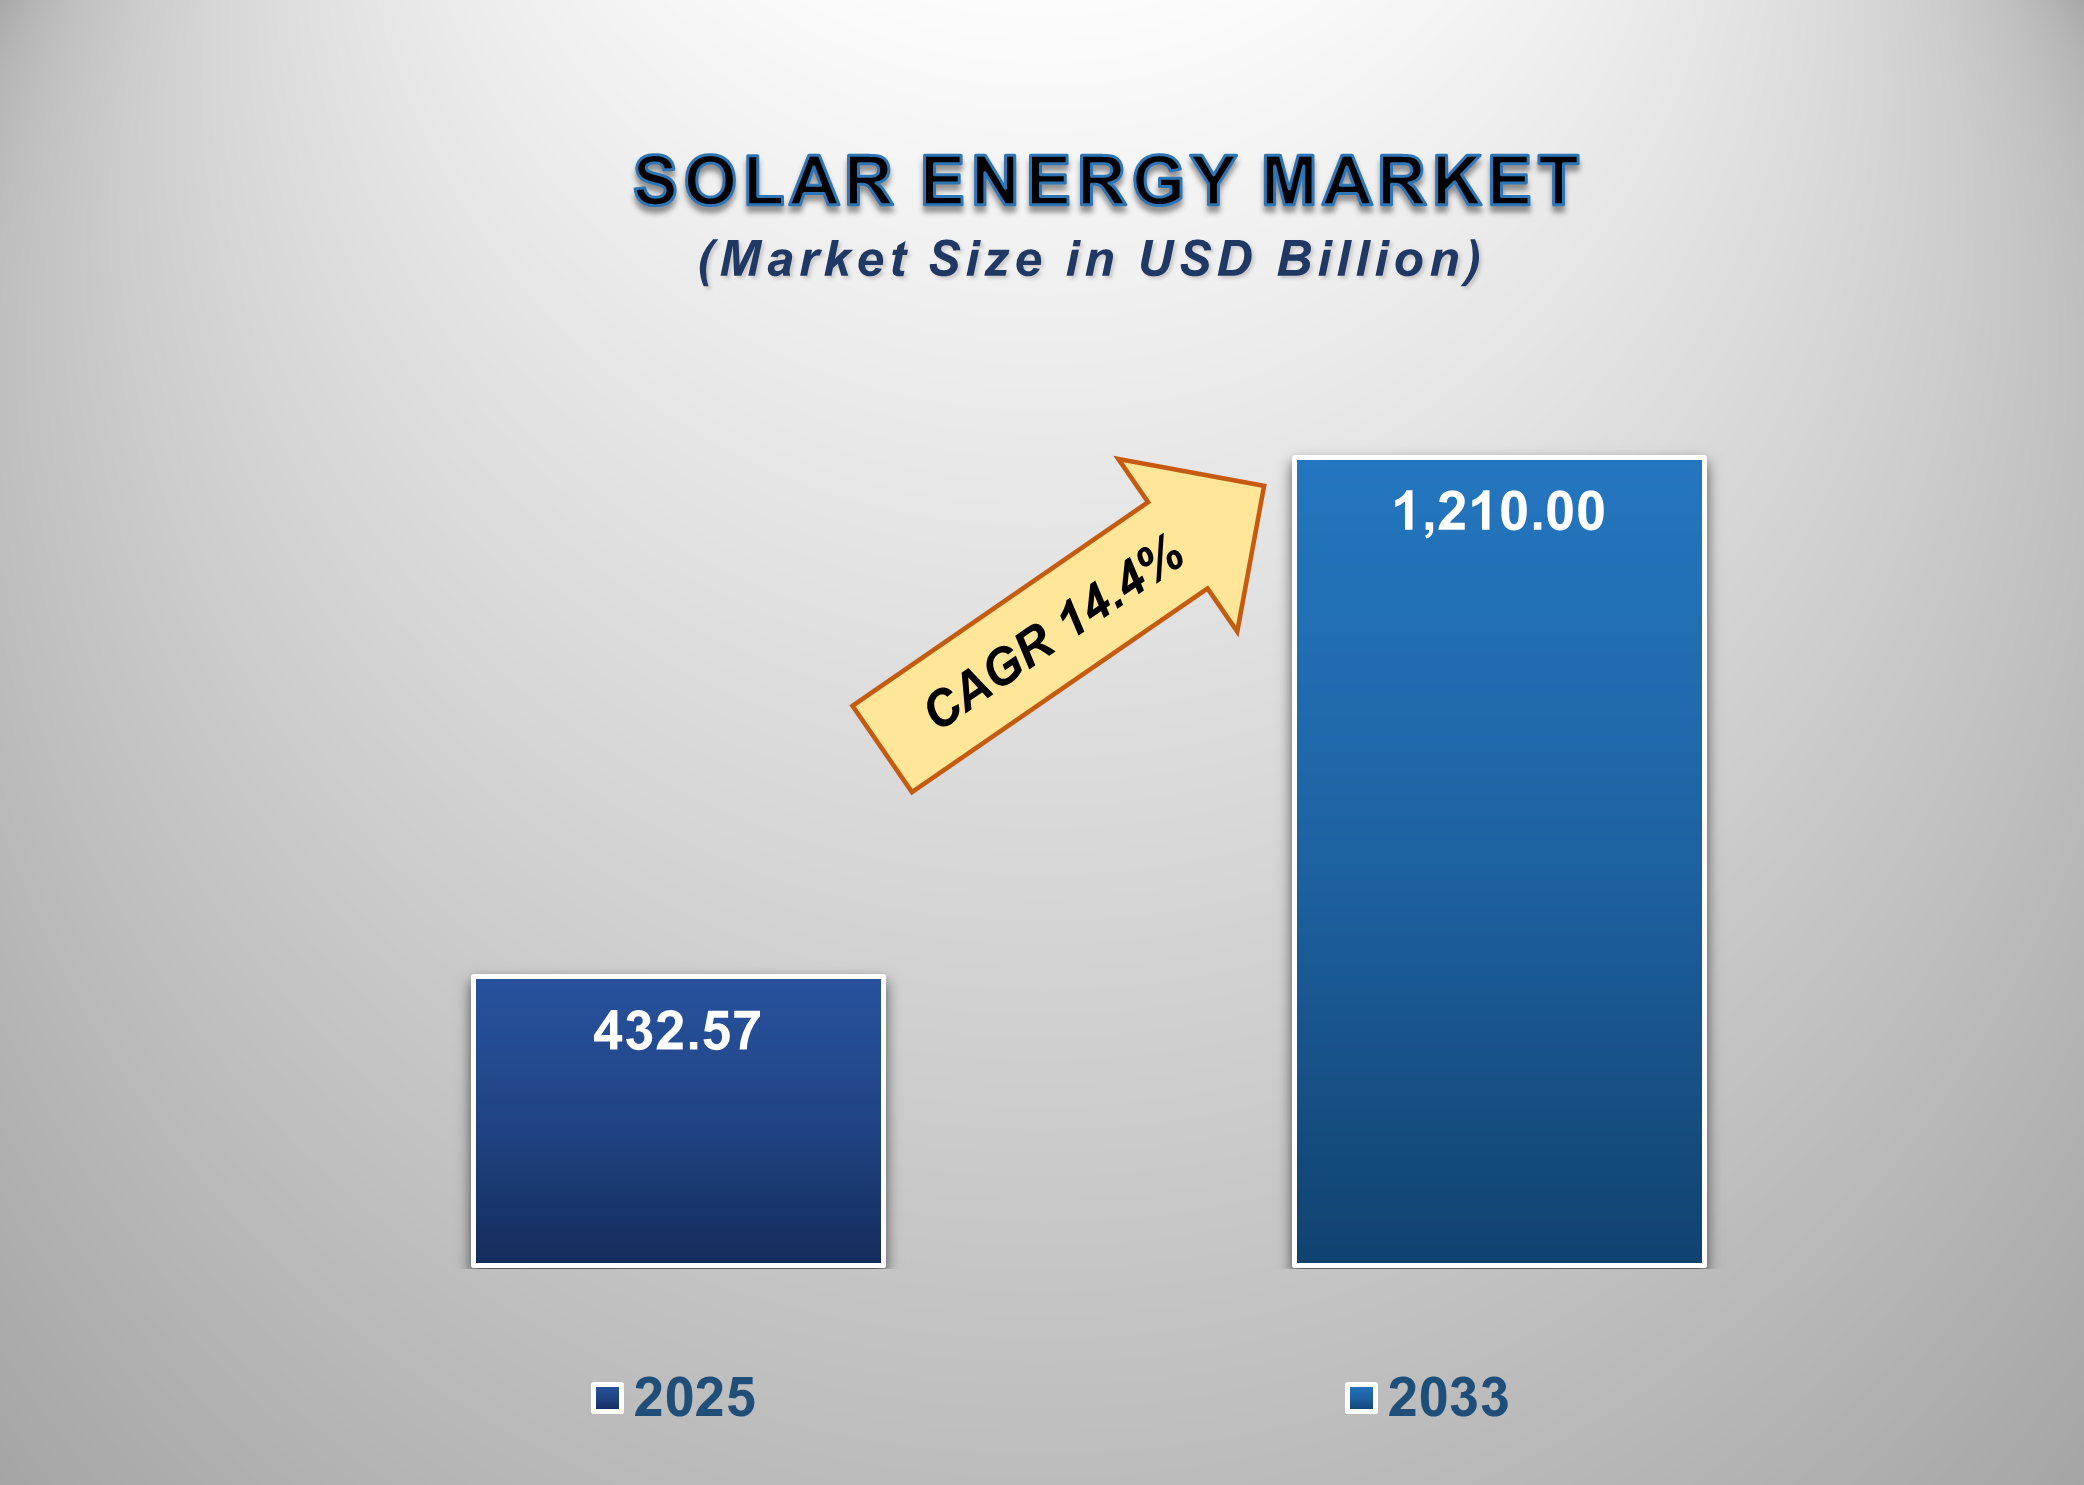
energy market is experiencing strong growth, driven by rising demand for clean energy,
supportive government policies, and declining solar technology costs. Valued
at USD 432.57 billion in 2025, the market is projected to reach USD 1,210.0
billion by 2033, growing at a CAGR of 14.4% during the forecast period.
The solar energy market has become one of the
fastest-growing parts of the global energy market, driven by the pressing need
to cut carbon emissions, falling technology costs, and encouraging government
policies. Solar energy uses concentrated solar power (CSP) systems or
photovoltaic (PV) panels to capture sunlight and produce electricity for
utility-scale, commercial, and domestic uses.
The cost of solar PV modules has drastically
decreased over the last ten years as a result of increased production capacity,
economies of scale, and technological breakthroughs, especially in Asia. In
many areas, solar energy is now one of the most economical ways to generate new
electricity due to its cost competitiveness. While rooftop solar continues to
gain popularity among homes and businesses looking for energy independence and
lower electricity costs, utility-scale solar projects now directly compete with
fossil fuels.
Government initiatives significantly influence
the solar energy market. Solar adoption has expanded in North America, Europe,
China, India, and emerging nations due to policies including feed-in tariffs,
tax subsidies, renewable portfolio standards, and net-metering programs. At the
same time, utilities and major companies are being compelled to make
significant investments in solar power due to corporate sustainability goals
and global climate commitments.
One important market driver is still technological advancement. Advancements
are improving system performance and reliability in energy storage integration,
solar tracking systems, bifacial modules, and panel efficiency. More grid
stability is made possible by the increasing use of battery storage in conjunction
with solar plants, which helps solve intermittency problems.
The grid integration limitations, supply chain
volatility, land scarcity for large projects, and regulatory concerns in some
places are some of the barriers that the solar energy industry faces despite
its promising growth outlook. However, it is anticipated that these
difficulties will be lessened by ongoing funding, encouraging legislation, and
developments in energy storage and smart grids. As a result, the market for
solar energy is expected to develop steadily over the long run and play a
significant part in the world's shift to clean, sustainable, and decentralized
energy systems.
Solar
Energy Market Drivers and Opportunities
Supportive Government Policies and Climate Commitments
Global climate pledges and favorable government policies are major factors driving the adoption of solar energy. Incentives such as tax credits, feed-in tariffs, capital subsidies, renewable purchase obligations, and net metering programs have been implemented in numerous countries to encourage solar installations. International agreements focused on carbon emission reduction and net-zero targets are urging countries to accelerate renewable energy deployment. To achieve energy security objectives, governments are also initiating large-scale infrastructure development projects, including solar parks. Financing of renewable projects by financial institutions and multilateral organizations is increasing, further boosting investment flows into the sector. These regulatory frameworks reduce investment risks, enhance project viability, and encourage participation from both domestic and international players in the solar energy market.
Declining Cost of Solar Technologies
The continuous decline in the cost of photovoltaic (PV) modules and related components is one of the primary drivers of the solar energy market. Over the past decade, the levelized cost of electricity (LCOE) from solar systems has decreased significantly due to economies of scale, technological advancements, and improved manufacturing efficiencies. Mass production, particularly in Asia-Pacific manufacturing hubs, has reduced module prices, while efficiency improvements have increased energy output per panel. Installation costs have also declined due to advancements in mounting systems, inverters, and balance-of-system components. As solar energy becomes cost-competitive—or even cheaper than traditional fossil fuel-based generation in many regions—utilities, commercial users, and residential customers are increasingly adopting solar solutions, accelerating global market growth.
Expansion of Energy Storage Integration
The integration of solar power with advanced energy storage systems presents significant growth potential for the solar energy market. Since solar generation is intermittent and dependent on sunlight availability, battery storage technologies enable energy to be stored and dispatched when needed, improving grid reliability and stability. Declining lithium-ion battery costs and technological advancements in storage solutions are making solar-plus-storage systems increasingly viable for residential, commercial, and utility-scale applications. This integration enhances energy independence, reduces peak demand charges, and supports microgrid development in remote and underserved areas. Additionally, growing electrification trends, such as smart grids and electric vehicles, are further increasing global demand for integrated renewable energy and storage solutions.
Solar Energy Market Scope
|
Report Attributes |
Description |
|
Market Size in
2025 |
USD 432.57
Billion |
|
Market Forecast
in 2033 |
USD 1,210.0
Billion |
|
CAGR % 2025-2033 |
14.4% |
|
Base Year |
2024 |
|
Historic Data |
2020-2024 |
|
Forecast Period |
2025-2033 |
|
Report USP |
Comprehensive
global Solar Energy Market size and forecast analysis, product technology and
system type assessment, distribution channel performance evaluation, end-user
consumption and deployment trends, utility-scale vs residential &
commercial segment insights, regional and country-level market dynamics,
competitive landscape and market share analysis, technological advancements
in PV, CSP, and energy storage integration, digital transformation and smart
grid impact, growth drivers, challenges, opportunities, and strategic
insights for solar technology manufacturers, project developers, EPC
contractors, investors, utilities, and policy makers |
|
Segments Covered |
●
By
Technology ●
By Solar
Module ●
By
Application ●
By End
Use |
|
Regional Scope |
●
North
America ●
Europe ●
APAC ●
Latin
America ●
Middle
East and Africa |
|
Country Scope |
1)
U.S. 2)
Canada
3)
U.K. 4)
Germany
5)
France
6)
Italy 7)
Spain 8)
Switzerland
9)
China
10)
India
11)
Japan 12)
South
Korea 13)
Australia 14)
Mexico
15)
Brazil
16)
Argentina
17)
Saudi
Arabia 18)
UAE 19)
South
Africa |
Solar Energy
Market Report Segmentation Analysis
The global Solar Energy
Market Analysis is segmented by Technology, Solar Module, Application, End Use,
and Region.
The Photovoltaic
Systems segment dominated the market in 2025 and is projected to grow at the
highest CAGR during the forecast period.
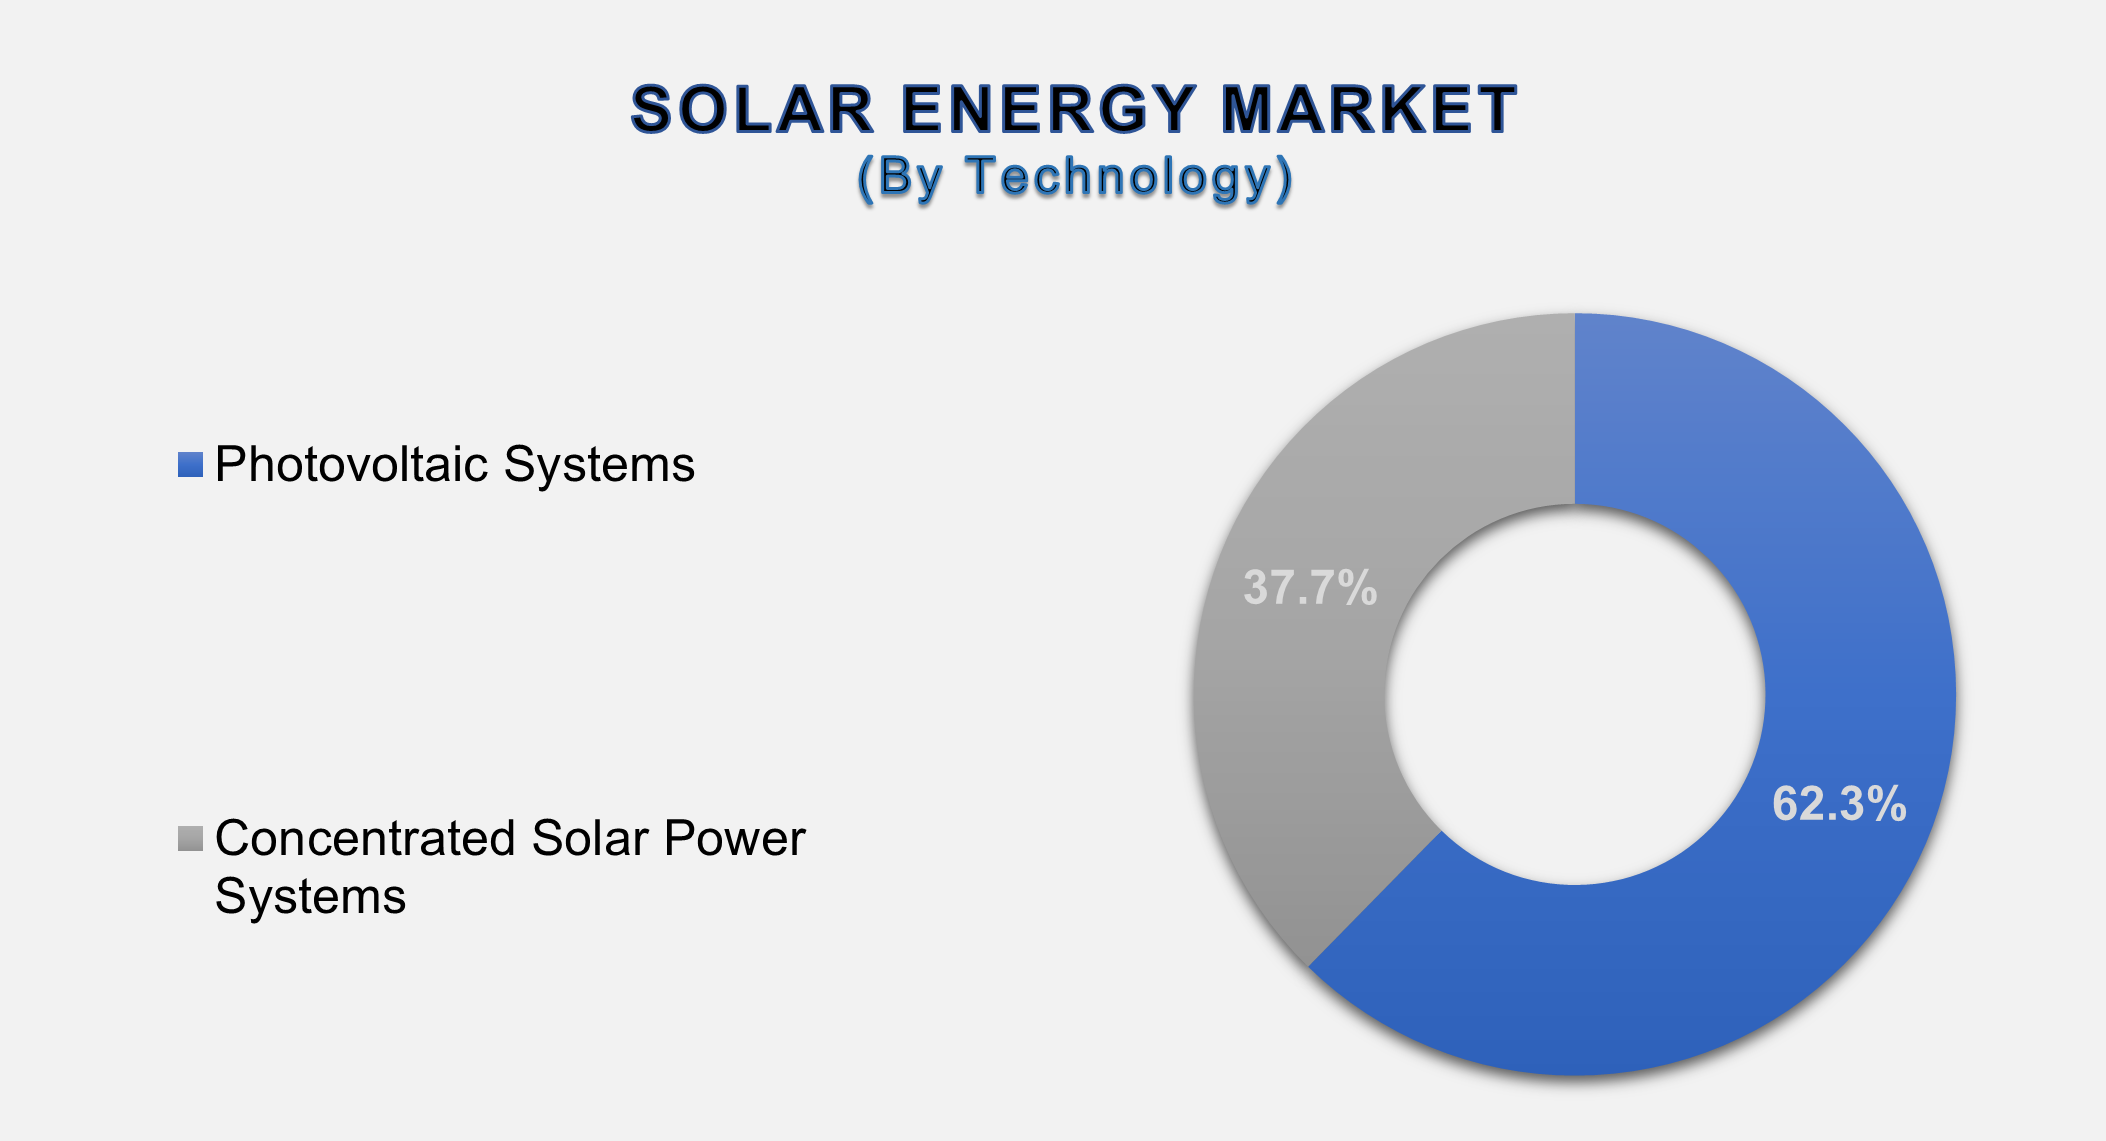
By Technology, the
solar energy market is segmented into photovoltaic systems and concentrated
solar power systems. The photovoltaic systems segment accounts for the largest
share of the global solar energy market. Solar radiation levels, system
orientation and tilt angle, module efficiency, temperature conditions, and
shading losses are important variables that affect photovoltaic (PV) systems.
Performance and lifetime are strongly impacted by the quality of parts,
including panels, inverters, and mounting structures. Other important factors
are grid connectivity, installation quality, and maintenance procedures.
Adoption and deployment of PV systems are also significantly impacted by
government incentives, financing alternatives, regulations, and falling
technology costs.
Polycrystalline
holds the highest share of the Solar Module Segment over the forecast period
Based on Solar Module, the market is bifurcated into monocrystalline,
polycrystalline, cadmium telluride, amorphous silicon cells, and others. The
polycrystalline segment accounts for the largest share of the market. Compared
to monocrystalline solar panels, polycrystalline solar panels have moderate
efficiency levels, simpler production procedures, and cheaper manufacturing
costs. For large-scale and budget-conscious undertakings, they provide an
affordable option. However, their adoption is impacted by things like
decreasing monocrystalline technology costs, increased space needs, and reduced
energy conversion efficiency. The availability of raw materials, local
cost-performance choices, and environmental conditions influence market demand.
The Industrial
Segment will probably dominate the market during the forecast period
In terms of
Application, the Solar Energy Market is segmented into residential, commercial,
and industrial. The industrial segment holds the largest share of the Solar
Energy Market. High and ongoing energy demand, growing electricity costs, and
the desire to reduce carbon emissions are the main factors driving the
development of solar energy in industrial applications. Solar energy is used by
industries for load control, captive power generation, and manufacturing
processes. Adoption is also aided by favorable government incentives, falling
installation prices, and corporate sustainability objectives. Solar systems
also provide long-term cost stability for energy-intensive industrial
operations, improve energy security, and lessen reliance on grid power.
Electricity Generation holds the highest share of
the End Use Segment over the forecast period
Based on End Use,
the market is bifurcated into electricity generation, lighting, heating, and
charging. The electricity generation segment accounts for the largest share of
the market. Rising urbanization and population, industrial growth, more
electrification of transportation and heating, and the usage of digital
technology and data centers are all end-use factors contributing to electricity
generation. Residential and commercial electricity usage is rising due to
changes in lifestyle and economic growth. Demand patterns are further
influenced by government policies that support electrification and the
integration of renewable energy sources. The end-use demand for electricity
generation is also significantly influenced by grid reliability requirements,
energy efficiency standards, and peak-load management requirements.
The following
segments are part of an in-depth analysis of the global Solar Energy Market:
|
Market Segments |
|
|
By
Technology |
●
Photovoltaic
Systems ●
Concentrated
Solar Power Systems |
|
By
Solar Module |
●
Monocrystalline ●
Polycrystalline ●
Cadmium
Telluride ●
Amorphous
Silicon Cells ●
Others |
|
By
Application |
●
Residential ●
Commercial ●
Industrial |
|
By End
Use |
●
Electricity
Generation ●
Lighting ●
Heating ●
Charging |
Solar Energy Market Share Analysis by
Region
The Asia-Pacific
region is projected to hold the largest share of the global solar energy market
over the forecast period.
The
Asia-Pacific region is projected to hold the largest share of the global solar
energy market over the forecast period and is also expected to be the
fastest-growing region. The global market for solar energy is dominated by the
Asia-Pacific region due to significant investments in renewable energy, fast
industrialization, and robust legislation. In terms of solar production and
installations, China is in the lead, followed by Japan, Australia, and India.
Utility-scale and rooftop solar usage is increasing due to falling
technological costs, government incentives, and growing electricity demand.
Solar deployment is increasing in emerging Southeast Asian economies to support
sustainability and energy security objectives.
Global
Solar Energy Market Recent Developments News:
●
In May 2025,
SoftBank led the $130 million in funding that Terabase Energy obtained to
increase the use of solar technologies and robotics-assisted construction
techniques, increasing productivity and project scaling.
●
In December
2025, Petrobras entered the solar energy market and diversified into renewable
energy by signing an agreement to purchase a 49.99% share in Lightsource bp's
Brazilian subsidiaries.
●
In May 2025,
Amplus Solar strengthened its market presence by signing significant renewable
power procurement agreements with commercial and industrial clients.
The
Global Solar Energy Market is dominated by a few large companies, such as
●
NextEra Energy
●
LONGi Green
Energy Technology
●
First Solar
●
Trina Solar
●
JinkoSolar
●
Canadian Solar
●
JA Solar
●
SolarEdge
Technologies
●
Sungrow Power
Supply
●
Enphase Energy
●
Sunrun
●
Hanwha Q CELLS
●
Risen Energy
●
Array
Technologies
●
Nextracker
●
GCL-Poly
Energy
●
Adani Green
Energy
●
Tata Power
Solar
●
Waaree
Energies
● Vikram Solar
Frequently Asked Questions
Ekta Chaurasia (Team Lead)
Ekta Chaurasia is a highly experienced Team Lead at M2Square Consultancy with over 7 years of expertise in market research, strategic consulting, competitive benchmarking, and business intelligence solutions. She specializes in ICT, semiconductors & electronics, automotive & transportation, and industrial machinery markets.
She leads end-to-end global research projects focused on market trends, industry analysis, growth forecasting, customer insights, and strategic decision-making. Known for her analytical leadership and industry expertise, Ekta helps businesses uncover growth opportunities, evaluate competitive landscapes, and stay ahead in rapidly evolving markets through accurate and insight-driven research.
1.
Global Solar Energy Market Introduction and Market Overview
1.1.
Objectives of the Study
1.2.
Global Solar Energy Market Scope and Market Estimation
1.2.1.Global Solar
Energy Overall Market Size (US$ Bn), Market CAGR (%), Market forecast (2025 - 2033)
1.2.2.Global Solar
Energy Market Revenue Share (%) and Growth Rate (Y-o-Y) from 2020 - 2033
1.3.
Market Segmentation
1.3.1.Technology of
Global Solar Energy Market
1.3.2.Solar Module of
Global Solar Energy Market
1.3.3.Application of
Global Solar Energy Market
1.3.4.End Use of
Global Solar Energy Market
1.3.5.Region of
Global Solar Energy Market
2.
Executive
Summary
2.1.
Demand Side Trends
2.2.
Key Market Trends
2.3.
Market Demand (US$ Bn) Analysis 2020 – 2024 and Forecast, 2025 – 2033
2.4.
Demand and Opportunity Assessment
2.5.
Market Dynamics
2.5.1.Drivers
2.5.2.Limitations
2.5.3.Opportunities
2.5.4.Impact
Analysis of Drivers and Restraints
2.6.
Porter’s Five Forces Analysis
2.7.
PEST Analysis
2.8.
Key Regulation
2.9.
Key Developments
2.10. Value
Chain / Ecosystem Analysis
3.
Global
Solar Energy Market Estimates & Historical Trend Analysis (2020 - 2024)
4. Global Solar Energy Market Estimates & Forecast Trend Analysis, by Technology
4.1.
Global Solar Energy Market Revenue (US$ Bn) Estimates and
Forecasts, by Technology, 2020 - 2033
4.1.1.Photovoltaic
Systems
4.1.2.Concentrated
Solar Power Systems
5. Global Solar Energy Market Estimates & Forecast Trend Analysis, by Solar Module
5.1.
Global Solar Energy Market Revenue (US$ Bn) Estimates and
Forecasts, by Solar Module, 2020 - 2033
5.1.1.Monocrystalline
5.1.2.Polycrystalline
5.1.3.Cadmium
Telluride
5.1.4.Amorphous
Silicon Cells
5.1.5.Others
6. Global Solar Energy Market Estimates & Forecast Trend Analysis, by Application
6.1.
Global Solar Energy Market Revenue (US$ Bn) Estimates and
Forecasts, by Application, 2020 - 2033
6.1.1.Residential
6.1.2.Commercial
6.1.3.Industrial
7. Global Solar Energy Market Estimates & Forecast Trend Analysis, by End Use
7.1.
Global Solar Energy Market Revenue (US$ Bn) Estimates and
Forecasts, by End Use, 2020 - 2033
7.1.1.Electricity
Generation
7.1.2.Lighting
7.1.3.Heating
7.1.4.Charging
8.
Global
Solar Energy Market Estimates & Forecast Trend Analysis, by Region
8.1.
Global Solar Energy Market Revenue (US$ Bn) Estimates and
Forecasts, by Region, 2020 - 2033
8.1.1.North America
8.1.2.Europe
8.1.3.Asia Pacific
8.1.4.Middle East
& Africa
8.1.5.Latin America
9.
North America Solar
Energy Market: Estimates & Forecast
Trend Analysis
9.1.
North America Solar Energy Market Assessments & Key Findings
9.1.1.North America
Solar Energy Market Introduction
9.1.2.North America
Solar Energy Market Size Estimates and Forecast (US$ Billion) (2020 - 2033)
9.1.2.1. By Technology
9.1.2.2. By Solar Module
9.1.2.3. By Application
9.1.2.4. By End Use
9.1.2.5.
By Country
9.1.2.5.1.
The U.S.
9.1.2.5.2.
Canada
10.
Europe Solar
Energy Market: Estimates & Forecast
Trend Analysis
10.1. Europe
Solar Energy Market Assessments & Key Findings
10.1.1.
Europe Solar Energy Market Introduction
10.1.2.
Europe Solar Energy Market Size Estimates and Forecast (US$ Billion)
(2020 - 2033)
10.1.2.1. By Technology
10.1.2.2. By Solar Module
10.1.2.3. By Application
10.1.2.4. By End Use
10.1.2.5. By
Country
10.1.2.5.1.
Germany
10.1.2.5.2.
Italy
10.1.2.5.3.
U.K.
10.1.2.5.4.
France
10.1.2.5.5.
Spain
10.1.2.5.6.
Russia
10.1.2.5.7. Rest of Europe
11.
Asia Pacific Solar
Energy Market: Estimates & Forecast
Trend Analysis
11.1. Asia
Pacific Solar Energy Market Assessments & Key Findings
11.1.1.
Asia Pacific Solar Energy Market Introduction
11.1.2.
Asia Pacific Solar Energy Market Size Estimates and Forecast (US$ Billion)
(2020 - 2033)
11.1.2.1. By Technology
11.1.2.2. By Solar Module
11.1.2.3. By Application
11.1.2.4. By End Use
11.1.2.5.
By Country
11.1.2.5.1.
China
11.1.2.5.2.
Japan
11.1.2.5.3.
India
11.1.2.5.4.
Australia
11.1.2.5.5.
South Korea
11.1.2.5.6. Rest
of Asia Pacific
12.
Middle East & Africa Solar Energy Market:
Estimates & Forecast Trend Analysis
12.1. Middle
East & Africa Solar Energy Market Assessments & Key Findings
12.1.1.
Middle East & Africa Solar
Energy Market Introduction
12.1.2.
Middle East & Africa Solar
Energy Market Size Estimates and Forecast (US$ Billion) (2020 - 2033)
12.1.2.1. By Technology
12.1.2.2. By Solar Module
12.1.2.3. By Application
12.1.2.4. By End Use
12.1.2.5.
By Country
12.1.2.5.1.
UAE
12.1.2.5.2.
Saudi Arabia
12.1.2.5.3.
South Africa
12.1.2.5.4. Rest of MEA
13.
Latin America Solar
Energy Market: Estimates & Forecast
Trend Analysis
13.1. Latin
America Event Industry Assessments & Key Findings
13.1.1.
Latin America Solar Energy Market Introduction
13.1.2.
Latin America Solar Energy Market Size Estimates and Forecast (US$
Billion) (2020 - 2033)
13.1.2.1. By Technology
13.1.2.2. By Solar Module
13.1.2.3. By Application
13.1.2.4. By End Use
13.1.2.5.
By Country
13.1.2.5.1.
Brazil
13.1.2.5.2.
Mexico
13.1.2.5.3.
Argentina
13.1.2.5.4. Rest of LATAM
14.
Country Wise Market: Introduction
15. Competition
Landscape
15.1. Global
Solar Energy Market Product Mapping
15.2. Global
Solar Energy Market Concentration Analysis, by Leading Players / Innovators /
Emerging Players / New Entrants
15.3. Global
Solar Energy Market Tier Structure Analysis
15.4. Global
Solar Energy Market Concentration & Company Market Shares (%) Analysis, 2024
16. Company
Profiles
16.1.
NextEra Energy
16.1.1.
Company Overview & Key Stats
16.1.2.
Financial Performance & KPIs
16.1.3.
Product Portfolio
16.1.4.
SWOT Analysis
16.1.5.
Business Strategy & Recent Developments
*
Similar details would be provided for all the players mentioned below
16.2.
LONGi Green Energy Technology
16.3.
First Solar
16.4.
Trina Solar
16.5.
JinkoSolar
16.6.
Canadian Solar
16.7.
JA Solar
16.8.
SolarEdge Technologies
16.9.
Sungrow Power Supply
16.10.
Enphase Energy
16.11.
Sunrun
16.12.
Hanwha Q CELLS
16.13.
Risen Energy
16.14.
Array Technologies
16.15.
Nextracker
16.16.
GCL-Poly Energy
16.17.
Adani Green Energy
16.18.
Tata Power Solar
16.19.
Waaree Energies
16.20.
Other Prominent Players
17.
Research
Methodology
17.1. External
Transportations / Databases
17.2. Internal
Proprietary Database
17.3. Primary
Research
17.4. Secondary
Research
17.5. Assumptions
17.6. Limitations
17.7. Report
FAQs
18.
Research
Findings & Conclusion
Our Research Methodology
"Insight without rigor is just noise."
We follow a comprehensive, multi-phase research framework designed to deliver accurate, strategic, and decision-ready intelligence. Our process integrates primary and secondary research , both quantitative and qualitative , along with dual modeling techniques ( top-down and bottom-up) and a final layer of validation through our proprietary in-house repository.
PRIMARY RESEARCH
Primary research captures real-time, firsthand insights from the market to understand behaviors, motivations, and emerging trends.
1. Quantitative Primary Research
Objective: Generate statistically significant data directly from market participants.
Approaches:- Structured surveys with customers, distributors, and field agents
- Mobile-based data collection for point-of-sale audits and usage behavior
- Phone-based interviews (CATI) for market sizing and product feedback
- Online polling around industry events and digital campaigns
- Purchase frequency by customer type
- Channel performance across geographies
- Feature demand by application or demographic
2. Qualitative Primary Research
Objective: Explore decision-making drivers, pain points, and market readiness.
Approaches:- In-depth interviews (IDIs) with executives, product managers, and key decision-makers
- Focus groups among end users and early adopters
- Site visits and observational research for consumer products
- Informal field-level discussions for regional and cultural nuances
SECONDARY RESEARCH
This phase helps establish a macro-to-micro understanding of market trends, size, regulation, and competitive dynamics, sourced from credible and public domain information.
1. Quantitative Secondary Research
Objective: Model market value and segment-level forecasts based on published data.
Sources include:- Financial reports and investor summaries
- Government trade data, customs records, and regulatory statistics
- Industry association publications and economic databases
- Channel performance and pricing data from marketplace listings
- Revenue splits, pricing trends, and CAGR estimates
- Supply-side capacity and volume tracking
- Investment analysis and funding benchmarks
2. Qualitative Secondary Research
Objective: Capture strategic direction, innovation signals, and behavioral trends.
Sources include:- Company announcements, roadmaps, and product pipelines
- Publicly available whitepapers, conference abstracts, and academic research
- Regulatory body publications and policy briefs
- Social and media sentiment scanning for early-stage shifts
- Strategic shifts in market positioning
- Unmet needs and white spaces
- Regulatory triggers and compliance impact

DUAL MODELING: TOP-DOWN + BOTTOM-UP
To ensure robust market estimation, we apply two complementary sizing approaches:
Top-Down Modeling:- Start with broader industry value (e.g., global or regional TAM)
- Apply filters by segment, geography, end-user, or use case
- Adjust with primary insights and validation benchmarks
- Ideal for investor-grade market scans and opportunity mapping
- Aggregate from the ground up using sales volumes, pricing, and unit economics
- Use internal modeling templates aligned with stakeholder data
- Incorporate distributor-level or region-specific inputs
- Most accurate for emerging segments and granular sub-markets
DATA VALIDATION: IN-HOUSE REPOSITORY
We close the loop with proprietary data intelligence built from ongoing projects, industry monitoring, and historical benchmarking. This repository includes:
- Multi-sector market and pricing models
- Key trendlines from past interviews and forecasts
- Benchmarked adoption rates, churn patterns, and ROI indicators
- Industry-specific deviation flags and cross-check logic
- Catches inconsistencies early
- Aligns projections across studies
- Enables consistent, high-trust deliverables