
Tethered Caps Market Size and Forecast (2025–2033), Global and Regional Growth, Trend, Share and Industry Analysis Report Coverage: By Material (Polyethylene (PE), Polypropylene (PP), Polyethylene Terephthalate (PET), Others), By Application (Beverages, Pharmaceuticals, Others), and Geography
2026-02-25
Chemicals & Materials
Description
Tethered
Caps Market Overview
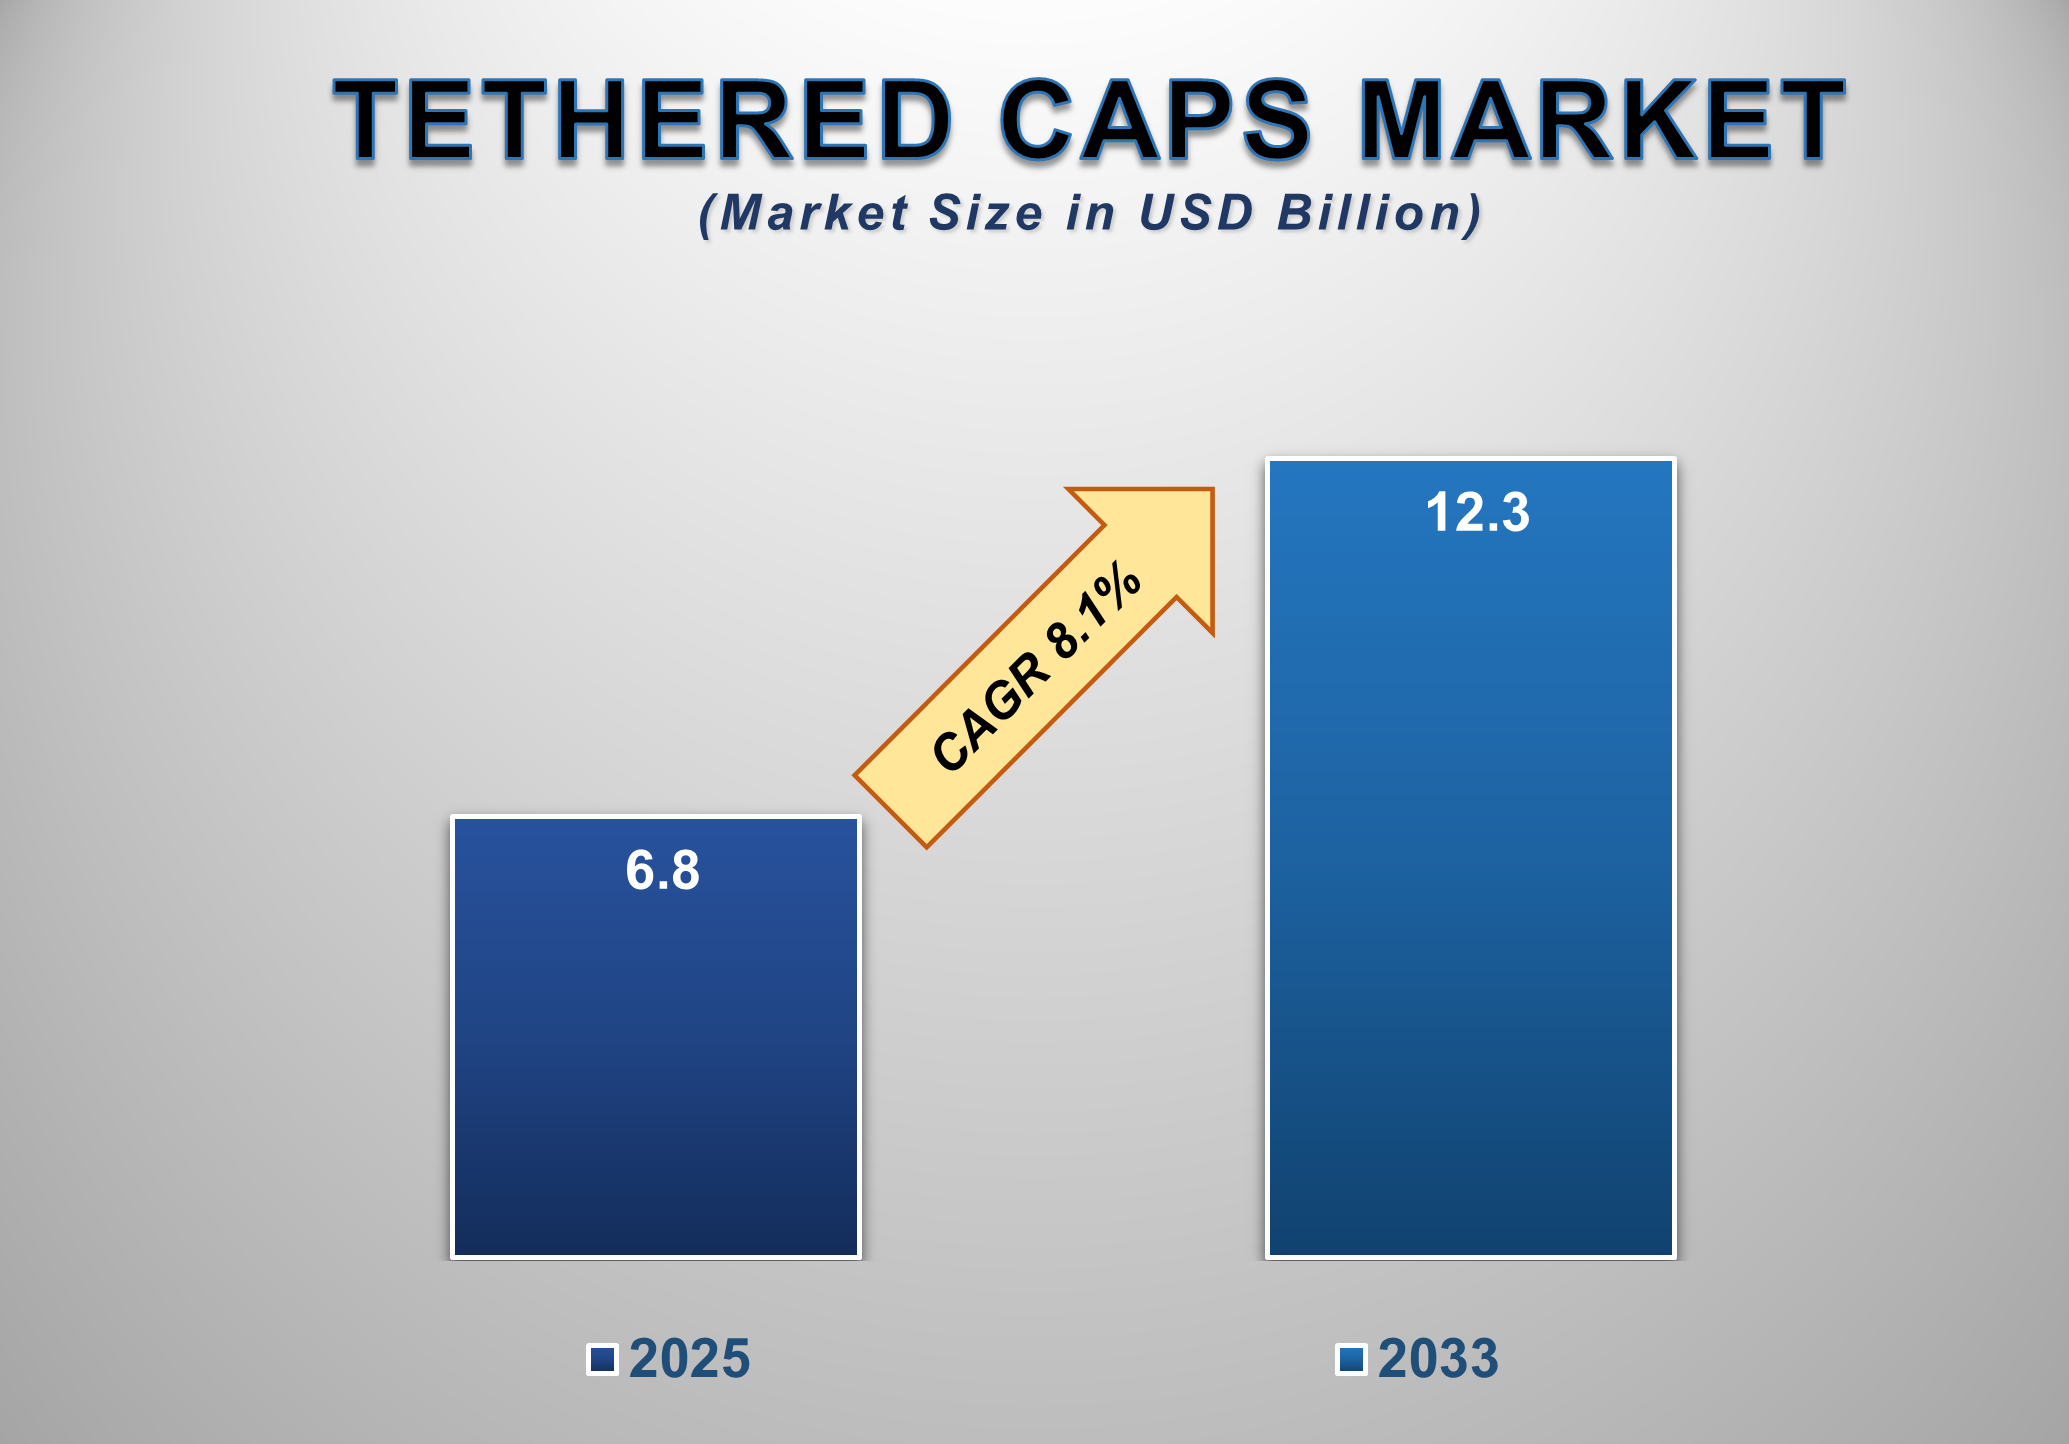
The global tethered caps market was valued at USD 6.8 billion in 2025 and is projected to reach USD 12.3 billion by 2033, registering a CAGR of 8.1% during the forecast period. Market growth is primarily driven by rising regulatory pressure to reduce plastic waste, increasing adoption of sustainable packaging solutions, and strong demand from the beverages industry. Tethered caps, which remain attached to containers after opening, are increasingly being adopted as an effective solution to prevent cap littering and improve recyclability.
Governments and regulatory
authorities across multiple regions have introduced stringent packaging waste
directives, particularly targeting single-use plastics. In response, beverage
manufacturers and packaging companies are rapidly transitioning toward tethered
closures to comply with environmental regulations and enhance sustainability
credentials. The implementation of the European Union’s Single-Use Plastics
Directive has had a ripple effect globally, encouraging brand owners to
proactively adopt tethered cap designs even in regions where regulations are
still evolving. Additionally, growing consumer awareness regarding plastic
pollution and recycling practices is accelerating the shift toward
environmentally responsible packaging formats. Major beverage brands are
increasingly positioning tethered caps as part of broader sustainability
initiatives, reinforcing their market acceptance. Technological advancements in
cap design, material optimization, and manufacturing efficiency have further
improved product performance, ease of use, and cost competitiveness. As
sustainability becomes a core pillar of packaging innovation, the tethered caps
market is expected to witness sustained growth through 2033.
Tethered Caps Market
Drivers and Opportunities
Stringent Environmental
Regulations Are Driving Market Growth
The increasing implementation of
environmental regulations aimed at reducing plastic waste is a key driver of
the tethered caps market. Regulatory bodies across Europe, North America, and
parts of the Asia Pacific are enforcing measures to minimize plastic leakage
into the environment, particularly from beverage packaging. Tethered caps
directly address this challenge by ensuring that caps remain attached to
containers throughout the product lifecycle, significantly reducing the risk of
littering. The European Union’s mandate requiring tethered caps on beverage
containers has played a pivotal role in accelerating global adoption.
Multinational beverage companies operating across regions are standardizing
packaging formats to maintain regulatory compliance and operational efficiency.
This has led to widespread investments in tethered cap technologies across
global production facilities. Furthermore, extended producer responsibility
(EPR) frameworks are pushing manufacturers to take greater accountability for packaging
waste. Tethered caps support EPR goals by improving collection rates and
recycling outcomes. As additional countries introduce similar waste reduction
policies, regulatory compliance will remain a strong catalyst for market
expansion.
Rising Beverage
Consumption and Sustainable Packaging Demand Are Fueling Adoption
The growing consumption of
bottled beverages, including water, carbonated drinks, juices, and functional
beverages, is another major driver supporting tethered caps demand. As beverage
volumes rise globally, particularly in urbanizing and developing regions, the
environmental footprint of packaging has become a critical concern for both
regulators and brand owners. Beverage manufacturers are increasingly
integrating sustainability into their brand strategies, viewing packaging
innovation as a differentiating factor. Tethered caps not only reduce
environmental impact but also enhance consumer convenience by preventing cap
loss and improving on-the-go usability. These functional benefits have
contributed to positive consumer perception and broader acceptance. In
addition, leading packaging suppliers have optimized tethered cap designs to
ensure compatibility with high-speed filling lines, minimizing disruption to
existing manufacturing processes. This has lowered adoption barriers and
encouraged faster transition across beverage packaging formats. As sustainable
packaging becomes a non-negotiable requirement for beverage brands, tethered
caps are expected to see continued demand growth.
Expansion into
Pharmaceuticals and Emerging Markets Presents Key Opportunities
Beyond beverages, the expansion of tethered caps into pharmaceutical and healthcare packaging presents a significant growth opportunity. Pharmaceutical packaging increasingly prioritizes safety, tamper evidence, and controlled disposal, making tethered caps an attractive solution for liquid medicines, syrups, and diagnostic products. Emerging markets in the Asia Pacific, Latin America, and the Middle East & Africa also represent untapped growth potential. While regulatory enforcement in these regions is still developing, growing awareness of plastic pollution and increasing alignment with global sustainability standards are driving gradual adoption. Multinational packaging suppliers are actively introducing tethered cap solutions tailored to local market needs and cost structures. Moreover, ongoing innovation in bio-based and recyclable materials is expected to enhance the sustainability profile of tethered caps further. As material science advances and production costs decline, tethered caps are likely to penetrate a wider range of applications, creating long-term growth opportunities.
Tethered Caps Market
Scope
|
Report Attributes |
Description |
|
Market Size in 2025 |
USD 6.8 Billion |
|
Market Forecast in 2033 |
USD 12.3 Billion |
|
CAGR % 2025-2033 |
8.1% |
|
Base Year |
2024 |
|
Historic Data |
2020-2024 |
|
Forecast Period |
2025-2033 |
|
Report USP |
Production, Consumption, Company
Share, Company Heatmap, Company Production Capacity, Growth Factors, and more |
|
Segments Covered |
●
By Material ●
By Application |
|
Regional Scope |
●
North America ●
Europe ●
APAC ●
Latin America ●
Middle East and
Africa |
|
Country Scope |
1)
U.S. 2)
Canada 3)
U.K. 4)
Germany 5)
France 6)
Italy 7)
Spain 8)
Russia 9)
China 10)
India 11)
Japan 12)
South Korea 13)
Australia 14)
Mexico 15)
Brazil 16)
Saudi Arabia 17)
UAE 18)
South Africa
|
Tethered Caps Market
Report Segmentation Analysis
The Global Tethered Caps Market
Industry Analysis Is Segmented Into By Material, By Application, And By Region.
Polyethylene (PE) Segment
Is Expected to Dominate the Tethered Caps Market During the Forecast Period
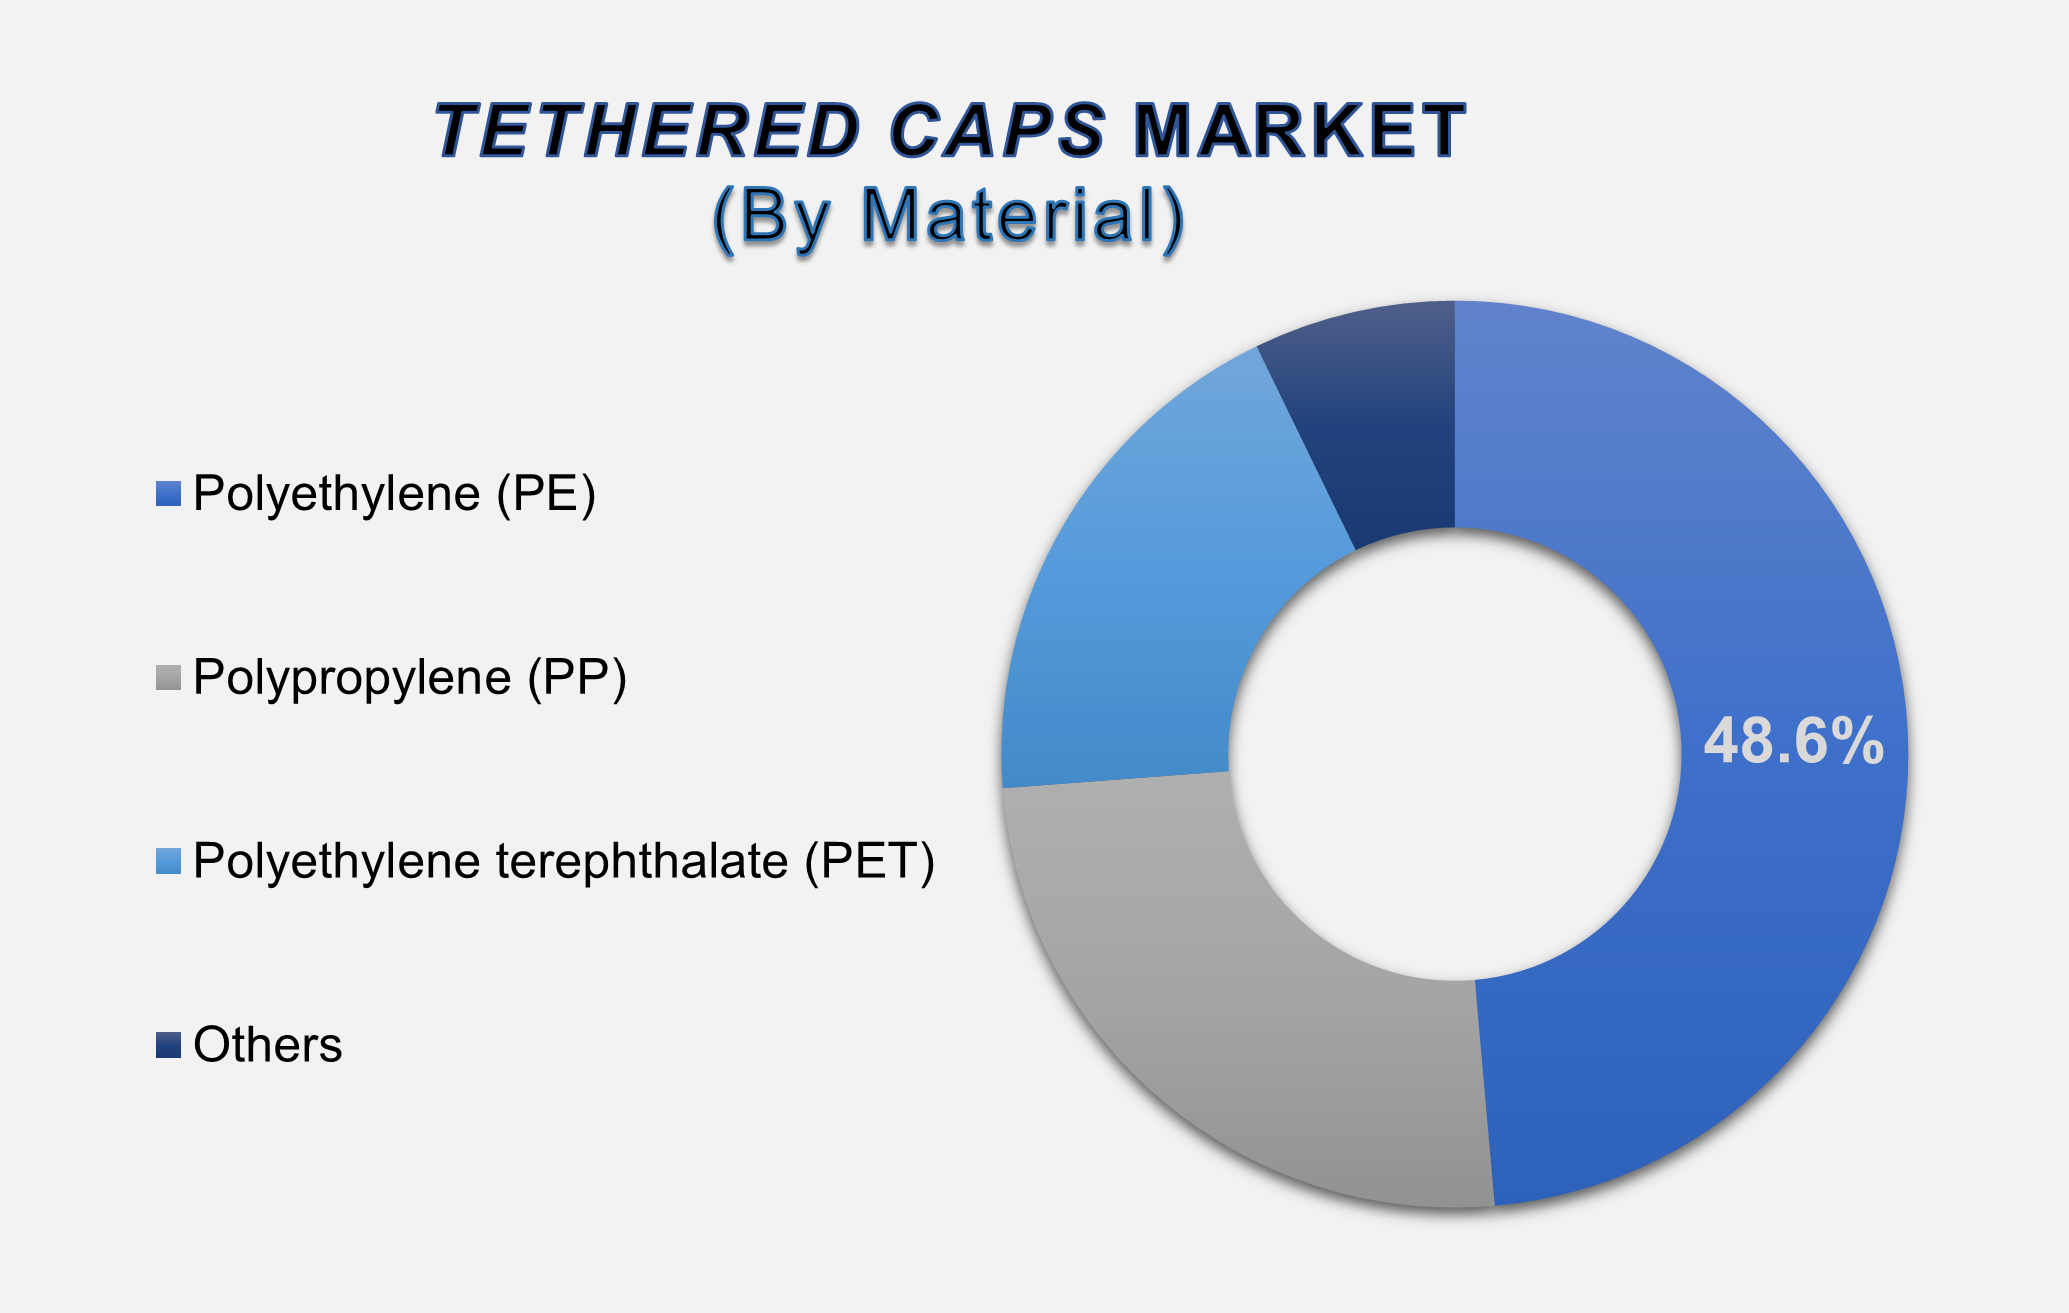
The polyethylene (PE) segment accounted for approximately 48.6% of the global tethered caps market, making it the leading material segment. PE is widely preferred due to its flexibility, durability, chemical resistance, and cost-effectiveness. Its compatibility with existing recycling infrastructure further enhances its attractiveness for sustainable packaging applications. PE tethered caps are extensively used in beverage packaging, where lightweight design and ease of molding are critical. The material allows for complex hinge and tether designs without compromising opening performance or user comfort. Additionally, PE’s widespread availability and processing efficiency make it the material of choice for high-volume production. As packaging manufacturers continue to prioritize recyclability and regulatory compliance, PE is expected to maintain its dominant position throughout the forecast period.
Beverages Application Is
Expected to Lead Market Demand Through 2033
The beverages segment represents
the largest application area for tethered caps, driven by regulatory mandates
and the high volume of bottled beverage consumption globally. Water bottles,
carbonated soft drinks, and ready-to-drink beverages are primary adopters of
tethered cap solutions. Beverage brands are increasingly redesigning packaging
portfolios to align with sustainability commitments, and tethered caps have
become a standard requirement in many markets. Their ability to reduce cap
loss, improve recycling efficiency, and enhance consumer convenience has
strengthened their adoption. With beverage packaging accounting for the
majority of tethered cap installations, this segment is expected to continue
leading market demand during the forecast period.
The following segments are
part of an in-depth analysis of the global Tethered Caps market:
|
Market
Segments |
|
|
By Material |
●
Polyethylene (PE) ●
Polypropylene (PP) ●
Polyethylene
terephthalate (PET) ●
Others |
|
By Application |
●
Beverages ●
Pharmaceuticals ●
Others |
Tethered Caps Market
Share Analysis By Region
North America is
projected to hold the largest share of the global tethered caps market over the
forecast period.
North America accounted for
approximately 47.4% of the global tethered caps market in 2025, making it the
largest regional market. The region benefits from early adoption of sustainable
packaging practices, a strong presence of leading beverage brands, and
proactive regulatory initiatives aimed at reducing plastic waste. Packaging
manufacturers in North America have invested heavily in tethered cap
technologies to align with both current and anticipated regulations. High
consumer awareness regarding environmental sustainability further supports
market growth, reinforcing North America’s leadership position.
Asia Pacific is expected to
register the highest CAGR during the forecast period, driven by rapid growth in
beverage consumption, expanding urban populations, and increasing regulatory
alignment with global sustainability standards. Countries such as China, India,
and Southeast Asian nations are witnessing rising bottled beverage demand,
prompting packaging innovation. While tethered cap adoption is still in the
early stages, growing environmental awareness and multinational brand influence
are accelerating market penetration. As infrastructure and regulatory
frameworks mature, the Asia Pacific is poised to become the fastest-growing
regional market.
Tethered Caps Market Competition Landscape
Analysis
The tethered caps market is
moderately competitive, with global packaging manufacturers and closure
specialists focusing on innovation, regulatory compliance, and large-scale
production capabilities. Companies compete on material expertise, design flexibility,
sustainability credentials, and long-term supply agreements with beverage and
pharmaceutical brands.
Global Tethered Caps Market Recent Developments
News:
●
In January 2024 –
Tetra Pak and Valio introduced the first tethered cap made with certified
recycled polymers in Northern Europe. The C38 Pro tethered cap is designed to
remain attached to the packaging, supporting waste reduction and sustainable
packaging goals.
●
In December 2023 –
TriMas Packaging expanded its tethered closure portfolio with a new 38mm sports
drink tethered cap developed for Coca-Cola. Scheduled for launch and production
scale-up in mid-2024, the closure is designed for major beverage applications.
●
In January 2023 –
Berry Global and Coca-Cola partnered to introduce tethered closures in European
markets. Berry's design features a tamper-evident band that, when broken, keeps
the cap attached to the bottle for convenient drinking and re-closing, aligning
with evolving packaging regulations.
●
In November 2022 –
Landliebe launched the first combiSwift closure with a tethered cap for SIG's
carton packages. The launch came well ahead of the EU Single-Use Plastics
Directive deadline, requiring caps to remain
attached to beverage containers to facilitate recycling.
●
In September 2021 –
Elopak introduced the Pure-TwistFlip, a tethered cap option for its Pure-Pak
cartons. The closure remains attached throughout the package lifecycle, aiming
to reduce marine littering by ensuring proper cap disposal alongside the carton.
The Global Tethered Caps Market
is dominated by a few large companies, such as
●
Berry Global
●
AptarGroup Inc.
●
Closure Systems International
●
Silgan Closures
●
BERICAP
●
Tetra Pak
●
ALPLA Group
●
Huhtamaki
●
SACMI
●
Guala Closures
●
TriMas
●
Corvaglia
●
KHS GmbH
●
Resilux
●
Cap & Seal
●
Baralan
●
MJS Packaging
●
Aller Closures
●
Caplugs
●
HEUFT
● Others
Frequently Asked Questions
1. Global Tethered Caps
Market Introduction and Market Overview
1.1.
Objectives
of the Study
1.2.
Global
Tethered Caps Market Scope and Market Estimation
1.2.1.Global Tethered Caps Overall
Market Size (US$ Bn), Market CAGR (%), Market forecast (2025 - 2033)
1.2.2.Global Tethered Caps
Market Revenue Share (%) and Growth Rate (Y-o-Y) from 2020 - 2033
1.3.
Market
Segmentation
1.3.1.Material of Global Tethered
Caps Market
1.3.2.Application of Global Tethered
Caps Market
1.3.3.Region of Global Tethered
Caps Market
2. Executive
Summary
2.1.
Demand
Side Trends
2.2.
Key
Market Trends
2.3.
Market
Demand (US$ Bn) Analysis 2020 – 2024 and Forecast, 2025 – 2033
2.4.
Demand
and Opportunity Assessment
2.5.
Key
Developments
2.6.
Overview
of Tariff, Regulatory Landscape and Standards
2.7.
Market
Entry Strategies
2.8.
Market
Dynamics
2.8.1.Drivers
2.8.2.Limitations
2.8.3.Opportunities
2.8.4.Impact Analysis of Drivers
and Restraints
2.9.
Porter’s
Five Forces Analysis
2.10.
PEST
Analysis
3. Global
Tethered Caps Market Estimates
& Historical Trend Analysis (2020 - 2024)
4. Global
Tethered Caps Market Estimates
& Forecast Trend Analysis, by Material
4.1.
Global
Tethered Caps Market Revenue (US$ Bn) Estimates and Forecasts, by Material, 2020
- 2033
4.1.1.Polyethylene (PE)
4.1.2.Polypropylene (PP)
4.1.3.Polyethylene terephthalate
(PET)
4.1.4.Others
5. Global
Tethered Caps Market Estimates
& Forecast Trend Analysis, by Application
5.1.
Global
Tethered Caps Market Revenue (US$ Bn) Estimates and Forecasts, by Application,
2020 - 2033
5.1.1.Beverages
5.1.2.Pharmaceuticals
5.1.3.Others
6. Global
Tethered Caps Market Estimates
& Forecast Trend Analysis, by Region
6.1.
Global
Tethered Caps Market Revenue (US$ Bn) Estimates and Forecasts, by Region, 2020
- 2033
6.1.1.North America
6.1.2.Europe
6.1.3.Asia Pacific
6.1.4.Middle East & Africa
6.1.5.Latin America
7. North America Tethered
Caps Market: Estimates & Forecast
Trend Analysis
7.1.
North
America Tethered Caps Market Assessments & Key Findings
7.1.1.North America Tethered
Caps Market Introduction
7.1.2.North America Tethered
Caps Market Size Estimates and Forecast (US$ Billion) (2020 - 2033)
7.1.2.1. By Material
7.1.2.2. By Application
7.1.2.3.
By
Country
7.1.2.3.1. The U.S.
7.1.2.3.2. Canada
8. Europe Tethered
Caps Market: Estimates & Forecast
Trend Analysis
8.1.
Europe
Tethered Caps Market Assessments & Key Findings
8.1.1.Europe Tethered Caps
Market Introduction
8.1.2.Europe Tethered Caps
Market Size Estimates and Forecast (US$ Billion) (2020 - 2033)
8.1.2.1. By Material
8.1.2.2. By Application
8.1.2.3.
By
Country
8.1.2.3.1.
Germany
8.1.2.3.2.
Italy
8.1.2.3.3.
U.K.
8.1.2.3.4.
France
8.1.2.3.5.
Spain
8.1.2.3.6.
Switzerland
8.1.2.3.7. Rest
of Europe
9. Asia Pacific Tethered
Caps Market: Estimates & Forecast
Trend Analysis
9.1.
Asia
Pacific Market Assessments & Key Findings
9.1.1.Asia Pacific Tethered Caps
Market Introduction
9.1.2.Asia Pacific Tethered Caps
Market Size Estimates and Forecast (US$ Billion) (2020 - 2033)
9.1.2.1. By Material
9.1.2.2. By Application
9.1.2.3.
By
Country
9.1.2.3.1.
China
9.1.2.3.2.
Japan
9.1.2.3.3.
India
9.1.2.3.4.
Australia
9.1.2.3.5.
South
Korea
9.1.2.3.6. Rest of Asia Pacific
10. Middle East & Africa Tethered
Caps Market: Estimates & Forecast
Trend Analysis
10.1.
Middle
East & Africa Market Assessments & Key Findings
10.1.1.
Middle East & Africa Tethered Caps Market Introduction
10.1.2.
Middle East & Africa Tethered Caps Market Size Estimates
and Forecast (US$ Billion) (2020 - 2033)
10.1.2.1. By Material
10.1.2.2. By Application
10.1.2.3.
By
Country
10.1.2.3.1. UAE
10.1.2.3.2. Saudi
Arabia
10.1.2.3.3. South
Africa
10.1.2.3.4. Rest
of MEA
11. Latin America
Tethered Caps Market: Estimates &
Forecast Trend Analysis
11.1.
Latin
America Market Assessments & Key Findings
11.1.1.
Latin
America Tethered Caps Market Introduction
11.1.2.
Latin
America Tethered Caps Market Size Estimates and Forecast (US$ Billion) (2020 - 2033)
11.1.2.1. By Material
11.1.2.2. By Application
11.1.2.3.
By
Country
11.1.2.3.1. Brazil
11.1.2.3.2. Argentina
11.1.2.3.3. Mexico
11.1.2.3.4. Rest
of LATAM
12. Country Wise Market:
Introduction
13.
Competition
Landscape
13.1.
Global
Tethered Caps Market Product Mapping
13.2.
Global
Tethered Caps Market Concentration Analysis, by Leading Players / Innovators /
Emerging Players / New Entrants
13.3.
Global
Tethered Caps Market Tier Structure Analysis
13.4.
Global
Tethered Caps Market Concentration & Company Market Shares (%) Analysis,
2024
14.
Company
Profiles
14.1.
Berry Global
14.1.1.
Company
Overview & Key Stats
14.1.2.
Financial
Performance & KPIs
14.1.3.
Product
Portfolio
14.1.4.
SWOT
Analysis
14.1.5.
Business
Strategy & Recent Developments
* Similar details would be provided for all the players
mentioned below
14.2. AptarGroup
Inc.
14.3. Closure
Systems International
14.4. Silgan
Closures
14.5. BERICAP
14.6. Tetra
Pak
14.7. ALPLA
Group
14.8. Huhtamaki
14.9. SACMI
14.10. Guala
Closures
14.11. TriMas
14.12. Corvaglia
14.13. KHS GmbH
14.14. Resilux
14.15. Cap
& Seal
14.16. Baralan
14.17. MJS
Packaging
14.18. Aller
Closures
14.19. Caplugs
14.20. HEUFT
14.21. Others
15. Research
Methodology
15.1.
External
Transportations / Databases
15.2.
Internal
Proprietary Database
15.3.
Primary
Research
15.4.
Secondary
Research
15.5.
Assumptions
15.6.
Limitations
15.7.
Report
FAQs
16. Research
Findings & Conclusion
Our Research Methodology
"Insight without rigor is just noise."
We follow a comprehensive, multi-phase research framework designed to deliver accurate, strategic, and decision-ready intelligence. Our process integrates primary and secondary research , both quantitative and qualitative , along with dual modeling techniques ( top-down and bottom-up) and a final layer of validation through our proprietary in-house repository.
PRIMARY RESEARCH
Primary research captures real-time, firsthand insights from the market to understand behaviors, motivations, and emerging trends.
1. Quantitative Primary Research
Objective: Generate statistically significant data directly from market participants.
Approaches:- Structured surveys with customers, distributors, and field agents
- Mobile-based data collection for point-of-sale audits and usage behavior
- Phone-based interviews (CATI) for market sizing and product feedback
- Online polling around industry events and digital campaigns
- Purchase frequency by customer type
- Channel performance across geographies
- Feature demand by application or demographic
2. Qualitative Primary Research
Objective: Explore decision-making drivers, pain points, and market readiness.
Approaches:- In-depth interviews (IDIs) with executives, product managers, and key decision-makers
- Focus groups among end users and early adopters
- Site visits and observational research for consumer products
- Informal field-level discussions for regional and cultural nuances
SECONDARY RESEARCH
This phase helps establish a macro-to-micro understanding of market trends, size, regulation, and competitive dynamics, sourced from credible and public domain information.
1. Quantitative Secondary Research
Objective: Model market value and segment-level forecasts based on published data.
Sources include:- Financial reports and investor summaries
- Government trade data, customs records, and regulatory statistics
- Industry association publications and economic databases
- Channel performance and pricing data from marketplace listings
- Revenue splits, pricing trends, and CAGR estimates
- Supply-side capacity and volume tracking
- Investment analysis and funding benchmarks
2. Qualitative Secondary Research
Objective: Capture strategic direction, innovation signals, and behavioral trends.
Sources include:- Company announcements, roadmaps, and product pipelines
- Publicly available whitepapers, conference abstracts, and academic research
- Regulatory body publications and policy briefs
- Social and media sentiment scanning for early-stage shifts
- Strategic shifts in market positioning
- Unmet needs and white spaces
- Regulatory triggers and compliance impact

DUAL MODELING: TOP-DOWN + BOTTOM-UP
To ensure robust market estimation, we apply two complementary sizing approaches:
Top-Down Modeling:- Start with broader industry value (e.g., global or regional TAM)
- Apply filters by segment, geography, end-user, or use case
- Adjust with primary insights and validation benchmarks
- Ideal for investor-grade market scans and opportunity mapping
- Aggregate from the ground up using sales volumes, pricing, and unit economics
- Use internal modeling templates aligned with stakeholder data
- Incorporate distributor-level or region-specific inputs
- Most accurate for emerging segments and granular sub-markets
DATA VALIDATION: IN-HOUSE REPOSITORY
We close the loop with proprietary data intelligence built from ongoing projects, industry monitoring, and historical benchmarking. This repository includes:
- Multi-sector market and pricing models
- Key trendlines from past interviews and forecasts
- Benchmarked adoption rates, churn patterns, and ROI indicators
- Industry-specific deviation flags and cross-check logic
- Catches inconsistencies early
- Aligns projections across studies
- Enables consistent, high-trust deliverables