
Virtual Desktop Infrastructure Market Size and Forecast (2020 - 2033), Global and Regional Growth, Trend, Share and Industry Analysis Report Coverage; By Component (Hardware, Software and Services); By Deployment (Cloud and On-premise); By Type (Persistent VDI and Non-Persistent VDI); By Enterprise Size (Large Enterprises and Small and Medium-sized Enterprises (SMEs)), By End-user (IT & Telecom, Banking, Financial Services, and Insurance (BFSI), Healthcare & Life Sciences, Education, Government & Public Sector, Manufacturing, Retail & E-commerce, Media & Entertainment, Energy & Utilities and Others) and Geography
2025-11-03
ICT
Ekta Chaurasia (Team Lead)
Description
Virtual Desktop Infrastructure Market Overview
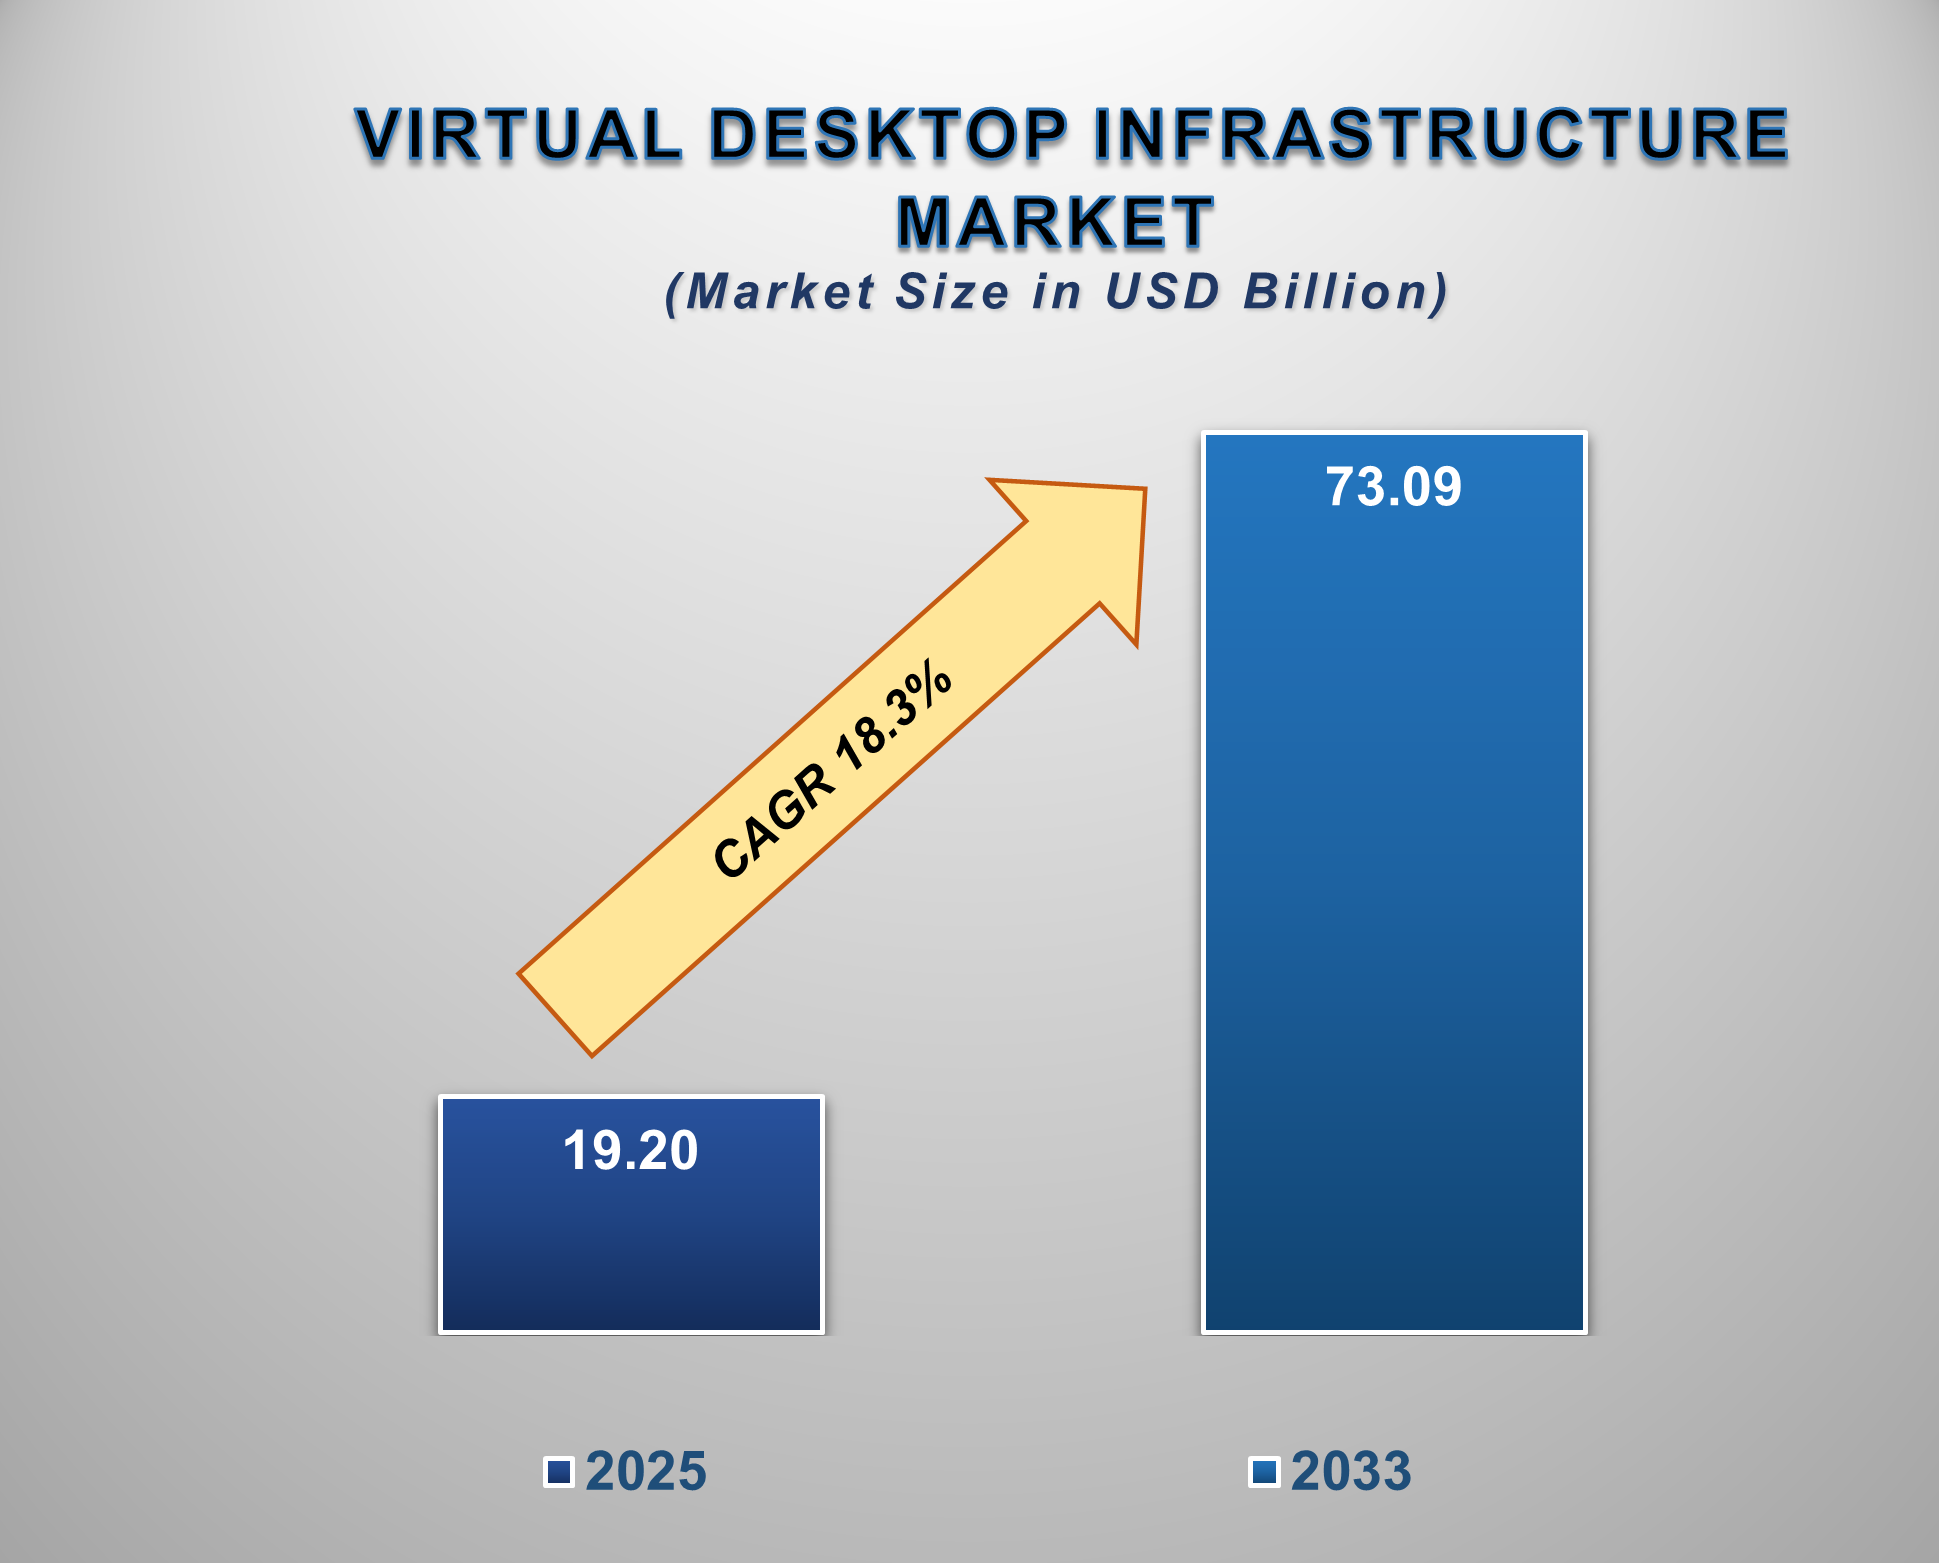
The global Virtual Desktop Infrastructure (VDI) market is in a robust growth phase, aided by macro trends like remote/hybrid work, cloud adoption, and security/compliance needs. Valued at USD 19.20 billion in 2025, the market is projected to reach USD 73.09 billion by 2033, growing at a CAGR of 18.3% during the forecast period. This growth will be supported by migration from traditional desktops to virtualized/cloud models and by increased adoption across verticals and geographies. The global Virtual Desktop Infrastructure (VDI) market is experiencing significant growth, driven by evolving work models and increasing emphasis on data security and operational efficiency.
The Global Virtual Desktop
Infrastructure (VDI) Market refers to the worldwide ecosystem of technologies,
solutions, and services that enable the virtualization of desktop environments,
allowing users to access their operating systems, applications, and data from a
centralized server or cloud-based platform rather than from a local physical
computer. In a virtual desktop infrastructure setup, desktop instances are
hosted on virtual machines (VMs) running in centralized data centers or cloud
environments. Users can securely connect to these desktops from any device,
such as laptops, thin clients, tablets, or smartphones, via the internet or a
private network. Virtual Desktop Infrastructure is a technology that
virtualizes desktop environments, hosting them on centralized servers so users
can securely access their desktops and applications from any device, anywhere.
Virtual Desktop
Infrastructure (VDI) Market Drivers and Opportunities
Remote Work, Hybrid Work & Digital Workplace are
anticipated to lift the Virtual Desktop Infrastructure market growth during the
forecast period
This surge in market size is
primarily attributed to the evolving work environment. The shift towards remote
and hybrid work necessitates secure, scalable, and centralized IT solutions to
support a distributed workforce. Virtual Desktop Infrastructure enables
organizations to deliver virtual desktops to employees, ensuring consistent
access to applications and data from various locations and devices. This
capability is crucial for maintaining productivity and security in a
decentralized work setting. Furthermore, the digital workplace transformation
is accelerating the adoption of Virtual Desktop Infrastructure. Companies are
increasingly investing in cloud-based infrastructure to facilitate
collaboration, enhance flexibility, and improve cost efficiency. The
integration of Virtual Desktop Infrastructure with cloud platforms allows
businesses to scale their IT resources dynamically, aligning with the
fluctuating demands of modern work environments. In summary, the convergence of
remote work, hybrid work models, and the digital workplace transformation is
propelling the Virtual Desktop Infrastructure market forward. Organizations are
leveraging Virtual Desktop Infrastructure solutions to create secure, flexible,
and efficient workspaces that meet the needs of a modern, distributed
workforce.
Emergence of Desktop-as-a-Service (DaaS) is a vital driver
for influencing the growth of the global Virtual Desktop Infrastructure market
The emergence of
Desktop-as-a-Service (DaaS) is acting as a powerful accelerator for the broader
Virtual Desktop Infrastructure (VDI) market by democratizing desktop
virtualization and overcoming traditional Virtual Desktop Infrastructure
barriers. DaaS, which is essentially a cloud-hosted and managed Virtual Desktop
Infrastructure solution, converts the significant upfront capital expenditure
(CapEx) of on-premises Virtual Desktop Infrastructure for hardware, servers,
and licensing into a predictable, subscription-based operating expense (OpEx).
This shift makes desktop virtualization accessible, especially to Small and
Medium-sized Enterprises (SMEs), which typically lack the large IT budgets and
specialized staff required for complex Virtual Desktop Infrastructure
deployments. The compelling value proposition of DaaS, centered on scalability,
simplified management, and flexibility, has been further amplified by the
global, enduring trend toward hybrid and remote work models. A substantial
majority of new desktop virtualization deployments are now choosing the DaaS
model over traditional on-premises Virtual Desktop Infrastructure, with some
analysts predicting that nearly 80% of virtual desktops will be delivered via
DaaS by 2024, up from around 30% in 2021. This rapid cloud migration within
desktop virtualization is fundamentally driving the overall growth and
expansion of the Virtual Desktop Infrastructure market.
Advancements in Technology - Virtualization, AI/Automation,
and Network Improvements are poised to create significant opportunities in the
global Virtual Desktop Infrastructure market
Advancements across
Virtualization, AI/Automation, and Network Improvements are collectively
creating a highly lucrative environment for the Virtual Desktop Infrastructure
(VDI) market. Improved Virtualization technology, especially in the form of
Desktop-as-a-Service (DaaS) or Cloud VDI, lowers the total cost of ownership by
reducing reliance on expensive endpoint hardware and simplifying centralized
management. For example, the cloud deployment model already holds a dominant
market share, showcasing the shift away from traditional on-premises setups due
to the enhanced scalability, flexibility, and reduced capital expenditures
offered by cloud-hosted virtual desktops. Furthermore, the integration of AI
and Automation is fundamentally enhancing the Virtual Desktop Infrastructure
user experience and operational efficiency; AI-driven tools are now being used
for predictive maintenance, optimizing resource allocation, and providing
intelligent analytics, which significantly streamlines IT operations. Finally,
Network Improvements, particularly the global rollout of 5G networks and the
growing adoption of Software-Defined Wide Area Networking (SD-WAN), address
VDI's traditional dependency on stable, high-bandwidth connections. These
advancements enable faster load times, reduced latency, and a much smoother
user experience, even for graphics-intensive applications or for a dispersed,
hybrid workforce, a critical factor given that over 80% of global enterprises
now support hybrid or remote work models, making reliable network performance
an absolute necessity for VDI's continued mass adoption.
Virtual Desktop Infrastructure Market Scope
|
Report Attributes |
Description |
|
Market Size in 2025 |
USD 19.20 Billion |
|
Market Forecast in 2033 |
USD 73.09 Billion |
|
CAGR % 2025-2033 |
18.3% |
|
Base Year |
2024 |
|
Historic Data |
2020-2024 |
|
Forecast Period |
2025-2033 |
|
Report USP |
Production, Consumption, Company Share, Company Heatmap, Company
Production, Service Type, Growth Factors and more |
|
Segments Covered |
●
By Component ●
By Deployment ●
By Type ●
By Enterprise Size ●
By End-user |
|
Regional Scope |
●
North America ●
Europe ●
APAC ●
Latin America ●
Middle East and Africa |
|
Country Scope |
1)
U.S. 2)
Canada 3)
U.K. 4)
Germany 5)
France 6)
Italy 7)
Spain 8)
Netherlands 9)
China 10)
India 11)
Japan 12)
South Korea 13)
Australia 14)
Mexico 15)
Brazil 16)
Argentina 17)
Saudi Arabia 18)
UAE 19)
Egypt 20) South Africa |
Virtual Desktop Infrastructure Market Report Segmentation
Analysis
The global Virtual Desktop
Infrastructure Market industry analysis is segmented by component, deployment,
type, enterprise size, end-user, and region.
Software Dominates the Component Segment
By Component, the Virtual Desktop
Infrastructure market is segmented into Hardware, Software, and Services. The
Software component, which includes the core virtualization platform
(hypervisor) and the Virtual Desktop Infrastructure management/connection broker
software, consistently holds the largest share of the market revenue. This
dominance is attributed to the growing adoption of cloud-based solutions and
the rising demand for enhanced security and operational efficiency in IT
operations. Virtual Desktop Infrastructure fundamentally relies on specialized
software. This software is essential for creating, managing, and delivering
virtual desktop environments. Without the Virtual Desktop Infrastructure
platform and management tools, the infrastructure cannot function.
Cloud holds the highest share of the Deployment Segment
Based on deployment, the market
is bifurcated into cloud and on-premise. The cloud segment held a substantial
lead in 2024, capturing more than 60.8% of the market share. This dominance is
expected to persist throughout the forecast period. Cloud-based Virtual Desktop
Infrastructure (VDI) solutions offer scalable resources that can be adjusted
according to organizational needs, facilitating rapid deployment and
adaptability. Organizations can reduce capital expenditures by leveraging cloud
infrastructure, opting for a pay-as-you-go model that aligns with usage.
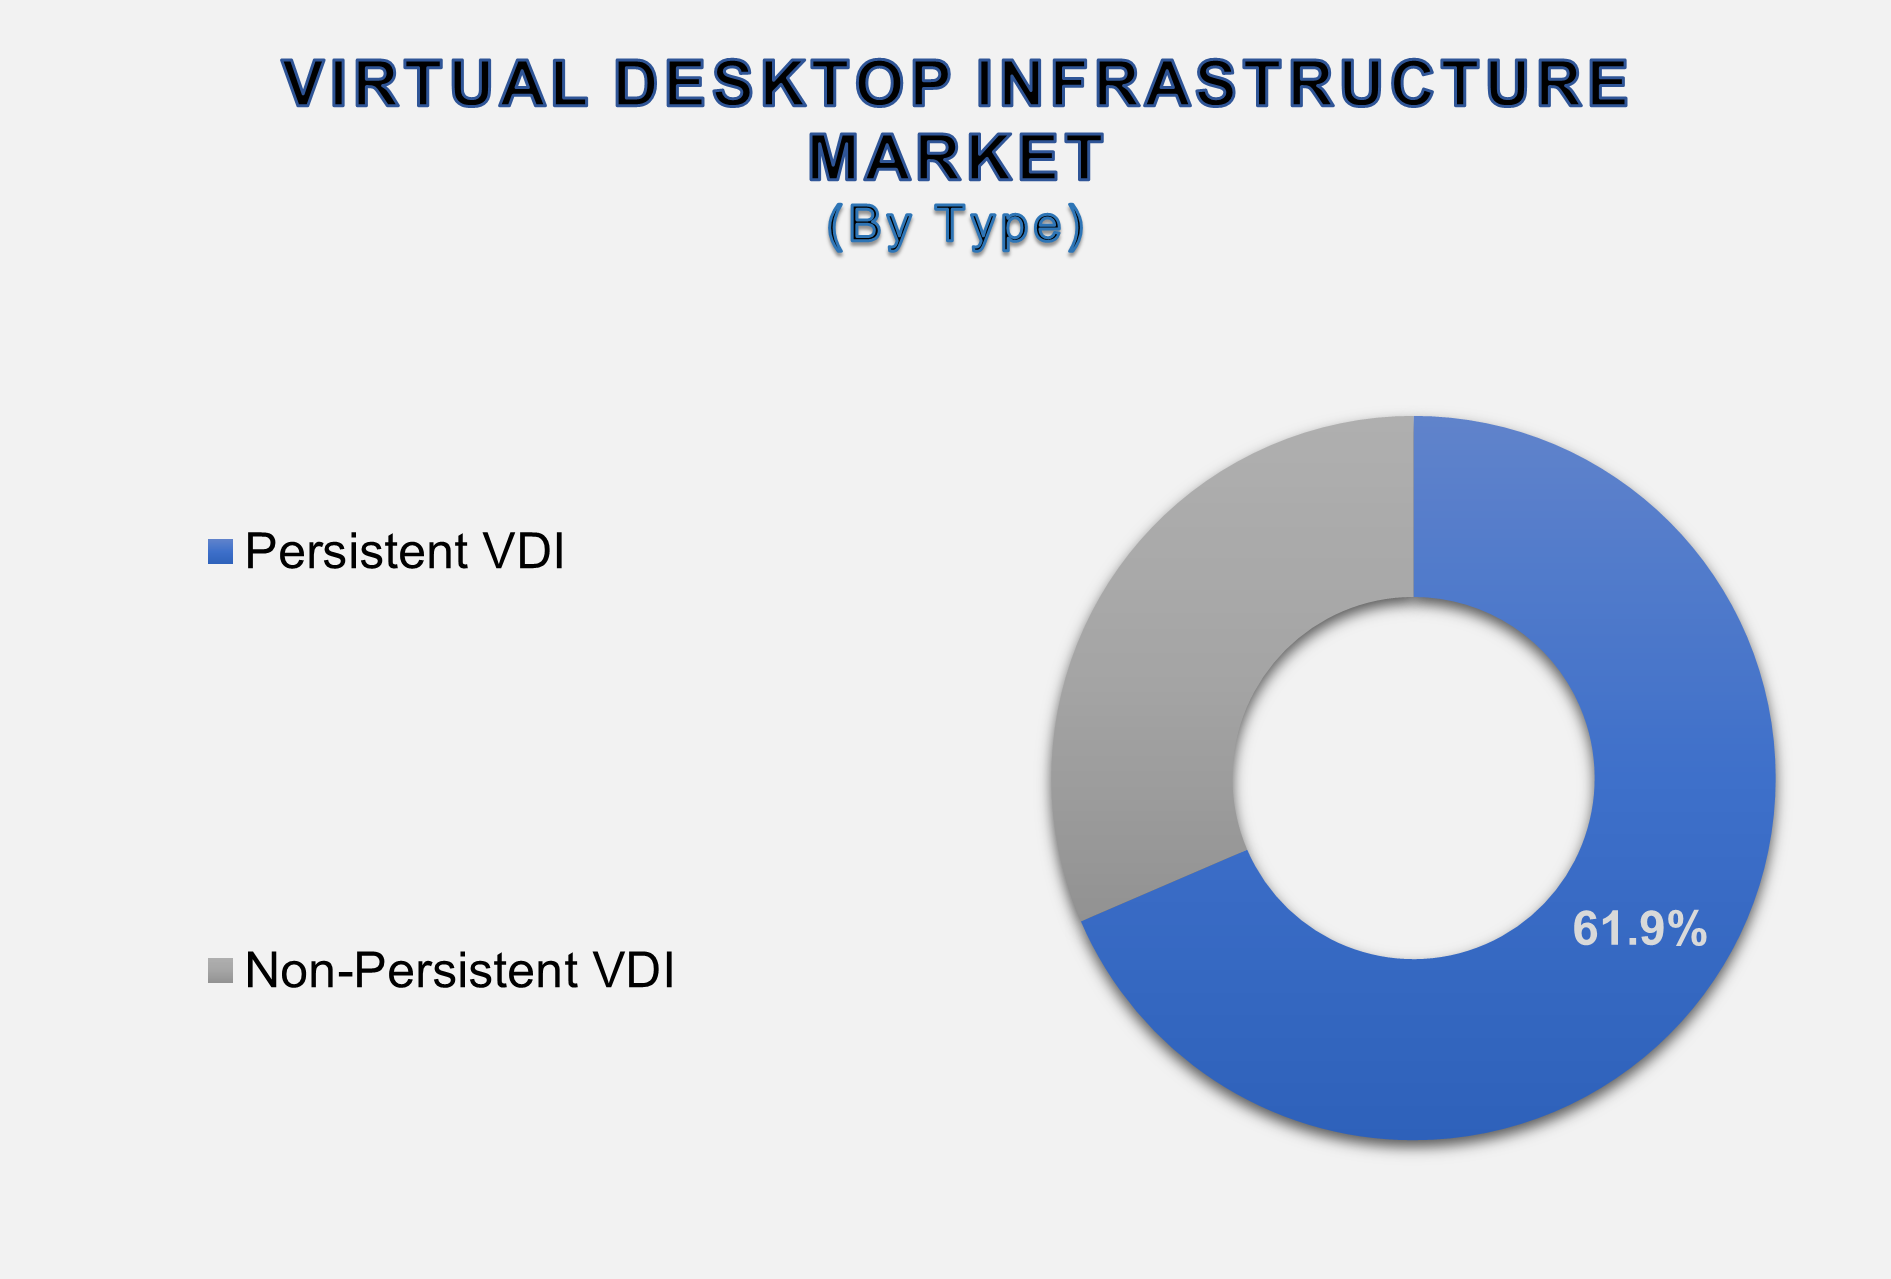
Persistent VDI Segment Leads by Type
In terms of type, the Virtual Desktop Infrastructure market is segmented into Persistent VDI and Non-Persistent VDI. In 2024, Persistent VDI led the market with a share of 61.9%. This model is characterized by each user having a dedicated virtual desktop that retains personalized settings and data across sessions. Persistent VDI provides users with a personalized desktop experience, similar to traditional PCs, which is essential for roles requiring specific configurations and applications. Industries such as finance and healthcare prefer persistent VDI for its ability to maintain data within secure, on-premise environments, aiding in compliance with regulatory standards. Organizations with legacy applications benefit from Persistent VDI's ability to support complex configurations and software requirements.
Large Enterprises Segment
Leads by Enterprise Size
In terms of type, the Virtual
Desktop Infrastructure market is segmented into Large Enterprises and Small and
Medium-sized Enterprises (SMEs). Large enterprises currently dominate the
Virtual Desktop Infrastructure market. Large enterprises require robust,
scalable, and secure IT solutions to manage their extensive operations. The
shift towards flexible work arrangements has accelerated the adoption of
Virtual Desktop Infrastructure solutions to ensure secure and efficient access
to corporate resources. Industries such as finance, healthcare, and government
necessitate stringent data security and compliance measures, which Virtual
Desktop Infrastructure solutions can effectively address.
IT & Telecom is a key end-user
In terms of End-user, the Virtual
Desktop Infrastructure market is segmented into IT & Telecom, Banking,
Financial Services, and Insurance (BFSI), Healthcare & Life Sciences,
Education, Government & Public Sector, Manufacturing, Retail & E-commerce,
Media & Entertainment, Energy & Utilities, and Others. IT & Telecom
dominates the Virtual Desktop Infrastructure market due to the need for
centralized management and secure remote access. The sector's infrastructure is
well-suited for Virtual Desktop Infrastructure deployment, leading to
widespread adoption. Furthermore, the BFSI sector is experiencing significant
growth in Virtual Desktop Infrastructure adoption, driven by stringent
regulatory requirements and the need for secure data handling. Virtual Desktop
Infrastructure solutions help financial institutions maintain compliance and
protect sensitive information.
The following segments are part of an in-depth analysis of the global
Virtual Desktop Infrastructure Market:
|
Market Segments |
|
|
By Component
|
●
Hardware ●
Software ●
Services |
|
By Deployment |
●
Cloud ●
On-premise |
|
By Type |
●
Persistent VDI ●
Non-Persistent VDI |
|
By Enterprise Size |
●
Large Enterprises ●
Small and
Medium-sized Enterprises (SMEs) |
|
By End-user |
●
IT & Telecom ●
Banking, Financial
Services, and Insurance (BFSI) ●
Healthcare &
Life Sciences ●
Education ●
Government &
Public Sector ●
Manufacturing ●
Retail &
E-commerce ●
Media &
Entertainment ●
Energy &
Utilities ●
Others |
Virtual Desktop
Infrastructure Market Share Analysis by Region
The North America region is projected to hold the largest
share of the global Virtual Desktop Infrastructure Market over the forecast
period.
North America holds the largest
market share in the global Virtual Desktop Infrastructure market. North
America, particularly the U.S., is characterized by a high rate of early
adoption of advanced IT infrastructure and emerging technologies like cloud computing
and virtualization. The region is home to major Virtual Desktop Infrastructure
and cloud service providers such as Microsoft (Azure Virtual Desktop), VMware,
Citrix, and AWS (Amazon WorkSpaces). This concentration of vendors drives
innovation and widespread deployment. The rapid migration to cloud deployment
models, specifically Desktop as a Service (DaaS), is significant in this
region. This shift provides scalability and cost-efficiency, further driving
Virtual Desktop Infrastructure adoption. The region saw a large-scale and
sustained shift toward remote and hybrid work models, which has fundamentally
increased the demand for Virtual Desktop Infrastructure to ensure employees
have secure, flexible, and reliable access to corporate resources from any
location. Furthermore, the Asia Pacific (APAC) region is consistently projected
to be the fastest-growing regional market for Virtual Desktop Infrastructure,
exhibiting the highest Compound Annual Growth Rate (CAGR) during the forecast
period. Countries like China, India, Japan, South Korea, and the ASEAN nations
are undergoing aggressive digital transformation across all industry verticals,
which is a major catalyst for Virtual Desktop Infrastructure adoption. The
growing trend of enterprise mobility and the implementation of Bring Your Own
Device (BYOD) policies across a large and expanding workforce necessitates
Virtual Desktop Infrastructure solutions to provide secure access to corporate
applications and data, regardless of the user's device.
Global Virtual Desktop
Infrastructure Market Recent Developments News:
- In October
2025, Microsoft rolled out updates to its new Virtual Desktop
Infrastructure solution for Teams, including a new plug-in and updates to
the Slimcore media engine. This aims to improve performance and
functionality for Teams within virtualized environments, a key requirement
for hybrid work.
- In July 2025, the
Omnissa (formerly VMware End-User Computing) Horizon platform included
support for 120 frames per second (FPS) frame rates in its Blast protocol.
This is a significant performance enhancement, particularly for power
users like designers, engineers, or video editors who require
high-fidelity virtual desktops.
- In June 2024, Google
acquired virtual application delivery platform Cameyo. This move is aimed
at improving Google's capability to deliver virtualized Windows
applications on ChromeOS, positioning them for stronger direct competition
with established Virtual Desktop Infrastructure players like Citrix and
Microsoft.
The Global Virtual
Desktop Infrastructure Market is dominated by a few large companies, such as
●
Microsoft Corporation
●
Citrix Systems, Inc.
●
Omnissa
●
Amazon Web Services
●
Nutanix, Inc.
●
Cisco Systems, Inc.
●
Dell Technologies Inc.
●
Hewlett Packard
Enterprise (HPE)
●
IBM Corporation
●
Huawei Technologies
Co., Ltd.
●
Oracle Corporation
●
Parallels
International GmbH
●
Kasm Technologies
●
V2 Cloud
●
Sangfor
●
Red Hat, Inc.
●
Fujitsu Limited
● Other Prominent Players
Frequently Asked Questions
Ekta Chaurasia (Team Lead)
Ekta Chaurasia is a highly experienced Team Lead at M2Square Consultancy with over 7 years of expertise in market research, strategic consulting, competitive benchmarking, and business intelligence solutions. She specializes in ICT, semiconductors & electronics, automotive & transportation, and industrial machinery markets.
She leads end-to-end global research projects focused on market trends, industry analysis, growth forecasting, customer insights, and strategic decision-making. Known for her analytical leadership and industry expertise, Ekta helps businesses uncover growth opportunities, evaluate competitive landscapes, and stay ahead in rapidly evolving markets through accurate and insight-driven research.
1.
Global Virtual Desktop Infrastructure Market Introduction and
Market Overview
1.1.
Objectives of the Study
1.2.
Global Virtual Desktop Infrastructure Market Scope and Market
Estimation
1.2.1.Global Virtual
Desktop Infrastructure Market Overall Market Size (US$ Bn), Market CAGR (%),
Market forecast (2025 - 2033)
1.2.2.Global Virtual
Desktop Infrastructure Market Revenue Share (%) and Growth Rate (Y-o-Y) from 2020
- 2033
1.3.
Market Segmentation
1.3.1.Component of
Global Virtual Desktop Infrastructure Market
1.3.2.Deployment of
Global Virtual Desktop Infrastructure Market
1.3.3.Type of
Global Virtual Desktop Infrastructure Market
1.3.4.Enterprise
Size of Global Virtual Desktop Infrastructure Market
1.3.5.End-user of Virtual
Desktop Infrastructure Market
1.3.6.Region of
Global Virtual Desktop Infrastructure Market
2.
Executive
Summary
2.1.
Demand Side Trends
2.2.
Key Market Trends
2.3.
Market Demand (US$ Bn) Analysis 2020 – 2024 and Forecast, 2025 – 2033
2.4.
Demand and Opportunity Assessment
2.5.
Demand Supply Scenario
2.6.
Market Dynamics
2.6.1.Drivers
2.6.2.Limitations
2.6.3.Opportunities
2.6.4.Impact
Analysis of Drivers and Restraints
2.7.
Emerging Trends for Virtual Desktop Infrastructure Market
2.8.
Key Products/Brand Analysis
2.9.
Porter’s Five Forces Analysis
2.10. PEST
Analysis
2.11. Key
Regulation
3.
Global
Virtual Desktop Infrastructure Market Estimates & Historical Trend Analysis (2020 - 2024)
4. Global Virtual Desktop Infrastructure Market Estimates & Forecast Trend Analysis, by Component
4.1.
Global Virtual Desktop Infrastructure Market Revenue (US$ Bn) Estimates
and Forecasts, by Component, 2020 - 2033
4.1.1.Hardware
4.1.2.Software
4.1.3.Services
5. Global Virtual Desktop Infrastructure Market Estimates & Forecast Trend Analysis, by Deployment
5.1.
Global Virtual Desktop Infrastructure Market Revenue (US$ Bn)
Estimates and Forecasts, by Deployment, 2020 - 2033
5.1.1.Cloud
5.1.2.On-premise
6. Global Virtual Desktop Infrastructure Market Estimates & Forecast Trend Analysis, by Type
6.1.
Global Virtual Desktop Infrastructure Market Revenue (US$ Bn)
Estimates and Forecasts, by Type, 2020 - 2033
6.1.1.Persistent
VDI
6.1.2.Non-Persistent
VDI
7. Global Virtual Desktop Infrastructure Market Estimates & Forecast Trend Analysis, by Enterprise Size
7.1.
Global Virtual Desktop Infrastructure Market Revenue (US$ Bn)
Estimates and Forecasts, by Enterprise Size, 2020 - 2033
7.1.1.Large
Enterprises
7.1.2.Small and
Medium-sized Enterprises (SMEs)
8. Global Virtual Desktop Infrastructure Market Estimates & Forecast Trend Analysis, by End-user
8.1.
Global Virtual Desktop Infrastructure Market Revenue (US$ Bn)
Estimates and Forecasts, by End-user, 2020 - 2033
8.1.1.IT &
Telecom
8.1.2.Banking,
Financial Services, and Insurance (BFSI)
8.1.3.Healthcare
& Life Sciences
8.1.4.Education
8.1.5.Government
& Public Sector
8.1.6.Manufacturing
8.1.7.Retail &
E-commerce
8.1.8.Media &
Entertainment
8.1.9.Energy &
Utilities
8.1.10.
Others
9.
Global
Virtual Desktop Infrastructure Market Estimates & Forecast Trend Analysis, by Region
1.1.
Global Virtual Desktop Infrastructure Market Revenue (US$ Bn)
Estimates and Forecasts, by Region, 2020 - 2033
1.1.1.North America
1.1.2.Europe
1.1.3.Asia Pacific
1.1.4.Middle East
& Africa
1.1.5.Latin America
10.
North America Virtual
Desktop Infrastructure Market:
Estimates & Forecast Trend Analysis
10.1.
North America Virtual Desktop Infrastructure Market Assessments
& Key Findings
10.1.1.
North America Virtual Desktop Infrastructure Market Introduction
10.1.2.
North America Virtual Desktop Infrastructure Market Size Estimates
and Forecast (US$ Billion) (2020 - 2033)
10.1.2.1.
By Component
10.1.2.2.
By Deployment
10.1.2.3.
By Type
10.1.2.4.
By Enterprise Size
10.1.2.5.
By End-user
10.1.2.6.
By Country
10.1.2.6.1. The
U.S.
10.1.2.6.2. Canada
11.
Europe Virtual
Desktop Infrastructure Market:
Estimates & Forecast Trend Analysis
11.1. Europe
Virtual Desktop Infrastructure Market Assessments & Key Findings
11.1.1.
Europe Virtual Desktop Infrastructure Market Introduction
11.1.2.
Europe Virtual Desktop Infrastructure Market Size Estimates and
Forecast (US$ Billion) (2020 - 2033)
11.1.2.1.
By Component
11.1.2.2.
By Deployment
11.1.2.3.
By Type
11.1.2.4.
By Enterprise Size
11.1.2.5.
By End-user
11.1.2.6.
By Country
11.1.2.6.1.
Germany
11.1.2.6.2.
Italy
11.1.2.6.3.
U.K.
11.1.2.6.4.
France
11.1.2.6.5.
Spain
11.1.2.6.6.
Netherland
11.1.2.6.7. Rest of Europe
12.
Asia Pacific Virtual
Desktop Infrastructure Market:
Estimates & Forecast Trend Analysis
12.1. Asia
Pacific Market Assessments & Key Findings
12.1.1.
Asia Pacific Virtual Desktop Infrastructure Market Introduction
12.1.2.
Asia Pacific Virtual Desktop Infrastructure Market Size Estimates
and Forecast (US$ Billion) (2020 - 2033)
12.1.2.1.
By Component
12.1.2.2.
By Deployment
12.1.2.3.
By Type
12.1.2.4.
By Enterprise Size
12.1.2.5.
By End-user
12.1.2.6.
By Country
12.1.2.6.1.
China
12.1.2.6.2.
Japan
12.1.2.6.3.
India
12.1.2.6.4.
Australia
12.1.2.6.5.
South Korea
12.1.2.6.6. Rest
of Asia Pacific
13.
Middle East & Africa Virtual Desktop Infrastructure Market: Estimates & Forecast Trend Analysis
13.1. Middle
East & Africa Market Assessments & Key Findings
13.1.1.
Middle East & Africa Virtual
Desktop Infrastructure Market Introduction
13.1.2.
Middle East & Africa Virtual
Desktop Infrastructure Market Size Estimates and Forecast (US$ Billion) (2020 -
2033)
13.1.2.1.
By Component
13.1.2.2.
By Deployment
13.1.2.3.
By Type
13.1.2.4.
By Enterprise Size
13.1.2.5.
By End-user
13.1.2.6.
By Country
13.1.2.6.1.
UAE
13.1.2.6.2.
Saudi Arabia
13.1.2.6.3.
South Africa
13.1.2.6.4. Rest of MEA
14.
Latin America Virtual
Desktop Infrastructure Market:
Estimates & Forecast Trend Analysis
14.1. Latin
America Market Assessments & Key Findings
14.1.1.
Latin America Virtual Desktop Infrastructure Market Introduction
14.1.2.
Latin America Virtual Desktop Infrastructure Market Size Estimates
and Forecast (US$ Billion) (2020 - 2033)
14.1.2.1.
By Component
14.1.2.2.
By Deployment
14.1.2.3.
By Type
14.1.2.4.
By Enterprise Size
14.1.2.5.
By End-user
14.1.2.6.
By Country
14.1.2.6.1.
Brazil
14.1.2.6.2.
Mexico
14.1.2.6.3.
Argentina
14.1.2.6.4. Rest of LATAM
15.
Country Wise Market: Introduction
16. Competition
Landscape
16.1. Global
Virtual Desktop Infrastructure Market Product Mapping
16.2. Global
Virtual Desktop Infrastructure Market Concentration Analysis, by Leading
Players / Innovators / Emerging Players / New Entrants
16.3. Global
Virtual Desktop Infrastructure Market Tier Structure Analysis
16.4. Global
Virtual Desktop Infrastructure Market Concentration & Company Market Shares
(%) Analysis, 2024
17. Company
Profiles
17.1. Microsoft Corporation
17.1.1.
Company Overview & Key Stats
17.1.2.
Financial Performance & KPIs
17.1.3.
Product Portfolio
17.1.4.
SWOT Analysis
17.1.5.
Business Strategy & Recent Developments
*
Similar details would be provided for all the players mentioned below
17.2.
Citrix Systems, Inc.
17.3.
Omnissa
17.4.
Amazon Web Services
17.5.
Nutanix, Inc.
17.6.
Cisco Systems, Inc.
17.7.
Dell Technologies Inc.
17.8.
Hewlett Packard Enterprise (HPE)
17.9.
IBM Corporation
17.10.
Huawei Technologies Co., Ltd.
17.11.
Oracle Corporation
17.12.
Parallels International GmbH
17.13.
Kasm Technologies
17.14.
V2 Cloud
17.15.
Sangfor
17.16.
Red Hat, Inc.
17.17.
Fujitsu Limited
17.18.
Other Prominent Players
18.
Research
Methodology
18.1. External
Transportations / Databases
18.2. Internal
Proprietary Database
18.3. Primary
Research
18.4. Secondary
Research
18.5. Assumptions
18.6. Limitations
18.7. Report
FAQs
19.
Research
Findings & Conclusion
Our Research Methodology
"Insight without rigor is just noise."
We follow a comprehensive, multi-phase research framework designed to deliver accurate, strategic, and decision-ready intelligence. Our process integrates primary and secondary research , both quantitative and qualitative , along with dual modeling techniques ( top-down and bottom-up) and a final layer of validation through our proprietary in-house repository.
PRIMARY RESEARCH
Primary research captures real-time, firsthand insights from the market to understand behaviors, motivations, and emerging trends.
1. Quantitative Primary Research
Objective: Generate statistically significant data directly from market participants.
Approaches:- Structured surveys with customers, distributors, and field agents
- Mobile-based data collection for point-of-sale audits and usage behavior
- Phone-based interviews (CATI) for market sizing and product feedback
- Online polling around industry events and digital campaigns
- Purchase frequency by customer type
- Channel performance across geographies
- Feature demand by application or demographic
2. Qualitative Primary Research
Objective: Explore decision-making drivers, pain points, and market readiness.
Approaches:- In-depth interviews (IDIs) with executives, product managers, and key decision-makers
- Focus groups among end users and early adopters
- Site visits and observational research for consumer products
- Informal field-level discussions for regional and cultural nuances
SECONDARY RESEARCH
This phase helps establish a macro-to-micro understanding of market trends, size, regulation, and competitive dynamics, sourced from credible and public domain information.
1. Quantitative Secondary Research
Objective: Model market value and segment-level forecasts based on published data.
Sources include:- Financial reports and investor summaries
- Government trade data, customs records, and regulatory statistics
- Industry association publications and economic databases
- Channel performance and pricing data from marketplace listings
- Revenue splits, pricing trends, and CAGR estimates
- Supply-side capacity and volume tracking
- Investment analysis and funding benchmarks
2. Qualitative Secondary Research
Objective: Capture strategic direction, innovation signals, and behavioral trends.
Sources include:- Company announcements, roadmaps, and product pipelines
- Publicly available whitepapers, conference abstracts, and academic research
- Regulatory body publications and policy briefs
- Social and media sentiment scanning for early-stage shifts
- Strategic shifts in market positioning
- Unmet needs and white spaces
- Regulatory triggers and compliance impact

DUAL MODELING: TOP-DOWN + BOTTOM-UP
To ensure robust market estimation, we apply two complementary sizing approaches:
Top-Down Modeling:- Start with broader industry value (e.g., global or regional TAM)
- Apply filters by segment, geography, end-user, or use case
- Adjust with primary insights and validation benchmarks
- Ideal for investor-grade market scans and opportunity mapping
- Aggregate from the ground up using sales volumes, pricing, and unit economics
- Use internal modeling templates aligned with stakeholder data
- Incorporate distributor-level or region-specific inputs
- Most accurate for emerging segments and granular sub-markets
DATA VALIDATION: IN-HOUSE REPOSITORY
We close the loop with proprietary data intelligence built from ongoing projects, industry monitoring, and historical benchmarking. This repository includes:
- Multi-sector market and pricing models
- Key trendlines from past interviews and forecasts
- Benchmarked adoption rates, churn patterns, and ROI indicators
- Industry-specific deviation flags and cross-check logic
- Catches inconsistencies early
- Aligns projections across studies
- Enables consistent, high-trust deliverables